
Abstract
A health monitoring and diagnosis system for heavy roll grinding machine is reported in this article. It consists of field monitoring system, remote service system, and collaborative management system. The architecture of the health monitoring and diagnosis system is discussed in detail including placement of the vibration sensors, system configuration of the monitoring and diagnostic instrument, and the implementation process of the health monitoring and diagnosis system. The test results show that the reported health monitoring and diagnosis system for heavy roll grinding machine is effective and abnormal status identification is achieved.
Keywords
Introduction
As the development of performance and process quality of large-scale mechanical equipment, health monitoring becomes an important issue.1–5 Heavy roll grinding machine is particularly a large-scale mechanical equipment and a typical complex electromechanical integration equipment.6,7 In the grinding process, the rotation accuracy and stability of the spindle rotation system consisted of headstock, workpiece, and tailstock and has a huge impact on the quality of the machined workpieces and production efficiency. So, health monitoring and fault diagnosis could improve the performance of the heavy roll grinding machine significantly. 8 YH Ali et al. 9 present a survey based on a literature review using acoustic emission signal analysis and artificial intelligence techniques in machine condition monitoring and fault diagnosis. However, the use of acoustic emission signal analysis and artificial intelligence techniques for machine condition monitoring and fault diagnosis is still rare. Vibrations onset represents a paramount issue in all grinding processes, so using vibration measurements is better choice that receives much attention recently. P Parenti et al. 10 developed an online waviness identification scheme for cylindrical traverse grinding from acceleration measurements. Q Fan et al. 11 proposed an intelligent diagnosis method for gear damage using multiple classifiers of support vector machines with extracted failure feature vector in which the vibration accelerations of gear box are measured as original data. JW Fan et al. 12 adopted small sample technology which needs less data while getting higher evaluation accuracy; using the theory of Bayes theorem and failure rate as random variables, the experiment data of tracking computer numerical control (CNC) grinding machine for a year are analyzed. X Dong and W Zhang 13 proposed a degradation analysis method based on the complexity to monitor the degradation statuses of the spindle systems of machine tool during use. X Wang et al. 14 built a semi-supervised learning model for fault detection and classification for a complex process. İ Asiltürk et al. 15 developed an adaptive network–based fuzzy inference system (ANFIS) for surface roughness and vibration prediction in cylindrical grinding. However, all the above methods require enough normal and failure data which are almost impossible for heavy roll grinding machines. Lack of normal and fault samples becomes an important issue for health monitoring and diagnosis of such expensive and heavy equipment. A detection method based on one-class learning is proposed in this article using single class of normal samples and gradually establish a complete diagnosis system with the data obtained in the process.
A novel health monitoring and diagnosis system for heavy roll grinding machine is developed and reported in this article. Section “Overall design” introduces the overall design of health monitoring and diagnosis system. Section “Vibration sensor placement and field monitoring system design” introduces the placement of the vibration sensors, system configuration of the monitoring and diagnostic instrument, and the implementation process of the health monitoring and diagnosis system. Section “Health monitoring and diagnosis system design” gives the application tests of the health monitoring and diagnosis system. Section “Test results” comes to the conclusion.
Overall design
A heavy roll grinding machine consisted of the support system, the servo control, grinding system, measuring equipment, and some auxiliary devices. Its mechanical part contains headstock, tailstock, grinding carriage, principal axis, feeding mechanism, and dragging plates. The status information of major components is acquired as shown in Figure 1.

Status monitoring of major components.
The vibration monitoring of the grinding carriage is carried out using dynamic balancing apparatus. The eddy current sensor between the headstock and the guide rail is used to measure the relative deformation under heavy load condition. Several vibration sensors are fixed on the headstock and tailstock to monitor the vibration status of the headstock and the tailstock.
The architecture of the health monitoring and diagnosis system is shown in Figure 2. The whole system consisted of field monitoring system, remote service system, and collaborative management system. The field monitoring system consisted of sensors and monitoring and diagnosis instruments. Preliminary analysis and diagnosis could be done with the field monitoring system, while further analysis and diagnosis should be done using the remote service system. Equipment status database and fault knowledge database are constructed by the remote server using the data acquired by field monitoring system. Advanced function is implemented including fault diagnosis, feature extraction, and performance evaluation. Meanwhile, remote service system is the bridge between the field monitoring system and collaborative management system, completing collaborative diagnosis and maintaining for the equipments, and send the guide instructions to the field monitoring system. The collaborative management system is a multi-user distributed sharing platform, providing information services for the manufacturers, managers, maintainers, and experts.

Architecture of the health monitoring and diagnosis system.
Vibration sensor placement and field monitoring system design
Vibration sensor placement has a significant impact on the monitoring performance. Many factors are important for the sensor configuration, including sensing sensitivity and sensor quantity. As three ultraprecise rolling bearings fixed on the headstock and tailstock are very important for machining accuracy, five vibration sensors are fixed against the ultraprecise rolling bearings to measure the headstock status as shown in Figure 3. The type of the vibration sensor is BW sensor 14115. The frequency range is 0.5–10,000 Hz. The resolution is 0.0001 m/s2.
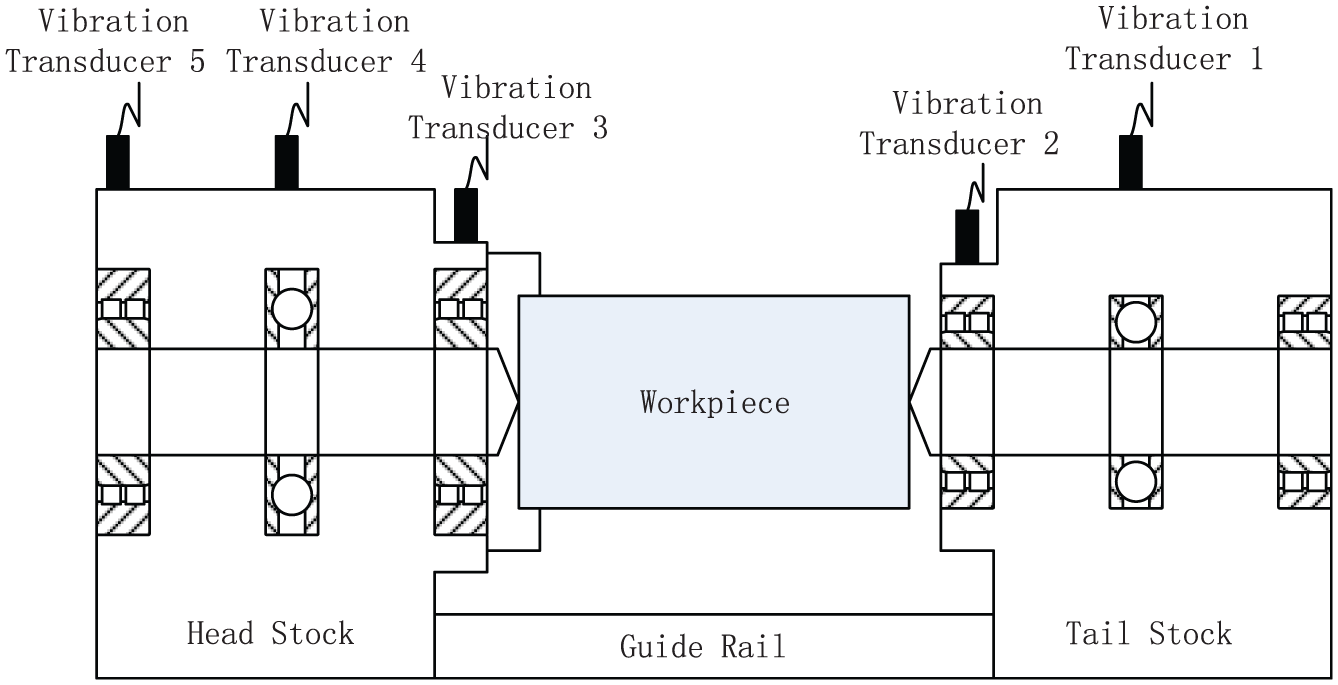
Vibration sensor configuration for heavy roll grinding machine.
A special field monitoring system is developed for synchronous real-time vibration signal using embedded industrial motherboard and 16-bit 250 kHz PC 104 synchronous analog acquisition card with two-level subsystem: one for acquisition processing and one for information display. The data acquisition frequency is 8 kHz. The system configuration of the field monitoring system is shown in Figure 4. The information display subsystem is called display terminal subsystem, and the acquisition processing subsystem is called sensing system. The display terminal subsystem uses Ethernet for data transportation. Display terminal system contains some simple signal pretreatment functions and intelligent diagnosis algorithms. The sensing system is shown in Figure 5.

System configuration of the field monitoring system.

Sensing system of the monitoring and diagnosis instrument.
Health monitoring and diagnosis system design
Generally, heavy roll grinding machine lacks performance data. So, evolutionary learning ability is essential for the health monitoring and diagnosis system. In order to ensure the ability to detect a new fault status and to improve the classification accuracy, one-class learning abnormality detector is employed as shown in Figure 6. This abnormality detector is responsible for the detection of new fault category. When a new fault category is detected, the data sample would be trained and updated for the abnormality detector carrying out the supervised classifier. And the new detected fault class can be accepted into the integrated diagnosis system, while evolutionary learning is achieved. The whole ensemble diagnosis system is shown in Figure 7.

One-class learning abnormality detector.

Block diagram of the ensemble diagnosis system.
As the data samples would increase as time passed, online evolutionary learning algorithm is required. To solve this problem, a new support vector machine-based evolutionary learning algorithm is designed. The employed objective function based on support vector is shown as follows
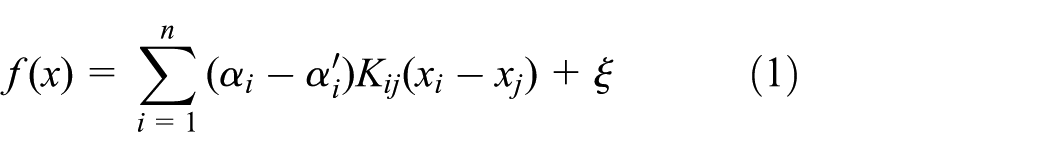
Here,
Suppose the boundary function of the ith sample is shown as follows

Suppose coefficient


Suppose
Suppose the sample set on the boundary is

If
When a new sample is added in the training sample set, if the sample is not a support vector, no correction is needed. If the new sample is a support vector, incremental algorithm is employed to adjust the coefficients until the constraint condition is satisfied.
When an old sample is excluded from the training sample set, if the sample is not a support vector old, no correction is needed. If the old sample is a support vector, the corresponding coefficient is not zero, incremental algorithm is employed to adjust the coefficients to zero gradually.
The diagnosis strategy and implementation process of the health monitoring and diagnosis system is shown in Figure 8. Field monitoring system and remote server is combined together for cooperative diagnosis.

Implementation process of the health monitoring and diagnosis system.
Test results
Real-time experiments were done for a heavy roll grinding machine under free-load condition. The spindle speed is 5 r/min. The sampling frequency is 8 kHz. The maximum amplitude of the fundamental frequency components of the five sensors signal is 23.93 Hz. The tests results are shown in Figures 9–11. Figure 9 shows the five time-domain features for raw signals: kurtosis, form factor, pulse factor, peak factor, and skewness. The first 4 features are different between a normal status and an abnormal status. Figure 10 shows the results of the normal condition detector. While abnormal signal occurs, the abnormal value is bigger than threshold 1. That means abnormal status is detected. Figure 11 shows the results of the abnormality detector. While the normal signal occurs, the abnormal value is bigger than threshold 1. That means it is different from the corresponding classifier. While abnormal signal occurs, the abnormal value is smaller than threshold 2. That means an abnormal status is classified and identified. Here, threshold 2 is selected bigger than the biggest value of the normal signal. In Figures 10 and 11, 0.2 is used. Threshold 1 is two times that of threshold 2. For a different operation condition, a new threshold 2 should be identified using the sampled normal data. After the abnormal status is recognized, machine maintenance test is done. The tailstock base has caved in, resulting in relative sliding spindle during rotation of the workpiece. After the adjustment of the tailstock, no abnormal status could be detected.

Five time-domain features for raw signals.
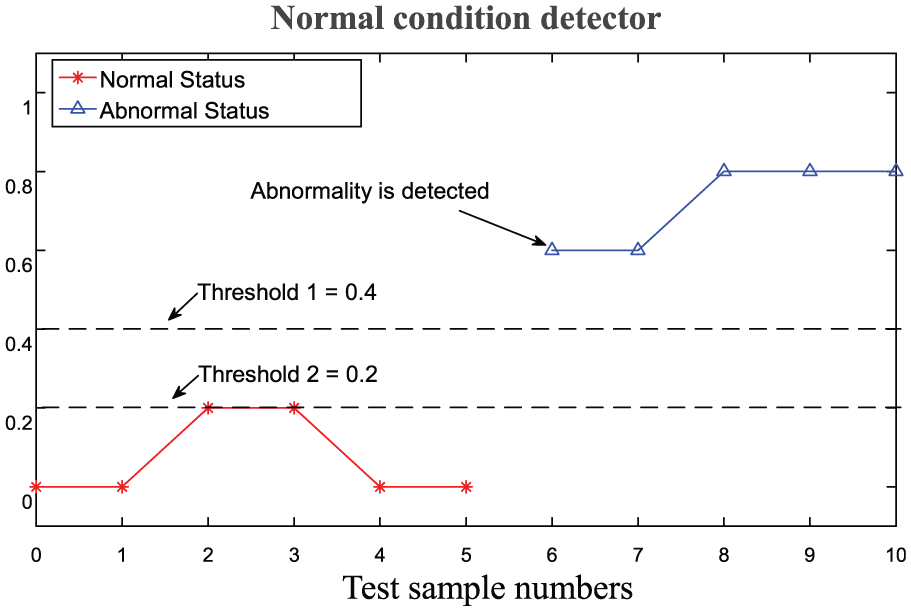
Normal condition detector results.

Abnormality detector results.
Conclusion
Overall, design of the health monitoring and diagnosis system for heavy roll grinding machine is discussed in detail. System configuration of the monitoring and diagnostic instrument and the implementation process of the health monitoring and diagnosis system are given with a new support vector machine-based health monitoring and diagnosis algorithm. This health monitoring and diagnosis system is also applicable for other large-scale mechanical equipments.
Footnotes
Academic Editor: Elsa de Sa Caetano
Declaration of conflicting interests
The author(s) declared no potential conflicts of interest with respect to the research, authorship, and/or publication of this article.
Funding
The author(s) disclosed receipt of the following financial support for the research, authorship, and/or publication of this article: This paper is sponsored by program of National Natural Science Foundation of China (Nos 51375293 and 61503232), key program for Basic Research of the Science and Technology Commission of Shanghai Municipality (No. 12JC1404100), and “Chen Guang” project supported by Shanghai Municipal Education Commission and Shanghai Education Development Foundation (No. 15CG44).