
Abstract
The change of optic disc can be used to diagnose many eye diseases, such as glaucoma, diabetic retinopathy and macular degeneration. Moreover, retinal blood vessel pattern is unique for human beings even for identical twins. It is a highly stable pattern in biometric identification. Since optic disc is the beginning of the optic nerve and main blood vessels in retina, it can be used as a reference point of identification. Therefore, optic disc segmentation is an important technique for developing a human identity recognition system and eye disease diagnostic system. This article hence presents an optic disc segmentation method to extract the optic disc from a retina image. The experimental results show that the optic disc segmentation method can give impressive results in segmenting the optic disc from a retina image.
Keywords
Introduction
The retina lies on the inner surface of eye, and the inner retina layer is a light-sensitive thin membrane lining in the inner surface of the vascular membrane. The retina is similar to photographic film, being light-sensitive and forming images. The fundus is the back of retina. Optic disc (also called optic nerve head), a bright and round elevated mass, is at the beginning of the optic nerves, as shown in Figure 1. The area of the optic disc in a normal eyeball is approximately 1.6 mm2; however, it lies within a wide range of 0.68–4.42 mm2. The optic disc is composed of ganglion cell nerve fibres and is the brightest area in a retina image. Approximately 10,000–12,000 nerve fibre ganglion cells or axons leave or enter the eyeball through the optic disc, forming the optic nerve in this area, at which the starting points of the blood vessels of retina are located. Without photoreceptor cells, the retina cannot receive and sense light.

Example of retina image.
Since the optic disc is the region from which the main blood vessels exit, many eye diseases can be identified based on the shape of optic disc. For example, glaucoma is a degenerative nerve disease that involves constant increasing pressure in eye. The healthy normal optic nerve has rim appearance, while optic disc cupping is the characteristic of glaucoma; consequently, haemorrhage may occur around the optic disc. Whether the field of view is affected can also be used to diagnose glaucoma. Swelling of optic disc or oedema occurs because flowing nutrients pass through damaged axons, which possibly results from increased intracranial pressure. Swelling of optic disc can be a symptom of brain tumour, optic neuritis or minor nerve stroke. The World Health Organization reported that glaucoma was the second leading cause of blindness worldwide. Among the 65 million glaucoma patients worldwide, 7 million have become blind because of this disease. In Taiwan, approximately 100,000 people have been diagnosed with glaucoma. Without early diagnosis and treatment, glaucoma may cause the death of optic nerve fibres and blindness. At the initial onset of glaucoma, most patients do not perceive any symptoms; however, when they perceive that their eyesight is deteriorating substantially, treatment is often futile.
Diabetic retinopathy is a severe cause of blindness in middle-aged and elderly people. According to the Wisconsin Epidemiologic Study of Diabetic Retinopathy, the percentages of patients suffering from type 1 diabetes for 3, 5, 10 and 15 years to have diabetic retinopathy were 8%, 25%, 60% and 80%, respectively. The majority of patients suffering from type 1 diabetes for 20 years or more developed diabetic retinopathy. Approximately 21% of patients with early-stage type 2 diabetes and 60% of patients over 20 years after of diagnosis suffered from diabetic retinopathy.1,2
Approximately 5.5% of global population has been diagnosed with diabetes. Among these patients, approximately 10% have diabetic retinopathy, 3 which is the main cause of blindness in adults (aged 20–65 years). 4
A study from National University of Singapore indicated that when retinopathy occurs in the blood vessels of retina, the stroke rate increases. If the retina of hypertension patients demonstrates severe retinopathy, the stroke rate increases by 37%. Thus, observation of the variations in the retina can provide a reference for identifying stroke. Moreover, because of the development of computer and Internet technologies, as well as prevalent electronic transactions, Internet security and identity recognition are increasingly emphasized. As a result, relevant biometric features can be used to improve it. Bill Gates, the founder of Microsoft, stated that biometric technologies will be one of the most vital information technology innovations in the 21st century. Recent studies have indicated that the distribution structures of human retinal blood vessels differ, enabling the retina to be used in biometric recognition. Retina scanning is conducted based on the unique individual distribution of retinal. Such distribution cannot be reproduced easily and remains unchanged throughout life. Moreover, retina scanning meets four requirements for biometric recognition, namely, universality, uniqueness, permanence and measurability, and is one of the most accurate biometric technologies.
To analyse the features of retina, the location of optic disc must be first identified because the optic disc is the origin of all blood vessels in the retina. The area, depth and shape of optic disc nerves can be used as a crucial reference for determining whether the fundus is healthy.
However, locating and segmenting the optic disc involves difficulties because of individual factors, such as blood vessel distribution, protein secretion, image pollution, ocular fundus disease, vascular occlusion and blurred image edges.
Kass et al. 5 proposed an active contour model (ACM), also referred to as snakes, for examining the edge of an object. An active contour refers to a predefined enclosed contour that is affected by the external energy of an image and the internal energy of the contour itself. The contour then actively changes its shape by the traction of the internal and external energy and is entangled like a snake to the edge of objects, which is why the ACM is also called snakes. For this method, an initial contour is required. This method relies considerably on the initial contour, which must be extremely close to the true contour of the object. Different initial contours may lead to different outcomes.
Chen et al. 6 proposed a statistics-based method to draw the optic disc contour in a retina image. This method draws the initial optic disc contour on the basis of the contrast and texture of the image. Based on the drawn initial contour, it precisely segments the optic disc further by using the ACM. However, this method is susceptible to retinopathy or eye excretion.
In this article, an optic disc segmentation (ODS) method is proposed. The ODS method first enhances the contrast inside retina, segments the optic disc and then repeatedly pans and zooms the contour of the segmented optic disc to optimal case. The ODS method is indifferent to indistinct object contour which is caused by excretion around the optic disc.
Related works
This section will briefly review some techniques which will be used in this article.
Otsu’s thresholding method
Image segmentation is a critical step in image processing. Numerous image segmentation technologies have been developed based on Otsu’s thresholding method, which is a nonparametric, unsupervised method for acquiring the optimal threshold. The threshold selected by Otsu’s thresholding method has the characteristics of maximum variance among different categories and minimum variance within the same category. 7
Otsu’s thresholding method tries every possible threshold. A given threshold t divides the pixels in an image into two classes C1 and C2 according to their grey levels, one consisting of the pixels with grey levels less than t and the other containing the pixels with grey levels greater than or equal to t. Let n1 and n2 be the numbers of pixels in C1 and C2. Also, let σ1 and σ2 be the standard deviations of the grey levels in C1 and C2. The ideal threshold t* obtained by Otsu’s thresholding method is as follows

where maxl and minl are the maximal and minimal grey levels of the pixels in the image, respectively. The purpose of Otsu’s thresholding method is to determine the t* that minimizes the total variances within classes.
Mathematical morphology
This subsection details the morphology used to process and analyse the regional shape in the image.
8
Two basic operations in morphology are erosion and dilation. Erosion refers to removing pixels from the target boundaries in the image to shrink or refine white objects further in a binary image. Given an image I and a structural element S, I ⊆ Z2 and S ⊆ Z2. For eroding the objects in I by S, the formula can be expressed as

A binary image contains only white and black pixels. The outcome of dilation process increases the number of white pixels corresponding to the image area. The dilation fills the gaps in the image, indicating a process of dilating the white object boundary outward. For dilating the white object in I by S, the formula can be expressed as

Hough transform
In 1962, Hough 9 proposed Hough transform technique, which can detect circle contours in images. The principle involves using a voting process to detect the circle contour through accumulation. 10
A circle can be described by three parameters: the coordinates of the centre of the circle (a, b) and radius r: (x−a)2 + (y−b)2 = r2 if (x, y) is any point on the circle and the radius r accumulates from 1, then the parameters can be reduced to two dimensions. We can obtain (x−a)2 + (y−b)2 = r2, and map all (a, b) that satisfy the equation to the a−b plane. The overlapped point represents the coordinates of the centre of circle. Consequently, the circle contour can be detected in the parametric space through accumulation.
Statistics-based method
In 2013, Chen et al. 6 provided a statistics-based method to locate a rectangular region which contains the optic disc in a retinal fundus image. The method selects the region of interest (ROI) using the statistical features – the mean, standard deviation and skewness of the pixels’ grey levels in the candidate regions. Then, the maximal inscribed circle of the selected ROI is used as the initial contour of the optic disc, and an ACM is employed to precisely segment the optic disc further based on the initial contour. In this study, its performance will be compared with that of the ODS method in experiments.
The ODS method
In this article, an ODS method is proposed to segment the optic disc region from a retina image. The ODS method contains three stages – preprocessing; initial optic disc contour detection; and optic disc contour fine tuning. The preprocessing stage is to remove the background and texts, and then to segment the retina area from the original image. The initial optic disc contour detection stage is to roughly extract the optic disc from the retina area. The optic disc fine-tuning stage is to fine tune the extracted initial optic disc contour so that the detected optic disc contour is closer to the true optic disc contour. These three stages will be described in detail in the following sections.
Preprocessing
A retina image may include retina, background and texts. Because the optic disc exists only inside retina area, the ODS method first removes the background and texts, and retains only the retina area. In a retina image, the optic disc region is typically brightest within the retina area which is considerably brighter than the image background. Thus, the ODS method converts each image I0 of the red–green–blue (RGB) colour mode into a grey-level image

where

Colour retina image.

Grey-level retina image.
Because the image background is comparatively darker than the retina area, the ODS method adopts Otsu’s thresholding method to determine a threshold
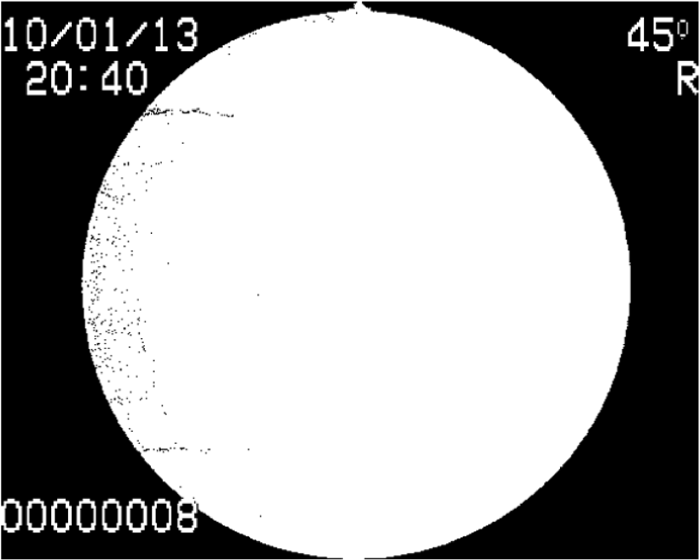
Binarized image.
Figure 4 shows that substantial text possibly exists in

Given structured element.

The resulting image after three erosions.

Resulting image after three dilations.
In the retina area of the image illustrated in Figure 7, some black spots still exist. Thus, the ODS method adopts an additional dilation operation on

Segmented retina area.
Initial optic disc contour detection
The optic disc is typically a brighter location in the retina area. Thus, the ODS method stretches the grey levels within the retina area. If
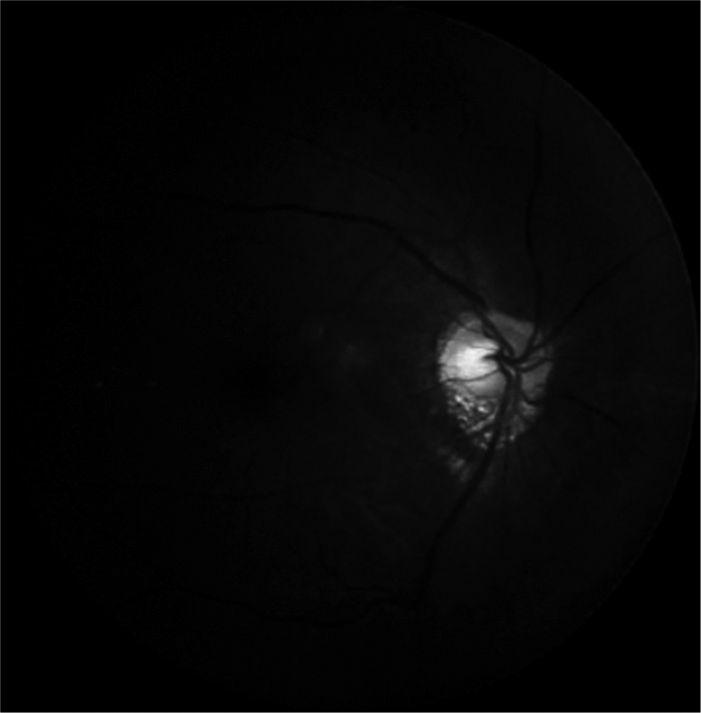
Image after running contrast enhancement.

Resulting binary image of Figure 9.
Blood vessels that spread throughout the entire retina are often observed around the optic disc in the retina. The retina of patients with eye diseases may exhibit blood vessels that fail to transport blood normally, thereby resulting in the phenomena such as cell death and protein or fat spillover. All of these phenomena possibly generate an unidentified bright region in the retina, probably causing the segmented retina to be displayed in pieces or noncircular shapes. Thus, the Hough transform method is applied in the ODS method to determine a circular contour as the optic disc contour in
Certain eye diseases may cause protein excretion in eye, and image quality may be deteriorated because of human or instrumental factors during photographing. These situations create numerous white areas or speckles on the image. The arrows in Figure 11 indicate these speckles which possibly affect the segmentation result of optic disc.
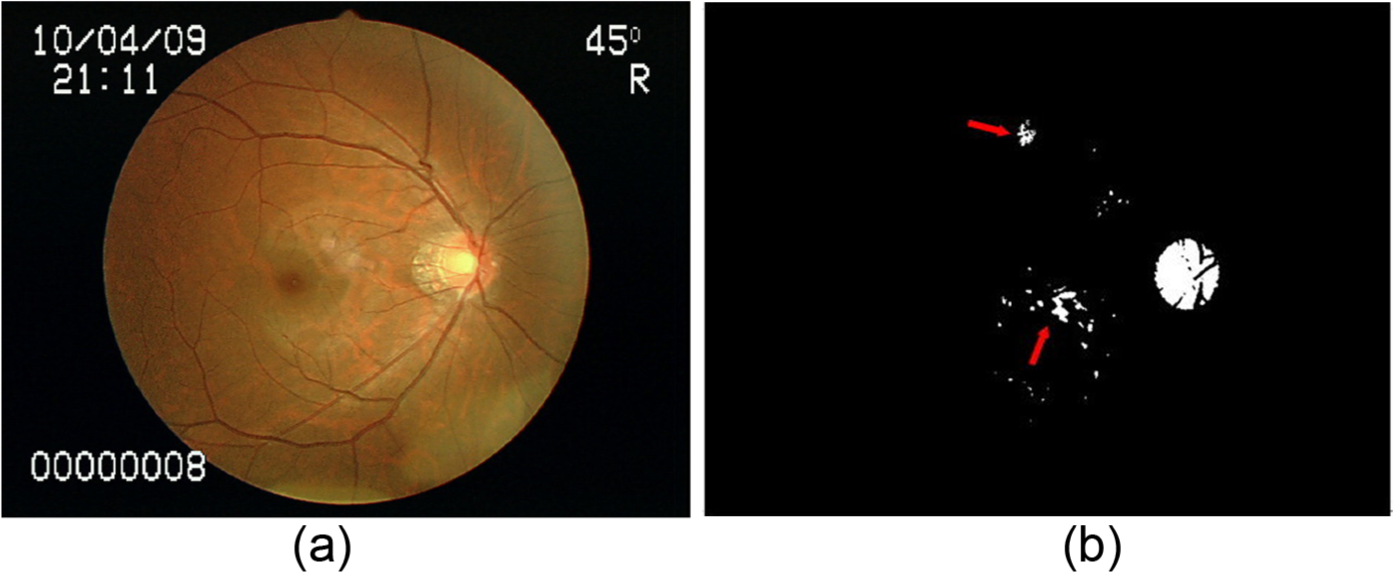
Bad-quality image: (a) original image and (b) binarized image.
Thus, the ODS method removes the white blocks with an area smaller than a given threshold TA from

Object in Ib after removing noise: (a)
Extracted initial optic disc contour.
Optic disc contour fine tuning
The extracted initial optic disc contour C0 can briefly describes the size and position of the optic disc. After detecting C0, the approximate centre Ic(x, y) and radius r of the optic disc can be determined. The ODS method then repeatedly uses two operations panning and zooming to draw the optic disc contour closer to the true optic disc contour.
The panning operation checks each circle Cij, where Ig(x+i, y+j) and r are the centre and radius of Cij, respectively, for −1 ≦ i, j ≦ 1. Cij divides the retinal area in Ig into two regions
After that, the ODS method repeatedly runs the zooming operation. The zooming operation creates two new circles C1 and C−1, where the centres of both C1 and C−1 are located at (x, y), the radius r1 of C1 is r+1, and the radius r−1 of C−1 is r−1. Ci partitions the retinal area in Ig into two regions

Extracted optic disc: (a) results obtained by panning and zooming operations and (b) extracted optic disc contour.
Experimental results and discussions
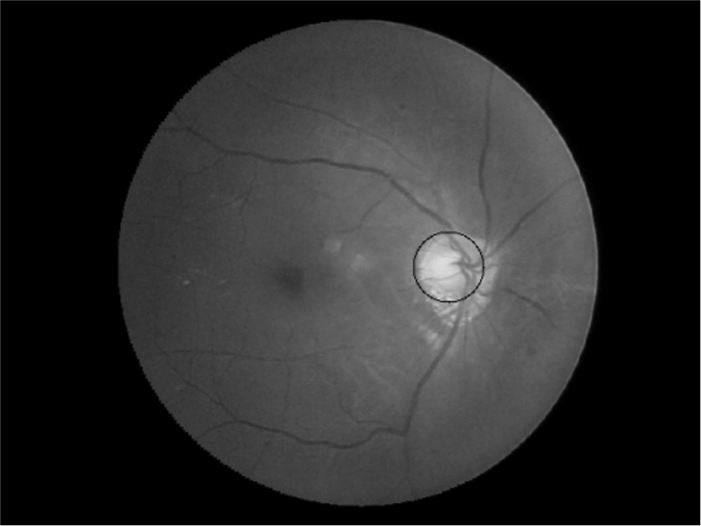
This section investigates the performances of the ODS method by experiments. In these experiments, 36 retina images, each consisting of 640 × 480 pixels, are used as the test data. Figure 15 shows some of the test images and the segmented results obtained by the ODS method and the statistics-based method proposed by Chen et al. 6 The black circles represent the segmentation results obtained by the ODS method, the red circles indicate the optic disc region drawn by ophthalmologists and the green closed curves are the optic disc contours provided by the statistics-based method. Obviously, the images in Figure 15(a)–(f) demonstrate that the segmentation results obtained by the ODS method are very close to those drawn by the ophthalmologists. Even the boundaries of some optic discs are very indistinct so that it cannot be identified by the naked eye, the ODS method still can provide satisfactory segmentation results. However, the ODS method cannot provide favourable segmentation results for Figure 15(g)–(k) because the boundaries of their optic disc are extremely blurred. Therefore, the ODS method cannot provide favourable segmentation results for the images with extremely blurred optic disc boundaries. Mostly, the statistics-based method gives worse performance since the statistics-based method used ACM method to draw the final optic disc contours, but the ACM method is very sensitive to the vessel in optic disc region. The experimental results also demonstrate that the statistics-based method is susceptible to indistinct optic disc contours.
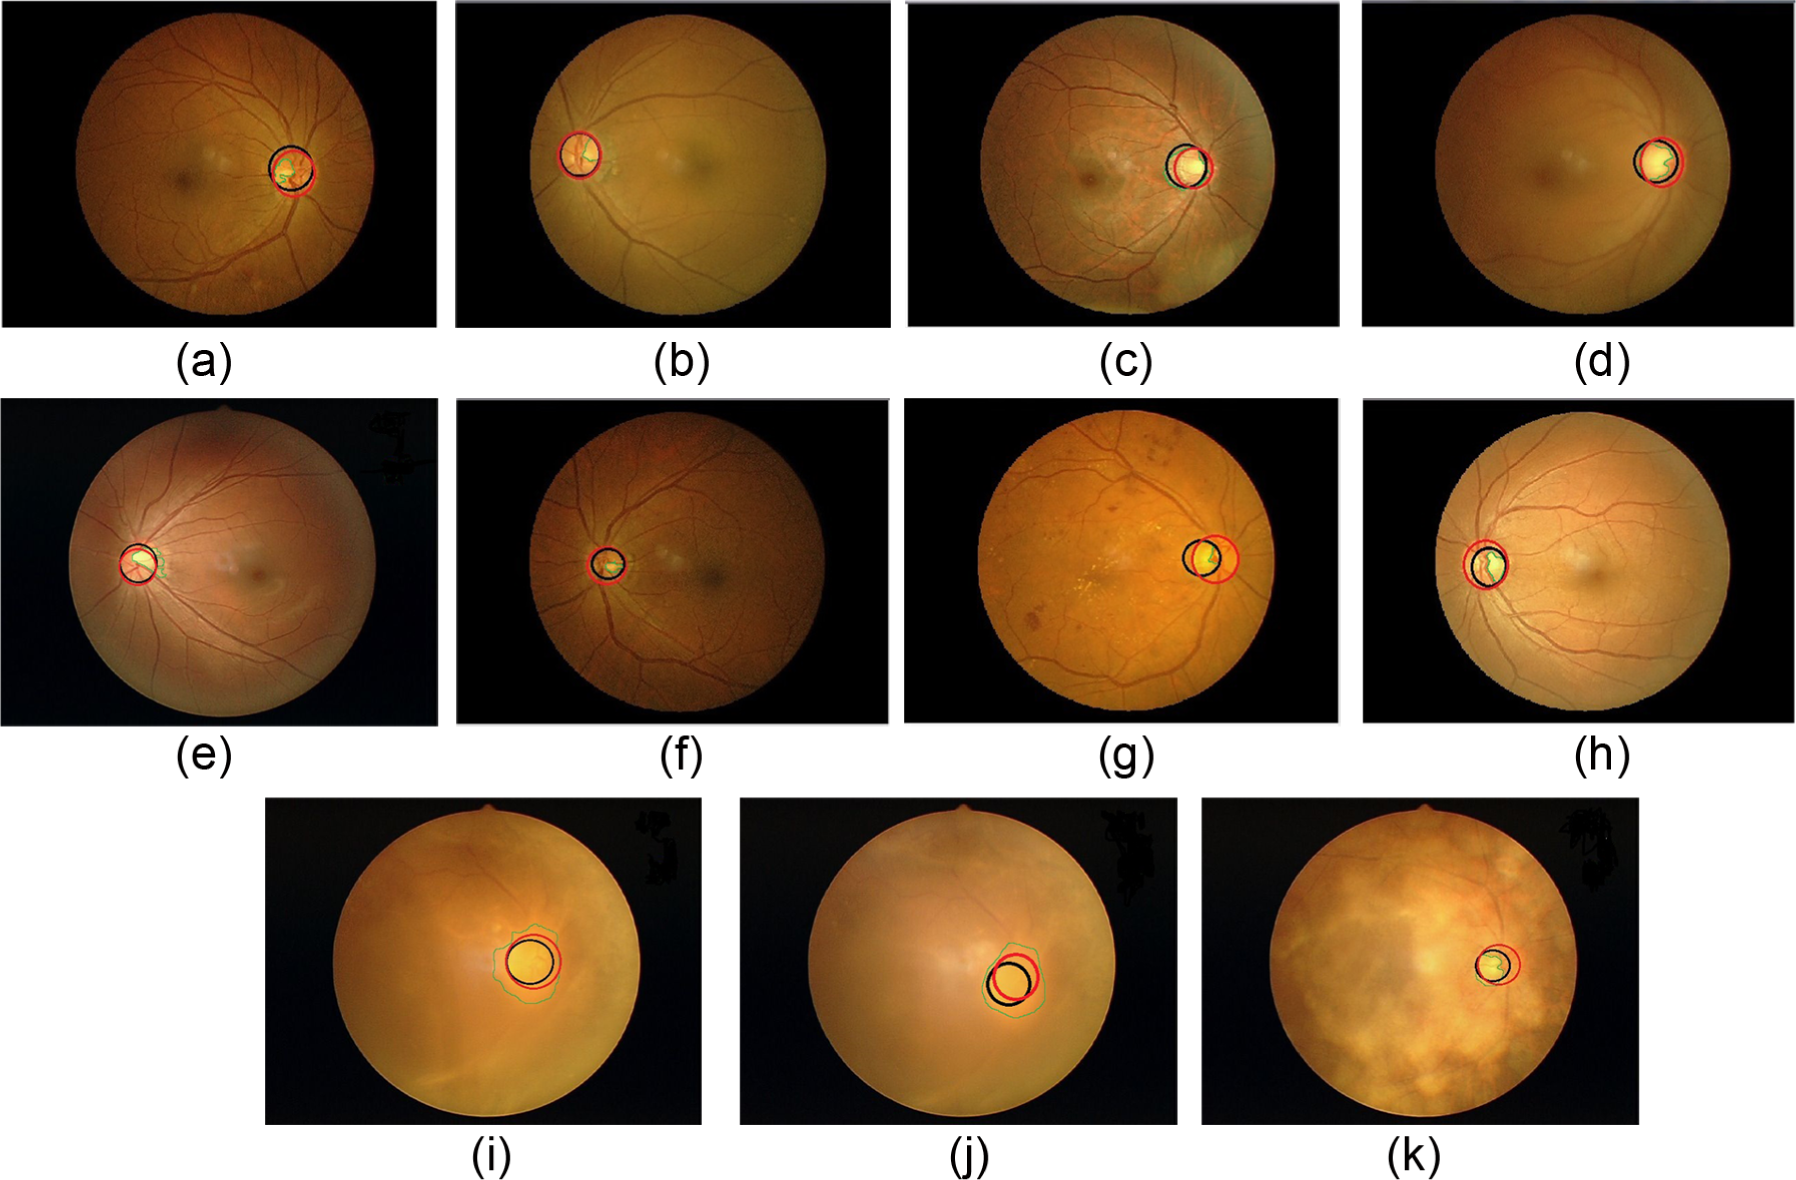
Some of the test images and the segmented results: (a)–(f) are the samples given good segmentation results and (g)–(k) are the samples given bad segmentation results.
Figures 16 and 17 sketch the segmentation results where the diamonds indicate the results given by the ODS method, and the triangles signify the results obtained by the statistics-based method. Figure 16 presents the differences of the radii of the optic discs extracted by the ODS method and those depicted by ophthalmologists, and the differences of the radii of the optic discs extracted by the statistics-based method and those depicted by ophthalmologists. Most of the differences obtained by the ODS method are within 30 pixels. Figure 17 presents the distances of the centres of optic discs extracted by the ODS method and those depicted by ophthalmologists, and the distances of the centres of optic discs extracted by the statistics-based method and those depicted by ophthalmologists. The distances are less than 30 pixels. Table 1 indicates that the average difference of the radii of the optic discs obtained by the ODS method and ophthalmologists is 15.16 pixels, and the average difference of the radii of the optic discs obtained by the statistics-based method and ophthalmologists is 20.86 pixels. Table 1 also shows that the average distance between the centres of optic disc contours obtained by the ODS method and ophthalmologists is 17.78 pixels, and the average distance between the centres of optic disc contours obtained by the statistics-based method and ophthalmologists is 23.77 pixels.

Differences between the radii of the extracted optic discs and those depicted by ophthalmologists.

Distances of the centres of the extracted optic discs and those depicted by ophthalmologists.
Experimental results obtained by the ODS method.

ODS: optic disc segmentation.
Conclusion
That the optic disc may be split into fragments by vessels, some eye diseases may cause protein excretion in the eye which may create numerous white regions or speckles on the retinal, and the optic disc contour may be very indistinct, will increase the segmentation difficulty of optic disc. In this article, the ODS method is proposed to segment the optic disc from a retina image. The ODS method initially segments the optic disc from the retina image, and then adopts panning and zooming operations to correct the location and size of the optic disc precisely. The experimental results reveal that the location and size of the optic disc segmented by the ODS method are extremely close to those identified by professional ophthalmologists.
Footnotes
Academic Editor: Stephen D Prior
Declaration of conflicting interests
The author(s) declared no potential conflicts of interest with respect to the research, authorship and/or publication of this article.
Funding
The author(s) received no financial support for the research, authorship and/or publication of this article.