
Abstract
Since the symptoms of the diabetic retinopathy, macular degeneration, and many other eye diseases are often associated with the bright spots, dark spots, and vascular abnormalities in retinal images, this study proposes a retinopathy image segmentation (system) to extract the bright spots, dark spots, and blood vessels from retinal images. Moreover, since a high proportion of diabetic patients suffer from the diabetic retinopathy with the most severe one to be the retinal detachment, the retinal image-based tractional retinal detachment diagnosis system is proposed, as well. Two genetic-based parameter detectors are given to provide the most appropriate values for the parameters used by the retinopathy image segmentation system and the tractional retinal detachment diagnosis system. The experimental results illustrate that the retinopathy image segmentation system and the tractional retinal detachment diagnosis system can provide expressive results in segmenting bright spots, dark spots, blood vessels, and in diagnosing tractional retinal detachment. Both systems are helpful for the ophthalmologists in diagnosing eye diseases.
Introduction
The World Health Organization (WHO) 1 reported in 2004 that approximately 285 million people worldwide are visually impaired, 39 million of whom are blind and 246 million have low vision. Therefore, vision problems have become a crucial health concern worldwide. The WHO also reported that diabetic retinopathy and age-related macular degeneration are critical diseases resulting in vision loss. 2
Many eye diseases are chronic conditions such as macular degeneration, glaucoma, and diabetic retinopathy; however, the patients are frequently unaware of their chronic eye diseases although they have already lost some vision. Early diagnosis of the abnormalities can decrease the probability of visual loss. For example, a high proportion of diabetic patients develop retinopathy, which may cause visual impairment or blindness, substantially influencing patients’ quality of life. Therefore, if diabetic patients with retinopathy can be diagnosed at an early stage, the risk of blindness can be reduced.
Because endocrinologists who treat diabetes possess less knowledge of eye diseases than ophthalmologists, consultations for diabetic patients with ophthalmologists are typically arranged through hospital referrals or document deliveries. However, this process is time-consuming and expensive because of complex procedures and human factors, which may delay treatment and exacerbate the disease.
Ophthalmologists typically interpret retinal images; however, image interpretation may contain errors caused by human influence, resulting from dissimilarities in the diagnosis experience of ophthalmologists. Moreover, the prevalence of retinopathy increases year by year, increasing the number of patients who receive fundus photography. Ophthalmologists require a large amount of time to interpret the vast amount of retinal image data, causing workload increase.
Therefore, it is necessary to develop an image interpretation system to automatically recognize the symptoms of retinopathy. When the retinal abnormality of a patient is detected, the patient must receive treatment to control disease progression to reduce the incidence of blindness. Thus, establishing an automatic interpretation system for symptom recognition is important.
In a retinopathy image, the white or bright yellow area signifies the following symptoms:
Hard exudates, which are composed of the deposition of protein and lipid materials, marked by the arrow in Figure 1(a).
Cotton wool spots, which are gray or bright spots similar to cotton wool or fluff with irregular shapes and unclear boundaries, denoted by arrow 1 in Figure 1(b).
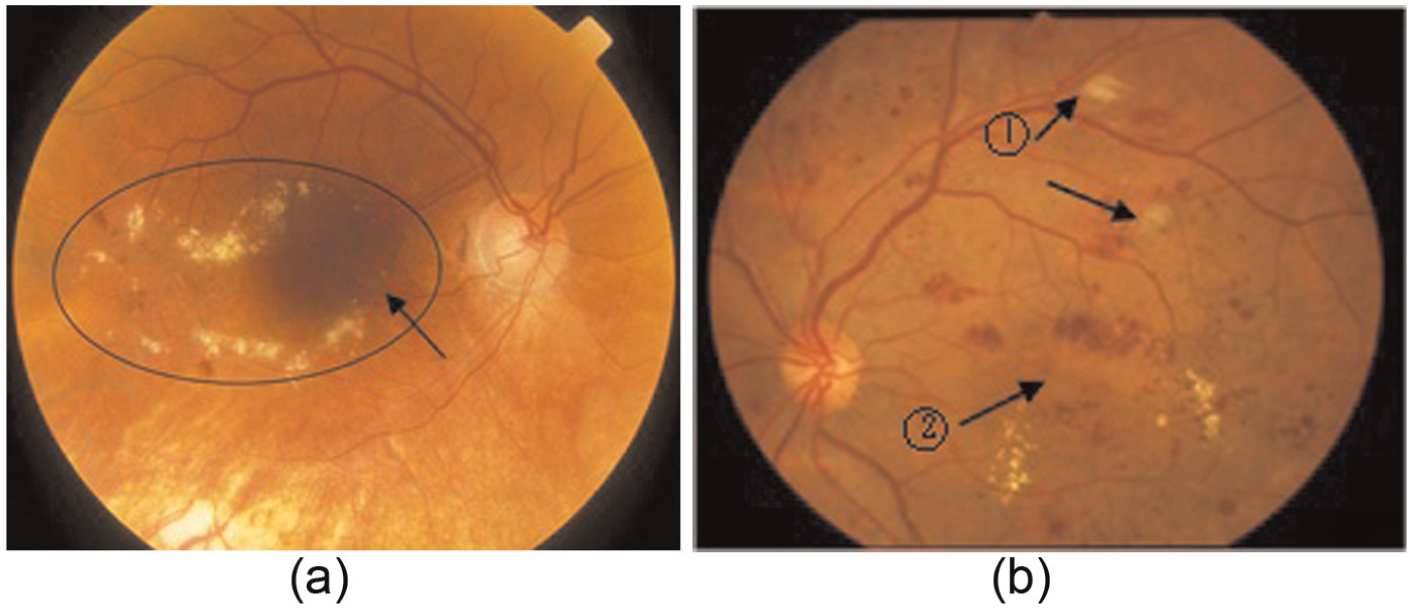
Symptoms of retinopathy: (a) hard exudates, (b) cotton wool spots and capillary hemangioma.
In addition, the dark red areas indicate the following symptoms:
Capillary hemangiomata, appearing as tiny bumps with colors ranging from red to purple.
Hemorrhages, expressed as small petechiae with circular or irregular shapes, denoted by arrow 2 in Figure 1(b).
Microvascular abnormalities or hyperplasia: microvessels are distorted or exhibit uneven thickness (Figure 2).
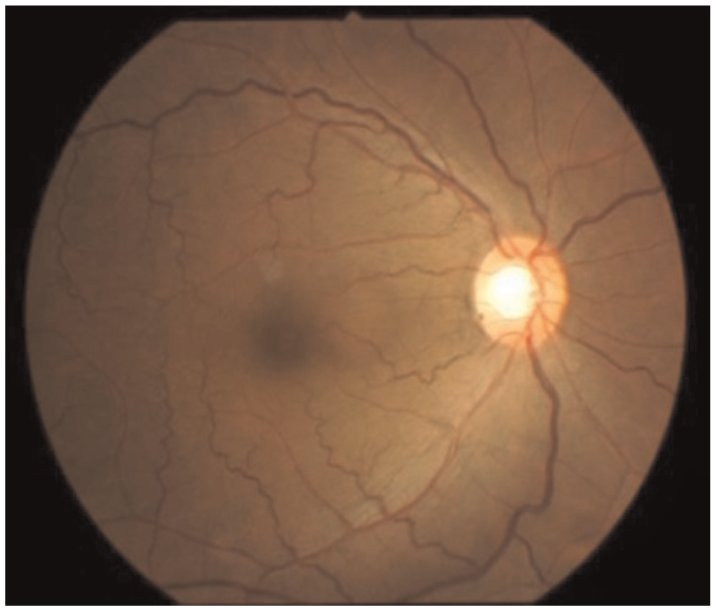
Microvascular abnormalities or hyperplasia.
Tractional retinal detachment occurs when scar tissue on the retina’s surface contracts and causes the retina to pull away from the retinal pigment epithelium. Diabetes can lead to issues with the retinal vascular system and cause scar tissue in the eye that could cause detachment. Tractional retinal detachment may cause blindness in serious cases (Figure 3).

Tractional retinal detachment.
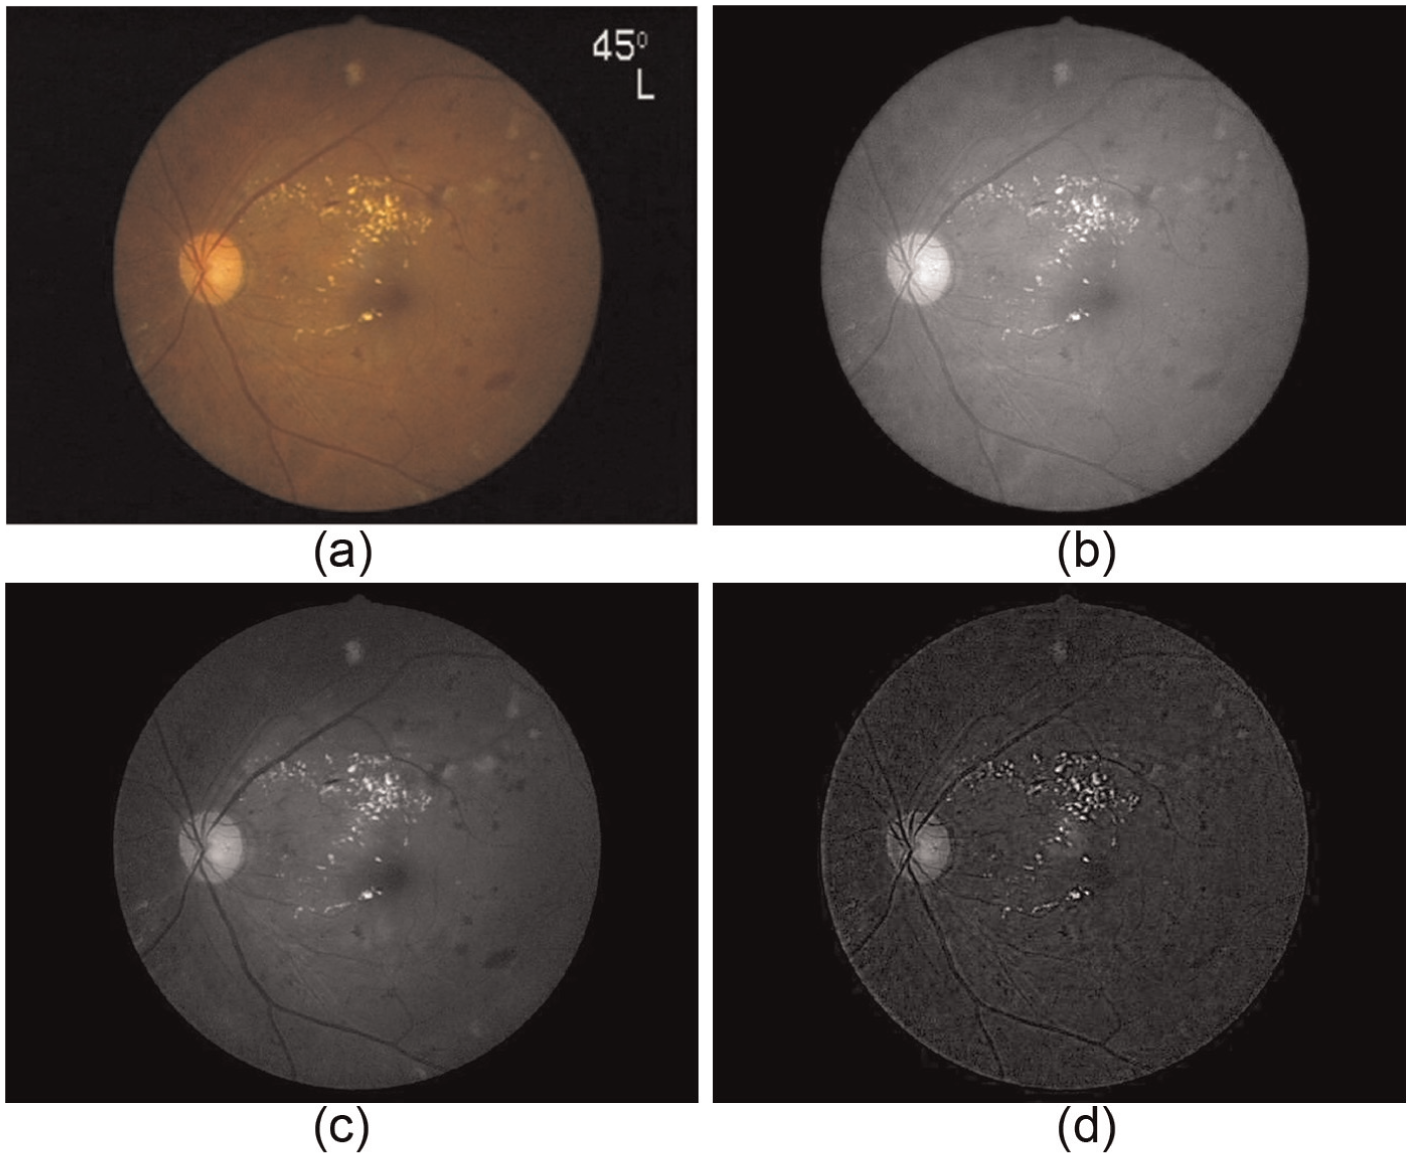
However, the retinal images obtained from fundus photography frequently exhibit uneven brightness, as shown in Figure 4(a). The area denoted by the arrow exhibits noise interference, which may influence the diagnosis process and results. Additionally, images may be overly blurry and fail to provide a clear symptom boundary. Therefore, the areas denoting specific symptoms in an image cannot be accurately segmented for further recognition (Figure 4(b)). When an image is captured, lighting can be adjusted to produce images with varying brightness; thus, retinal images even for the same symptom and the same patient may differ in color and brightness. For example, part of the image in Figure 4(c) is brighter than optic disk and part of the image in Figure 4(d) is very dark. Therefore, segmenting the optic disk from a retinopathy image is difficult.

Retinal images: (a) brightness of image is uneven, (b) the optic disk is indistinct, (c) part of the image is very bright, and (d) part of the image is very dark.
After a retinal image is converted into a gray-level image, the symptoms visible in the gray-level image exhibit varying levels of brightness. For example, hard exudates and cotton wool spots are brighter than capillary hemangiomata, hemorrhages, and blood vessels. Therefore, the areas of bright spots, dark spots, or vessels in the image should be targeted and segmented for image detection to facilitate physicians’ symptom recognition.
This study proposes a retinopathy image segmentation (RIS) system to correctly segment the regions of bright spots, dark spots, and vessels from a retinal image. The RIS system can precisely segment the regions of bright spots, dark spots, and vessels from a retinal image. It is indifferent to noise in the image. This study also proposes a retinal-image-based tractional retinal detachment diagnosis (TRDD) system to automatically diagnose tractional retinal detachment in patients.
RIS system
One of the aims in this study is to segment the bright spots, dark spots, and blood vessels from retinal images helping physicians identify the symptoms of retinal abnormalities. Hence, the bright spots, dark spots, and blood vessels are the regions of interest (ROI) which the RIS system expects to segment. The RIS system comprises three stages:
Preprocessing: extract the retinal area from a retinal image;
Bright-spot segmentation: segment the bright spots from the segmented retinal area;
Dark-spot and vessel segmentation: segment the dark regions from the segmented retinal area (including dark spots and blood vessels), and then separate dark spots and blood vessels in the segmented dark regions.
Image preprocessing
First, the RIS system transforms a color retinal image I into a gray-level image Ig as follows

where IR (x, y), IG (x, y), and IB (x, y) are the red, green, and blue (RGB) color components of image I, respectively. 3 Figure 5(b) is the gray-level image of that in Figure 5(a).

(a) Original image, (b) gray-level image, (c) result obtained by Otsu’s thresholding method, and (d) result obtained by opening operation.
Because the background of a retinopathy image does not encompass ROI—bright spots, dark spots, and blood vessels, the RIS system then removes the background of the retinal image Ig. In the RIS system, Otsu’s 4 thresholding method is applied to Ig to derive the optimal threshold T* and generate a binary image Ib by

where 0 and 1 denote black and white pixels in Ib, respectively. The image in Figure 5(b) is then converted into a binary image shown in Figure 5(c).
The biggest white region in Ib (see Figure 5(c)) is considered to be the retinal region. Since a retinal image typically contains texts, the binary image Ib may include undesired bright text spots. Therefore, a structured element with 3 × 3 1-bit pixels is used, and opening operation (including two erosion operations and then two dilation operations) 5 is conducted on Ib to remove the text spots and the black holes in the retinal region, as shown in Figure 5(d). The image in Figure 5(d) is called a mask image Im.
On a retinal color image, RGB three-color components are, respectively, considered to three gray-level images, namely, IR, IG, and IB (i.e. Figure 6), among which IG exhibits the largest contrast in bright spots, dark spots, blood vessels, and others in the retinal region. Hence, the RIS system intends to extract bright spots, dark spots, and blood vessels from IG.
A (a) color image and its (b) IR, (c) IG, and (d) IB.
To facilitate the segmentation of the bright spots, dark spots, and blood vessels from IG, the RIS system stretches the contrast of the retinal region in IG to the range of 0 to 255 and creates a new gray-level image

where MinG and MaxG are the minimal and maximal gray levels of the retinal region in IG. Figure 7(a) shows the

(a) The
Bright-spot segmentation
This subsection describes the bright-spot segmentation in detail from the retinal region in
A retinal image may be taken with various lighting angles which may result in uneven brightness on the image. For example, in Figure 7(a), some bright spots are located in the darker area while others are located in the brighter area. Only using a global threshold cannot be effectively used to extract the bright spots from the image. In this study, PCF is proposed to solve this problem.
Let Sp be a set consisting of 2 × np − 1 pixels

The gray levels of IP are then stretched to the range of 0–255. After that, the RIS system creates a binary image Ibp by

where kbp is a given constant; µbp and σbp are the average and standard deviation of the gray levels in IP. The 1-bits in Ibp indicate that their related pixels in IP and
There may be noise (indicated by red arrows) in Figure 7(b) displaying the bright spots segmented from Figure 7(b) with np = 81 and kbp = 2. Assume Ai is the area of the ith bright spot in Ibp, Gi is the average gray level of the spot in IP, and
Dark-spot and vessel segmentation
This subsection explicates the segmentation of dark spots and vessels from the retinal region of
In this stage, a 3 × 3 mean filter
5
is first used to eliminate noise in

The processing procedure of dark area segmentation: (a) the image
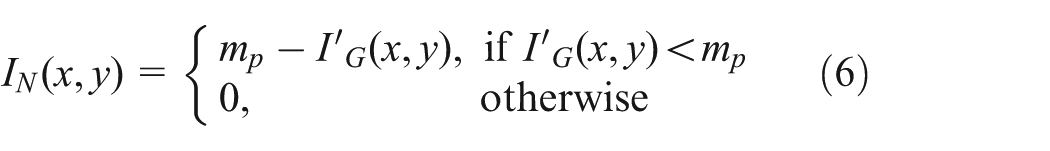
The gray levels of IN are then stretched to the range of 0–255. Figure 8(b) demonstrates the image IN obtained by NCF on the image in Figure 8(a) with nn = 81.
Some noise may appear and the contours of blood vessels may be disconnected in image IN (see the image in Figure 8(c)). The RIS system uses run-length enhancer 6 to solve above problems. Let WR be an nR × nR window in IN and IN (x, y) the central pixel of WR. Assume that Li is a line segment on WR and passes through IN (x, y), Ph1, and Ph2, and the included angle between Li and X-axis is 22.5 × h° for h = 0, 1, …, 7, where Ph1 and Ph2 are two pixels located on the boundary of WR.
Figure 9 shows the WR and eight line segments L0, L1, …, L7. If the gray level of IN (x, y) is less than the average gray level of all the pixels in WR, the run-length enhancer assigns

The WR and eight line segments L0, L1, …, L7.
After that, the RIS system generates a binary image Ibd by

where kbd is a given constant; µbd and σbd are the average and standard deviation of the gray levels in IR. The 1-bits in Ibd indicate that their related pixels in IR and
In image Ibd, the bright regions indicate the dark spots and blood vessels in

The segmentation results of dark spots and vessels from image Ibd in Figure 8(d) with Tv = 0.3: (a) the dark parts segmented and (b) the vessels segmented.
Genetic-based parameter detector–retinopathy image segmentation method
In this subsection, a genetic algorithm, called the genetic-based parameter detector–retinopathy image segmentation (GBPD-RIS) method, is used to determine the appropriate values of the parameters used in the RIS system. The segmentation results of the RIS system are considerably influenced by the parameters np, kbp, TbA, nn, nR, kbd, Tad, and Tv, np, kbp, and TbA which affect the effectiveness of bright-spot segmentation; nn, nR, kbd, Tad, and Tv decide the segmentation results of dark spots and blood vessels. The GBPD-RIS system will employ accumulated historical data to derive the most suitable values of parameters np, kbp, TbA, nn, nR, kbd, Tad, and Tv.
In the accumulated historical data, ground truth are the contours of bright spots, dark spots, and vessels manually drawn by ophthalmologists. Precision and Recall scores
7
are often used to measure the image segmentation results. True positive (TP) is the number of pixels which are considered to the pixels in ROI by the segmentation method and the ground truth. False positive (FP) is the number of pixels which are considered to the pixels in ROI by the segmentation method but not in the ground truth. False negative (FN) is the number of pixels which are considered to the pixels in ROI by the segmentation method but it is not. Precision and recall are then defined as:
In the GBPD-RIS method, each chromosome is divided into eight substrings sp, sbp, sbA, sn, sR, sbd, sad, and sv, respectively, describing the values of parameters np, kbp, TbA, nn, nR, kbd, Tad, and Tv. When given a chromosome Ch, the values of the parameters np, kbp, TbA, nn, nR, kbd, Tad, and Tv depicted by Ch are defined as


Then, the values of the parameters np, kbp, TbA, nn, nR, kbd, Tad, and Tv are used by the RIS system to segment the bright spots, dark spots, and blood vessels based on the accumulated historical data, and the obtained F-score of the segmentation is regarded as the fitness of Ch.
Initially, the GBPD-RIS method randomly generates Ng chromosomes, called initial chromosomes. Subsequently, the GBPD-RIS method alternatively performs mutation, crossover, and selection operations to evolve the optimal solution. In the mutation operation, a new chromosome is created for each initial chromosome Ch by randomly selecting a bit b from each substring. The selected bit b is then replaced by ¬b, where ¬ represents the bitwise operator NOT.
In the crossover operation, Ng pairs of chromosomes are randomly selected from initial chromosomes. Let ng be the number of bits in a chromosome and Mg a binary string with ng bits. For each selected chromosome pair Ch1 and Ch2, the GBPD-RIS method randomly selects
In the selection operation, the GBPD-RIS method selects Ng chromosomes with best fitness as new initial chromosomes for next run from Ng initial chromosomes, Ng chromosomes created by mutation operation, and Ng chromosomes generated by crossover operation. The GBPD-RIS method repeatedly alternatively executes mutation, crossover, and selection operations until the fitness of the reserved initial chromosomes is very closed or the number of runs is equal to a given maximal number MAX_NO_RUN of runs.
TRDD system
The second purpose of this study is to develop a TRDD system to automatically diagnose tractional retinal detachment disease based on patient’s retinal image. The TRDD system contains three steps: gray-level co-occurrence matrix (GLCM) analysis, bilayer feature matching (BFM), and GBPD-TRDD method. In the GLCM analysis step, the red and green components of the retinal image (i.e. the mages in Figure 11) are used to create co-occurrence matrixes. BFM is then conducted. Specifically, for each retinal image, GLCM is employed to calculate four features: contrast, dissimilarity, correlation, and inverse difference moment. To increase the recognition rate of the TRDD system, K-means clustering 8 is conducted repeatedly to categorize an image set into small classes. The number of small classes will be determined by a genetic-based algorithm, which is also adopted to determine the most suitable parameter values for increasing the recognition rate of the TRDD system.

The red, green, and blue color component images of a retinal image: (a) original color image, (b) red color component image IR, (c) green color component image IG, and (d) blue color component image IB.
GLCM analysis
Co-occurrence matrix (GLCM) is a frequently used texture analysis method in image processing and pattern recognition. 9 This study will take it to describe the characteristics of a gray-level image I0. A co-occurrence matrix is the conditional joint probabilities of all pair-wise combinations of the gray levels in I0 for given two parameters inter-pixel distance (δ) and orientation (θ). The co-occurrence matrix can be defined as: Mc (i, j) = {P (i, j) | (δ, θ)}, where P (i, j) (the co-occurrence probability between gray levels i and j) is defined as

where Cij is the occurrences of gray levels i and j in I0 based on a certain (δ, θ) pair; and G is the quantized number of gray levels. The sum in the denominator thus represents the total number of gray-level pairs (i, j) within I0. The four statistics in Table 1 are often applied to describe the texture features of an image based on the co-occurrence probabilities. 10
Co-occurrence texture statistics.

For a color retinal image IRGB, the red and green color components can clearly indicate the symptoms of retinal detachment (see Figure 11). Let IR and IG be the images formed, respectively, by the red and green color components of IRGB. The TRDD system will apply the co-occurrence statistics of IR and IG to describe the texture characteristics of IRGB and then diagnoses the tractional retinal detachment disease based on the extracted co-occurrence texture statistics with δ = 1, and θ = 0°.
BFM
The TRDD system divides the accumulated historical retinal images into two sets: one consisting of the retinal images taken from the patients with tractional retinal detachment, and the other containing the retinal images taken from healthy normal persons. Let Sd be the set comprising the retinal images taken from the patients with tractional retinal detachment and Sn be the set containing the retinal images taken from healthy normal persons. Also let fc, fd, fr, and fi are the contrast, dissimilarity, correlation, and inverse difference moment features of an image in a retinal image set, and cc, cd, cr, and ci be, respectively, the averages of fc, fd, fr, and fi of all the images in the set. The cc, cd, cr, and ci are generally employed to depict the characteristics of the images in the set. We call (cc, cd, cr, and ci) the class centroid of the image set. If the content of the images in a set is quite different, cc, cd, cr, and ci cannot precisely depict the characteristics of the images in the set. This study hence provides BFM method to solve this problem.
Figure 12(a) shows two data sets S1 and S2. C1 (resp. C2) is the class centroid of S1 (resp. S2). Assume there is a quite difference in within-class variances between S1 and S2; a datum X is in set S1 but far away from class centroid C1, and the within-class variance of S1 is much greater than the within-class variance of S2. X will be misclassified into S2 since the distance between X and C1 is much longer than the distance between X and C2.

Example for the bilayer feature matching method: (a) an input data x is exactly around the boundary of two classes C1 and C2, and (b) two classes C1 and C2, and their subclasses.
To deal with the problem mentioned above, the BFM method categorizes all the data in one set into some small classes. When given a datum X, the BFM method calculates the distance between X and each small class. If the distance dci of X and small class c is minimal, the BFM method considers that X is in the set which class c belong to. In Figure 12(b), S1 is partitioned into four small classes, the class centroids of which are C11, C12, C13, and C14; S1 is separated into two small classes, the class centroids of which are C21 and C22. Since X is most closed to C12, X is in S1.
K-means clustering algorithm 8 is one of the commonly used clustering methods. The BFM method applies K-means clustering algorithm to classify the images in Sd into nd small classes and the images in Sn into nn small classes according to their contrast, dissimilarity, correlation, and inverse difference moment features. Let Cnc = (cncc, cncd, cncr, cnci) be, respectively, the averages of the contrast, dissimilarity, correlation, and inverse difference moment features of all the images in small class c of Sn, and Cdc = (cdcc, cdcd, cdcr, cdci) be the averages of the contrast, dissimilarity, correlation, and inverse difference moment features of all the images in small class c of Sd. When given a retinal image with the features X = (fc, fd, fr, fi) of contrast, dissimilarity, correlation, and inverse difference moment, the BFM method assigns X to set h, where

where ns is the number of small classes in set Ss.
In the K-means clustering algorithm and the BFM method, the distance d (X, Csc) between data X and class centroid Csc is defined as

where wk and rk are the given constants.
GBPD-TRDD method
The performance of the TRDD system is considerably affected by the parameters nn, nd, wc, wd, wr, wi, rc, rd, rr, and ri. In this study, a genetic-based parameter detector (GBPD-TRDD method) is proposed to determine the optimal parameters which are used in the TRDD system. Similarly to the GBPD-RIS method, in the GBPD-TRDD method, each chromosome is divided into 10 substrings

where
Experimental results and discussions
This section is to investigate the performances of the RIS system and the TRDD system by experiments based on the images downloaded from structured analysis of the retina (STARE) retinal image database. 11 The STARE database provides the symptom locations marked by professional physicians. Moreover, the retinal images in the database were all taken by the TopCon TRV-50 fundus camera with a 35° field of view. Each image consists of 605 × 700 pixels with eight bits per RGB channel. 11
The performances of the RIS system
Experiment 1 is to derive the optimal values for the parameters np, kbp, TbA, nn, nR, kbd, Tad, and Tv used by the RIS system via the GBPD-RIS method. In the following experiments in this subsection, 60 images containing bright spots and dark spots downloaded from the STARE database are used as test images. In the first experiment, each of sp, sn, and sR is described by 10 bits, and each of sbp, sbA, sbd, sad, and sv is described by 15 bits. Table 2 shows the most suitable values of the parameters obtained in this experiment. These values will be used by each following experiment in this subsection.
The most suitable values of the parameters used by the retinopathy image segmentation system.

In experiment 2, the RIS system and Eddins’ 12 watershed method are used to segment the bright and dark spots. Tables 3 and 4 demonstrate the experimental results. Recall, precision, and F-score are used to explain the effectiveness of the segmentation methods. Table 3 explains that the RIS system provides a lower recall than the watershed method does. However, the RIS system gives much higher precision and F-score than the watershed method does. Figure 13 shows the segmentation results for some test images. From Figure 13, one can obviously observe that Eddins’ watershed method loses much more areas of bright spots while the RIS system give a little quantity of bright-spot areas which are not in the round truth. Table 4 explains that the RIS system gets far higher recall, precision, and F-score than Eddins’ watershed method does. Figure 14 shows the segmentation results for some test images. Figure 14 displays that the RIS system is much superior to Eddins’ watershed method in extracting dark spots from a retinal image.
Bright-spot segmentation results.

RIS: retinopathy image segmentation.
Dark-spot segmentation results.

RIS: retinopathy image segmentation.

Bright-spot segmentation: (a) and (b) the ground truth on two image; (c) and (d) the results obtained by the retinopathy image segmentation system; (e) and (f) the results obtained by Eddins’ watershed method.
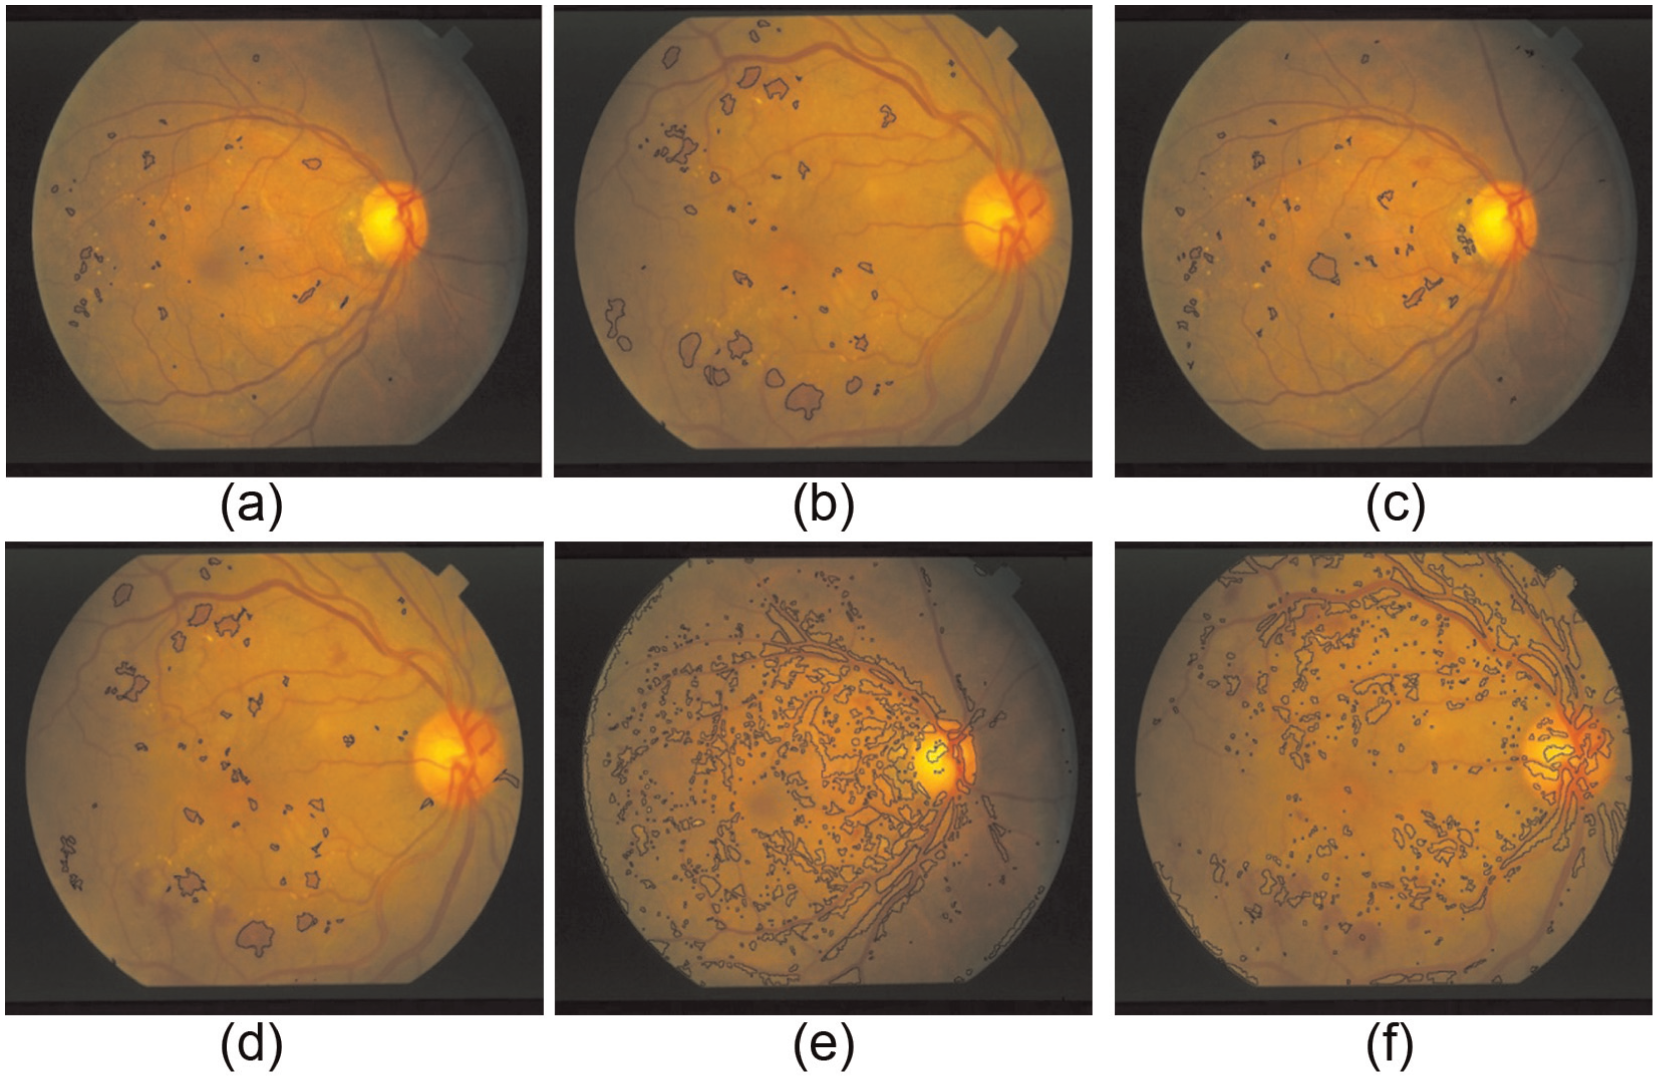
Dark-spot segmentation: (a) and (b) the ground truth on two image; (c) and (d) the results obtained by the retinopathy image segmentation system; (e) and (f) the results obtained by Eddins’ watershed method.
Experiment 3 is to extract blood vessels from retinal images by the RIS system, Mendonca’s method, 13 and Hoovers’ method. 14 Table 5 exhibits the experimental results and Figure 15 shows the segmentation results for some test images. The effect of blood vessel segmentation achieved by the RIS system is better than those obtained by Mendoncas’ method and Hoovers’ method.
Blood vessel segmentation results.

RIS: retinopathy image segmentation.
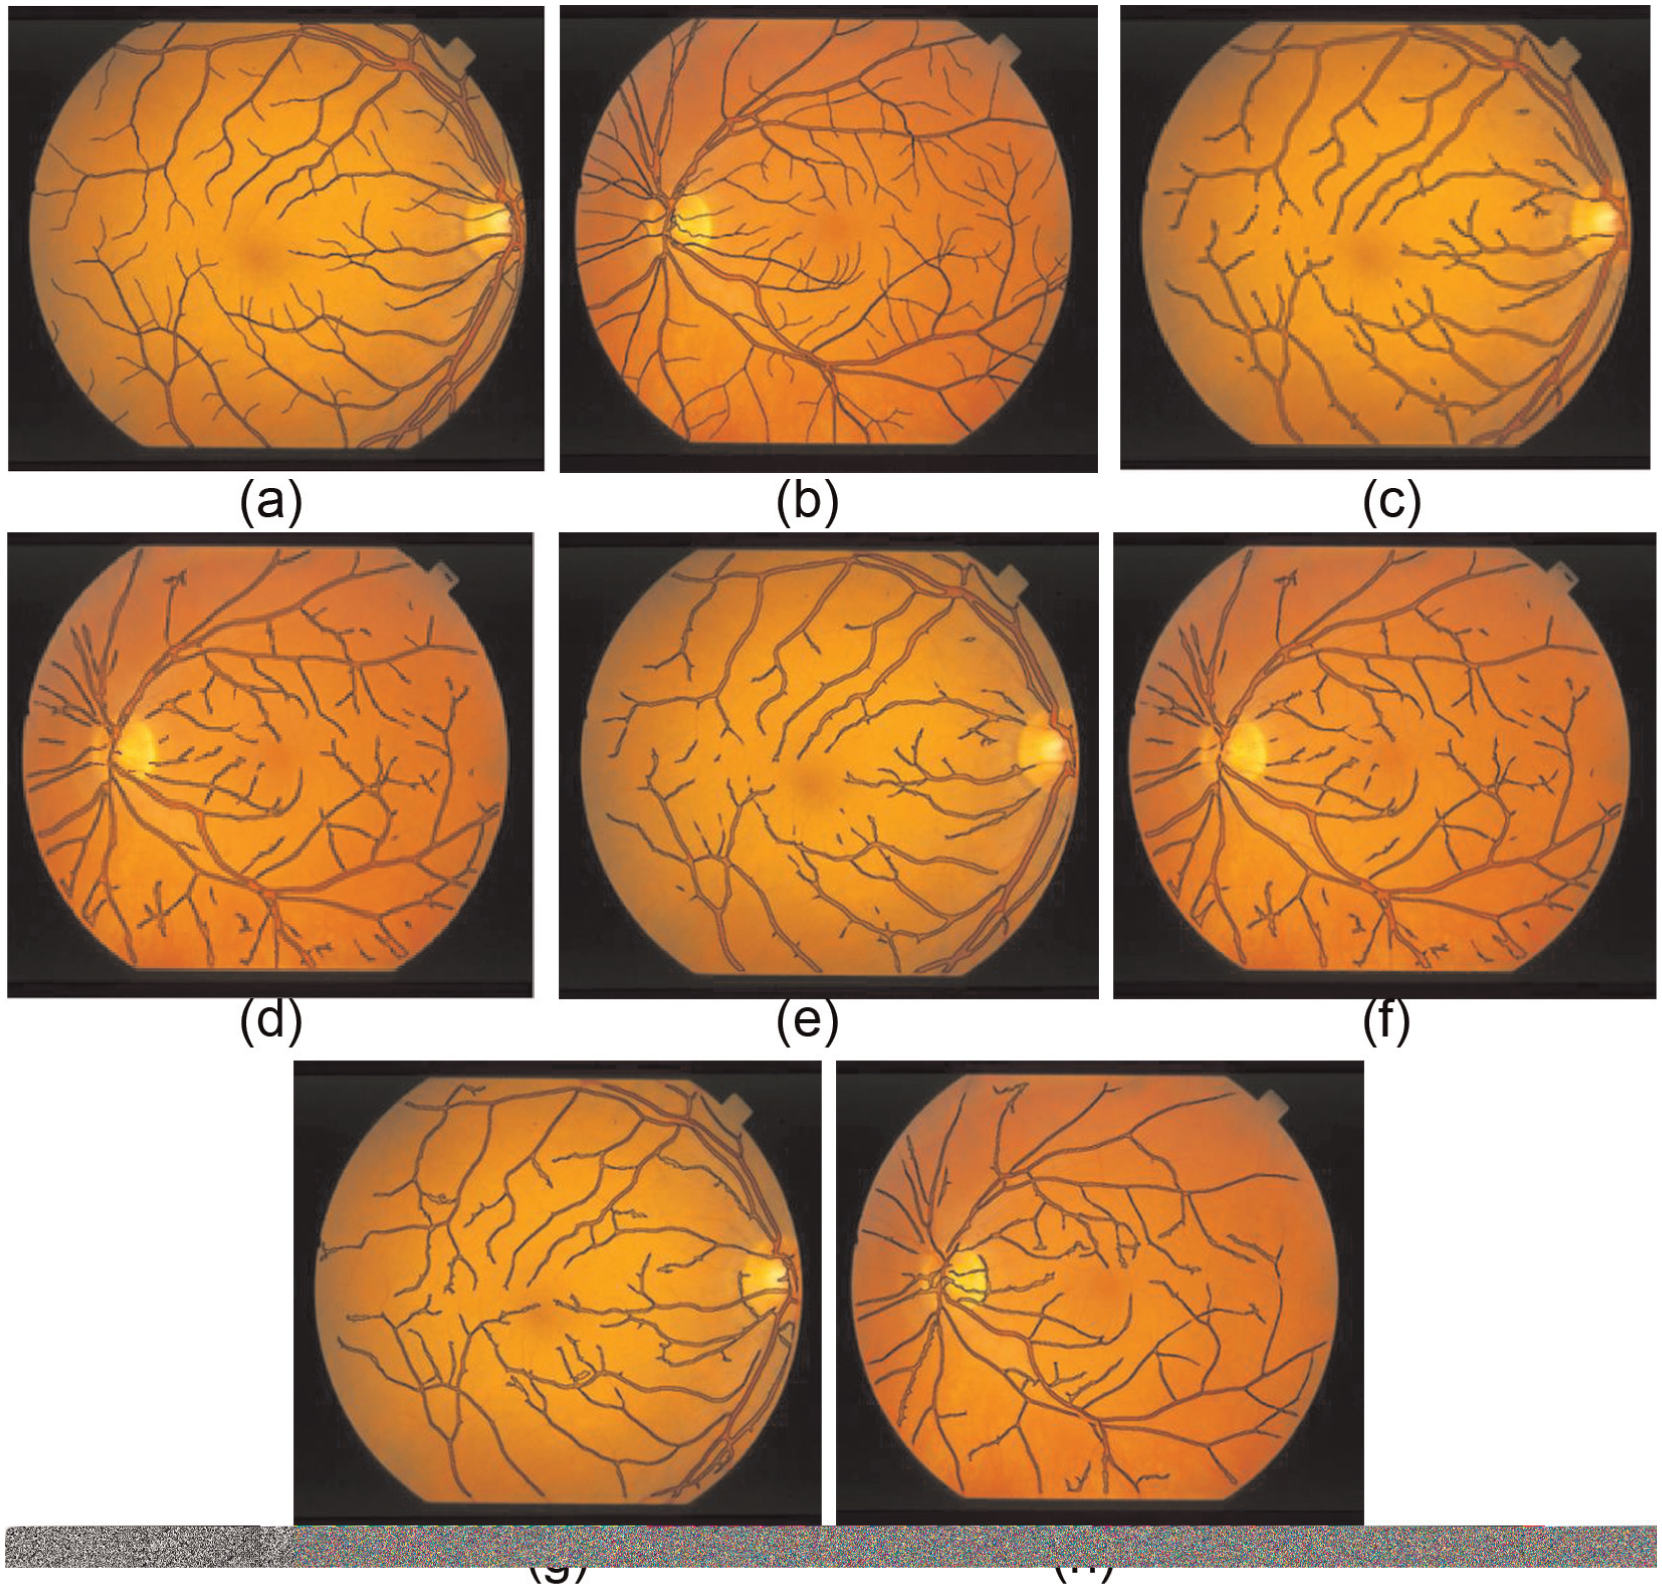
Blood vessel segmentation: (a) and (b) the ground truth on two image; (c) and (d) the results obtained by the retinopathy image segmentation system; (e) and (f) the results obtained by Mendonca’s method; (g) and (h) the results obtained by Hoovers’ method.
The performances of the TRDD system
Next experiment is to derive the optimal values for the parameters nn, nd, wc, wd, wr, wi, rc, rd, rr, and ri used by the TRDD system via the GBPD-TRDD method. In the experiments in this subsection, 53 retinal images downloaded from STARE database were used, including 23 images taken from healthy normal persons and 30 images taken from the patients with tractional retinal detachment are used as test images. In this experiment, each of the substrings
The optimal values of the parameters used by the tractional retinal detachment diagnosis system.

The last experiment is to investigate the performance of the TRDD system based on the 53 test images. The experimental results indicate that the TRDD system achieves an accurate rate of 92% in diagnosing tractional retinal detachment.
Conclusion
The patients suffering from hard exudates and cotton wool spots usually have common symptom bright spots in their retinopathy images, and the ones suffering from capillary hemangiomata, hemorrhages, and vascular abnormality usually have common symptom dark spots in their retinopathy images, and they may lead to vascular malformations. This study hence proposes the RIS system to segment the bright spots, dark spots, and blood vessels in retinal images. Additionally, retinal detachment caused by proliferative diabetic retinopathy is a primary factor causing vision loss. The TRDD system is also developed to automatically diagnose tractional retinal detachment based on retinal images.
In this study, PCF and native cross filtering are presented to eliminate the influence of uneven brightness on the image caused by uneven light exposure. The BFM method is proposed to promote the performance of the TRDD system. The GBPD-RIS and GBPD-TRDD methods are provided to determine the most suitable parameters used in the RIS system and the TRDD system. The RIS system and the TRDD system can give impressive experimental results.
Footnotes
Academic Editor: Stephen D Prior
Declaration of conflicting interests
The author(s) declared no potential conflicts of interest with respect to the research, authorship, and/or publication of this article.
Funding
The author(s) received no financial support for the research, authorship, and/or publication of this article.