
Abstract
The objective of this study was to evaluate the aerosol-release time in the development of a new automatic adapter for metered dose inhaler. With this device, regular manually operated metered dose inhalers become automatic. During the study, an inhalation simulator was designed and tested with the newly developed mechatronic system. By adjusting the volume and the pressure of the vacuum tank, most human inhalation waveforms were able to simulate. As an example, regular quick-deep and slow-deep waveforms were matched within reasonable accuracy. Finally, with the help of dynamic image processing, the aerosol-release time (Tr) was carefully measured and fully discussed, including the switch-on time (Ts), the mechatronics-hysteresis (Tm) and the intentional-delay (Ti). Under slow-deep inhalation condition which is suitable for metered dose inhaler medicine delivery, the switch-on flow-rate could reach as low as 10 L/min, and the corresponding switch-on time was approximately 0.20 s. While the mechatronics-hysteresis depended on the brand of metered dose inhaler, assuming there was no intentional-delay, the aerosol-release time could be as low as 0.40 and 0.60 s, respectively, for two commercially available metered dose inhalers studied in this article. Therefore, this newly developed mechatronic adapter system could ensure aerosol-release time (Tr) within satisfactory range for metered dose inhalers.
Keywords
Introduction
Metered dose inhaler (MDI) is one of the most popular inhalation drug devices to treat patients with respiratory diseases. 1 However, the major shortcoming of the manually operated device is the coordination between inhalation and the activation of the canister. 2 In order to overcome this problem, some automatic MDIs were developed, such as the Autohaler® by 3M Company which is a type of MDI equipped with a spring mechanism. 3 Prime to inhale, the spring is loaded. Once the patient inhales, the air flow drives the vane, actuating the triggering mechanism and release one dose of medicine. 4 However, its activation flow rate is as high as 30 L/min and it is not ideal for children, elderly and the serious ill patients.
A mechatronic device has been developed which can easily adopt and operate most commercially available MDIs. 5 For this system, however, to ensure good coordination, one of the most import parameters is the aerosol-release time Tr. If the period is too long, only a little or even no medicine particles can reach designated areas for the patient. Broeders et al. 6 indicated that for MDI, the optimal aerosol-release time is 0–0.2 s. However, for most people, it is almost impossible to make the aerosol release at that time. Longest et al. 7 set the aerosol-release times as 0.63 s for slow-deep (SD) inhalation, based on their numerical simulations.
To accurately study the aerosol-release time, the establishment of inhalation conditions is important. The medicine package instructions from the dry powder inhaler (DPI) and MDI instruct the user to inhale ‘quickly and deeply’ and ‘slowly and deeply’, respectively. However, only a few researches have studied or utilized quick-deep (QD) inhalation and SD inhalation waveforms in numerical simulations and in vitro experiments. In numerical simulation, Li et al.8,9 studied the axial velocities and secondary flow of steady-state inhalation and transient inhalation under resting conditions and later simulated these two inhalation conditions and compared the micro-particle deposition in realistic human lung airway models. Huang and Zhang 10 also simulated transient airflow patterns and particle deposition during both inspiratory and expiratory processes at light activity conditions. Furthermore, Tian et al. 11 developed equations for describing the QD waveform pattern and then simulated the waveform and the tracheobronchial deposition of pharmaceutical aerosols at a stochastic individual path (SIP) model. Longest et al. 7 used the waveform equations of Tian et al. 11 for both QD and SD and calculated parameters of the waveform, then simulated them and compared the aerosol deposition of MDI and DPI. For the in vitro experiments, steady flow was generated by a vacuum pump,7,12 and transient inhalation flow was generated by a breathing machine.13,14 However, in this research, a rather simple system with a vacuum tank was designed and applied to simulate transient inhalation flows.
Dynamic image processing is a useful tool to study the characteristics of particle movement. Zhang 15 monitored the air pollution level by comparing the grey value of dynamic images of the smoke from Ringelman black. Hochrainer et al. 16 used video recording and laser light diffraction to determine the aerosol velocity and spray duration. Ju et al.17,18 used high-speed imaging and dual lasers to measure the spray characters of a flashing mixture containing inerts. Wang and Angel 5 used laser-reflection method to observe medicine aerosol going through airway tubes. Recently, Buchmann et al. 19 used high-speed imaging to predict the macroscopic spray characteristics of a solution from pressurized MDIs. However, very few studies used laser-assisted dynamic image processing to study the characteristics of aerosol in the respiratory system.
In this study, a newly developed automatic adapter for MDI is presented. To simulate inhalation waveforms and measure aerosol-release time (Tr), an inhalation simulator is developed. With the help of dynamic image processing and laser scatter theory, the switch-on time (Ts), mechatronics-hysteresis (Tm) and intentional-delay (Ti) are investigated to reach better control of the aerosol-release time.
Materials and methods
Materials
Two brands of commercially available MDIs were used for this study:
Berotec® N (100 µg/puff) Metered Aerosol, which is made by Boehringer Ingelheim GmbH, Germany and delivers fenoterol at a single dose of 100 µg, is marked MDI A in this article.
Seretide™ Evohaler™ which is chlorofluorocarbon (CFC)-free, delivers salmeterol and fluticasone propionate single doses of 25 and 250 µg, respectively, is marked MDI B in this article.
The automatic MDI
The mechatronic adapter, which suited and activated regular MDI automatically, was called automatic MDI. It consisted of three major units: a signal acquisition device, a micro-control unit (MCU) and an actuation mechanism, and can install different bands of MDI, as shown in Figure 1.

The structure of the automatic metered dose inhaler.
While the patient inhales, the airflow bypassed through a small hole into the impeller chamber and drove the impeller to turn and the hall sensor at the top acquired the signal. The rotation speed of the impeller was then calibrated into the inhalation flow rate through the micro-control system that also drove the actuation mechanism to activate the pressurized medicine canister of MDI, releasing the medicine particles into the air way of that patient.
Mechanism of the inhalation simulator
The experimental apparatus
The experimental apparatus is illustrated in Figure 2, including the automatic MDI, camera system, upper respiratory system and inhalation waveform simulation system.

Experimental apparatus.
The model of the upper respiratory system included the mouth–throat (MT), trachea and main bronchi sections. An ‘L’-shaped tube of 20.1 mm diameter was used for the MT and trachea portions, and the length was based on a real iatrical graph of a human being. The main bronchus was a Y-shaped airway bifurcation and the diameter was 15.6 mm. 20 The tubes were all made of high-light transmission glass.
The image recording system consisted of lasers as the illumination source and a high-speed camera. Green point lasers with a wavelength of 532 ± 10 nm and output power of 1000 mW were used. A high-speed camera (CASIO EX-ZR1000) was chosen, and the video frame rate in this study was 480 fps. According to the ‘Tyndall effect’, when the laser ray passed through the aerosol, the direction of the laser ray can be visualized. For better viewing, the laser was adjusted carefully at appropriate position and orientation.
The inhalation waveform simulation system was composed of five units: a vacuum pump, two vacuum tanks, two valves, an instant and cumulative flow meter and a computer, as shown in Figure 2. The vacuum pump was 350 W in power, LAB-A4050P by Uni-Crown Co. Taiwan. Two steel vacuum tanks were 4 and 6 L in volume, which was connected with ball valves. Valve #1 was connected to the vacuum pump and controlled the vacuum pressure of the vacuum tank, while Valve #2 was connected to the respiratory system through the flow meter and controlled the inhalation flow rate. The flow meter (AALBORG GFM67, flow range 0–200 L/min, made in United States) was connected to the tank #2 and the upper respiratory system. The output signal of the flow meter was linear 0-5VDC and the instant flow rate was read to the computer with sample time of 1/15 s.
Simulate inhalation waveforms
There are two main inhalation waveforms for drug inhalation: SD and QD breathing. 7 The main parameters of the two inhalation waveforms are the peak inhalation flow rate (QPIF), time to peak inhalation flow rate (TPIFR) and total volume inhaled.
In this study, a new method of simulating real inhalation waveforms was designed. According to the total inhalation volume, the vacuum tank can be calculated, assuming there were three states for the air of inhalation waveform simulation system. State 1 was the state of the tank after vacuum. Its pressure P1 is determined by the ability of the vacuum pump. State 2 was the state of the tanks after inhalation, assuming its pressure P2 was the atmospheric pressure due to free breathing. State i was the state of inhaled air. Its pressure Pi was the atmospheric pressure, and the volume Vi was the total volume inhaled.
According to the mass conservation law, the ideal gas state equation and the first law of thermodynamics, the volume of the vacuum tank can be calculated as formula (1)

where γ was the specific heat ratio of air and
For moderate chronic obstructive pulmonary disease (COPD) and stable asthmatic patients, the total inhalation volume is approximately 3 L. 6 However, in simulation, to intake 3 L of air, the minimum theoretical volume of the tank should be 4.2 L at absolute vacuum, which is impossible to achieve. Therefore, the volume of the tank used in the simulation system must be higher.
Because the speed of air flow is higher for QD than that in SD inhalation, the vacuum pressure should be higher correspondingly. However, if one same tank is used for QD as well for SD conditions, the peak flow rate cannot be achieved for QD or the duration of inhaling time cannot be reached for SD inhalation. Therefore, two tanks were selected and connected parallel for the simulations. Many experiments had been conducted to determine the suitable volume for the two tanks and the combination of 6+4 L were finally used, 6 L for QD and 10 L for SD, respectively. Moreover, P1 can be inversely solved by formula (1) and the parameters are shown in Table 1.
Parameters for inhalation waveform simulation system.

QD: quick deep; SD: slow deep.
Dynamic image processing
Dynamic image processing was used to estimate the character of the medicine aerosol in the tube and the movement of the medicine canister. To process the images, the video was converted into a sequence of images. The differences in the images can be obtained by comparing the mean grey value (MGV) of the region of interest (ROI). 15
The MGV can be calculated as follows

where n was the pixels of the ROI,
The condition of the images can be judged as follows:
If MGVj+1 − MGVj ≤ threshold, the images were the same.
If MGVj+1 − MGVj > threshold, the images were different.
where MGVj and MGVj+1 were the MGV of the jth and the (j+1)th picture of the image sequence.
To judge whether the aerosol passing the tube or not, a laser beam was pointed in the ROI 1, as shown in Figure 3(a). The more aerosol in the tube, the brighter the laser beam and the higher the MGV in the ROI 1.

The ROI of the inhalation tube and the medicine canister: (a) the variation of the ROI 1 at the inhalation process and (b) the ROI 2 of the medicine canister.
To visualize and record the movement of the medicine canister, a black triangle was inverted on the wall and the bottom of the triangle was the ROI 2, as shown in Figure 3(b). When the triangle went down with the canister, the MGV of the ROI 2 varied. The deeper the triangle moved down, the more the black area inside the ROI 2 and the lower the MGV value.
Measurement of aerosol-release time
The aerosol-release time (Tr) was defined as the time from the start of inhalation to the time the aerosol began to release. This period was divided into three sections: switch-on time (Ts), mechatronics-hysteresis (Tm) and intentional-delay (Ti), as shown in Figure 4. Ts was the period between the starting of inhalation and the connecting of the signal device. Tm was caused by the inhered delay in the system such as the backlash of the gear transmission and the hesitation of MDI medicine release after press. Ti was the time that can be adjusted by the computer program to reach optimum value.

Definition of different periods (Ts, Tm and Ti) of aerosol-release time (Tr).
Measurement of switch-on time
The switch-on time (Ts) was very important for the automatic MDI. The length of Ts may affect medicine release. It was determined by the sensitivity of the signal acquisition device and the inhalation waveform.
For signal acquisition device, only when the magnet rotated to the top, the hall sensor can obtain the inhalation signal. The inhalation flow rate which can just drive the impeller to rotate a whole circle was defined as switch-on flow-rate (QS). In this research, the first signal set as the zero point of the inhalation and the second signal set as the impeller act time (Ta). During inhalation, when the flow rate was above QS, the acceleration of the impeller was positive, so the rotational speed of the impeller increased. When the inhalation flow rate was below QS, the impeller would still rotate due to the force of inertia, but the acceleration of the impeller was negative, and the rotary speed decelerated. As shown in Figure 5, Th was the time at which peak rotary speed and the 0 acceleration. It was the impeller driving lasting time, which was defined as the switch-on period. However, at static, the magnet was at the bottom, when the sensor obtained the first signal, and the impeller had rotated a half cycle. So the switch-on time should consider it, and calculated as follows


(a) Rotary speed of the impeller and (b) angular acceleration of the impeller.
Based on above assumptions, the switch-on flow-rate (QS) and the switch-on time Ts can be obtained by matching the switch-on period with the inhalation waveform measured by the instant flow meter, as shown in Figure 6.

Measurement of switch-on time (Ts) and switch-on flow-rate (Qs).
Measurement of the mechatronics-hysteresis and the intentional-delay
To measure the mechatronics-hysteresis (Tm), the switch-on time (Ts) must be recorded first. However, for this automatic MDI, it was difficult to measure directly. Thus, a light-emitting diode (LED) light was connected with the signal acquisition unit to show the starting point. The intentional-delay (Ti) was adjusted by the computer. Tm and Ti were measured together. When measuring Tm, Ti was adjusted as 0.
Tm was measured by dynamic imaging processing technique. The video recording, which was cut for latter measurement and analysis, was between the start of LED-on and the end of the inhalation. In this study, the single frame time is 0.002 s. Since Ricardo reported that at the beginning of aerosol release, the spray velocity was about 40 m/s. 21 Based on this speed, the time duration for the aerosol passes from the mouth inlet to the ROI 1 is less than 0.002 s and can be neglected.
Figure 3(a) demonstrates the different status of the ROI 1 and LED during the whole inhalation process. When the switch-on flow-rate is below Qs, the signal switch and the LED are turn off. When the switch-on flow-rate reaches at Qs, the signal switch and the LED turn on. When aerosol is released from MDI, the laser is on. The time at which the aerosol starts to release can be calculated by comparing the MGV values in the ROI. Therefore, the sum of Tm and Ti can be measured and the length is from the starting of LED on to the appearance of laser beam in ROI 1.
Results and discussion
Simulation of inhalation waveforms
The major parameters for simulating QD and SD inhalation waveforms, which are compared with the Longest et al., 7 are presented in Figure 7.

The QD and SD waveforms obtained from the experiment.
Compared with the literature of Longest et al., 7 for the 6-L vacuum tank, the peak inhalation flow rate (QPIF) and the peak inhalation flow rate time (TPIFR) were almost the same for QD, but the TPIFR was smaller for SD. For the 10-L vacuum tank, the QPIF was almost the same, and the TPIFR was larger for SD. However, the QPIF was smaller than the literature for QD.
According to the flow rate formula, the flow rate was proportional to the entrance area and the velocity of the air. In this study, the open area was controlled by the valve. The velocity of the air was related to the pressure difference between the two sides of the valve port and the open speed of the valve. The main parameter for simulating the waveform pressure difference was decided by the pressure of the working vacuum tank.
In this study, the total volume inhaled was constant. The differential pressure of the 6-L tank was greater than that of the 10-L tank according to formula (1), so the initial flow rate of 6 L tank increases faster than that of 10 L tank. The largest QPIF of the 10 L was smaller than that of 6 L tank. To simulate the QD and SD inhalation waveforms in the literature, 7 the 6-L tank was selected for the QD waveform. The corresponding vacuum pressure was calculated as −530 mm hg. The 10-L tank was selected for the SD waveform, and the vacuum pressure was −320 mm hg.
The simulation of the inhalation waveform is a complex task; however, the main parameters that affect the waveform are the vacuum pressure (P1) and the volume (V) of the working vacuum tank, the open speed (vv) and the open area (Av). The waveform can be expressed as follows

The aerosol-release time
The results from the measurement are expressed in the following sections. For the MDI, SD inhalation is suggested, so all measurements were based on SD inhalation.
Switch-on time
The advantage of the impeller and hall sensor system was that the rotation speed of the impeller can be read by the computer, and the intentional-delay can be adjusted by the computer, as shown in Figure 8. The switch-on period can be calculated by formula (3). The experiments were tested dozens of times, and the mean value is as follows: the switch-on period is 3.86 s; the switch-on flow-rate (QS) is approximately 10 L/min and the switch-on time (Ts) is approximately 0.20 s.

The interface of the automatic MDI.
In the future, the speed can be converted to the flow rate of inhalation. The doctor and the patients can see the flow rate of inhalation clearly, which is good for inhalation training.
The mechatronics-hysteresis and the intentional-delay
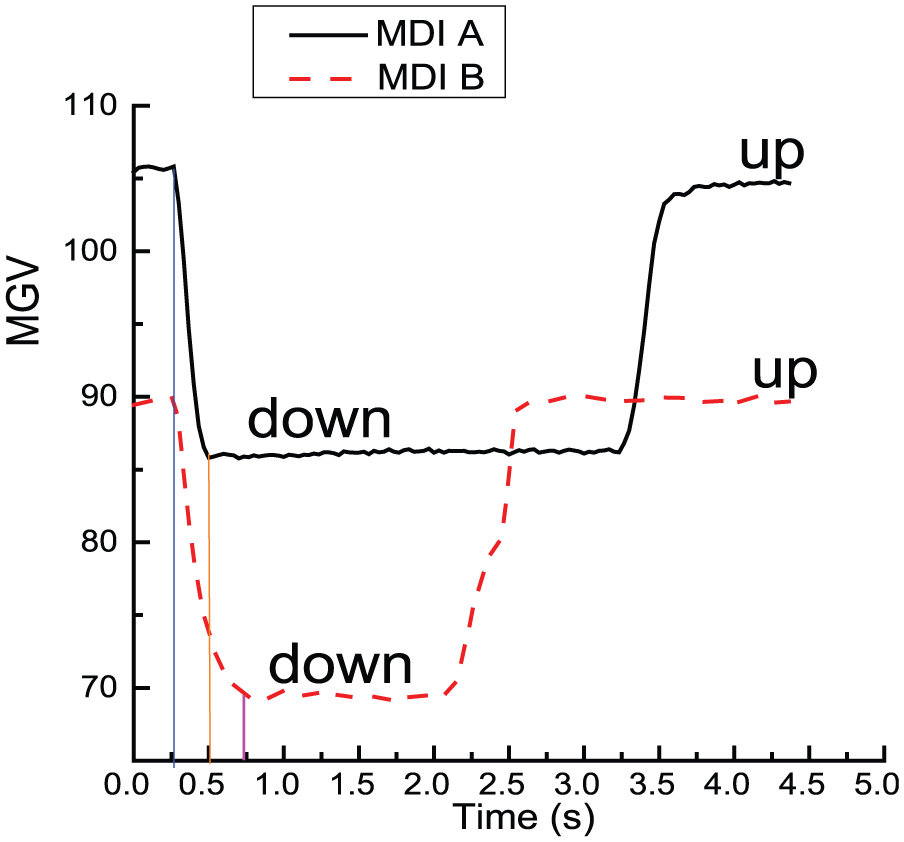
It is clear that pressing the canister from up to down, the MGV of the ROI 2 decreases, as shown in Figure 9. The pressing-down time of MDI A and MDI B was 0.267 and 0.433 s, respectively. However, from the comparison of the variation of ROI 1 and ROI 2, it was found that the medicine aerosol sprayed before the canister was pressed down completely. The aerosol spray time was 0.167 and 0.367 s for MDI A and MDI B, respectively. Therefore, different MDIs have different aerosol spray time. When considering the mechatronics-hysteresis (Tm), the type of MDI must be considered.
Pressing-down time of different brands of MDI.
For the automatic MDI, the intentional-delay (Ti) was adjusted by the computer. In this study, Tm was tested at four different Ti, each repeated four times. The mean results are demonstrated in Figure 10. When the respiratory tube was without aerosol, the MGV was low and almost kept the same. When the aerosol passed through the tube and the MGV value changed. The width of the impulse represents the traveling period of the aerosol in ROI 1. The mean Tm was 0.20 s for MDI A and 0.40 s for MDI B.

The mechatronics-hysteresis (Tm) of two brands of MDI.
The aerosol-release times (Tr) of different bands of MDI are demonstrated in Table 2. Tr raises with the increase in Ti. In the literature, Longest et al. 7 suggested Tr to be around 0.63 s for MDI with SD flow rate, or aerosol releases at the middle point of inhalation acceleration, to get better treatment. The experimental results for Tr of different bands of MDI are listed in Table 2. It is clear from the table that Ts is a constant, Tm depends on the bands of MDI and Ti can be adjusted with computer programming (the timer). Since the summation of Ts, Tm and Ti equals Tr, therefore in order to reach a suitable Tr, it is now very practical by appropriately adjusting the timer, for this novel adapter.
The aerosol-release time of different brands at different intentional-delay.

MDI: metered dose inhaler.
Conclusion
An inhalation simulator was designed and tested in this article to fully study the aerosol-release time of a new automatic MDI. It is found that the regular inhalation waveforms can simulated by adjusting the volume and the vacuum pressure of the air tank. The aerosol-release time was related to switch-on time (Ts), the mechatronics-hysteresis (Tm) and the intentional-delay (Ti). Ts depends on the sensitivity of the signal acquisition device. The switch-on flow-rate (Qs) of the impeller and hall sensor acquisition device could reach as low as 10 L/min, and the corresponding Ts was approximately 0.20 s. Nonetheless, Tm depends on the brand of MDI: assuming there is no intentional-delay, Tm could be as low as 0.20 and 0.40 s, respectively, for two commercially available MDIs studied in this article. Ti can be adjusted to the optimum value by the computer.
Not only this study confirmed that the newly developed automatic system could ensure aerosol-release time (Tr) within satisfactory range for usually manually operated MDIs, the results and parameters obtained from this experiment are also very helpful to better understanding and better design the automatic inhale medical device.
Footnotes
Academic Editor: Teen-Hang Meen
Declaration of conflicting interests
The author(s) declared no potential conflicts of interest with respect to the research, authorship and/or publication of this article.
Funding
The author(s) disclosed receipt of the following financial support for the research, authorship and/or publication of this article: This work was financially supported by the National Science Council of Taiwan under the contract number MOST 103-2221-E-168-003.