
Abstract
Reliable dynamic model of gear system with pitting can be utilized to investigate the effects of surface pitting on vibration response and to identify its severity. In this study, a dynamic model with pitting based on image processing is proposed, and pitting is simulated through the discrete tooth surface. The contact points are modeled by a network of linear springs with different stiffness in parallel. The revised mesh stiffness is calculated and a new mesh stiffness calculation method with surface pitting is proposed, which combines pixel matrix with mesh stiffness to improve the accuracy and efficiency of calculation. The dynamic model is validated by comparison with experimental test signals under different rotations and pitting states. As the Hilbert–Huang transform energy spectrum method has been applied for the detection of the vibration signals with small pitting areas, the signal characteristics caused by pitting can be well represented based on the statistical indicators and energy spectrum.
Highlights
A dynamic model with surface pitting based on image processing is proposed.
A new mesh stiffness calculation method based on surface pitting stiffness matrix is studied.
The proposed model is validated by experimental tests.
The statistical indicators and energy spectrum are induced based on the Hilbert–Huang transform energy spectrum method.
Introduction
Gears are key components for connecting and transmitting power. Due to the tough working conditions or improper gear design, the gear system is prone to failure. Compared with crack and wear, surface pitting is the most typical failure mode and the research on pitting is crucial to fault diagnosis.1,2 A reliable dynamic model can be utilized to investigate the effects of surface pitting on vibration response and to reduce the costs of diagnosis algorithms. Dynamic simulation of gear transmission with pitting plays an important role in understanding the dynamic behaviors and corresponding vibration features of a gear system.
Research status
At present time, the work on gear pitting dynamic model is focused on two aspects: calculation of time-varying mesh stiffness (TVMS) and dynamic model. 3 Many scholars have studied the relationship between TVMS and dynamic response at present, which focused on more accurately reflecting the characteristics of fault to illustrate the dynamic model. Gelman et al. 4 generate circular pits along the pitch line of a single gear tooth to simulate pitting fault. Ma et al. 5 studied by comparing the TVMS under different rectangle pitting widths, lengths, and locations with that obtained from the finite element method (FEM). Chaari F et al. 6 modeled pitting as a rectangular indentation and studied the effects of the spalling damage on the gear mesh stiffness. The influence of pitting on gear TVMS and spectrum characteristics of vibration response are studied. Liang et al. 7 focused on the influence of different pitting levels and the TVMS. Liu et al. 8 established the probability distribution model of gear TVMS combining image processing, which improves the accuracy of the calculation. Meng et al. 9 investigated the vibration of a spur gear pair in the presence of tooth root crack and spalling by analytically defining the gear mesh stiffness. Considering the irregularly shape surface pitting, the previous research mainly studied the TVMS but only consider a single pit,4–7 which may lose some important signal characteristics and not be sufficient for comprehensive analysis. Research 8 considered the evolution characteristics of tooth pitting but the essential calculation process still adopted the traditional method. Although the mesh stiffness of complex pitting area is more accurate, the calculation process is time-consuming. Furthermore, the analysis of geometric characteristics is essential in traditional calculation of mesh stiffness,10,11 especially in different pitting shapes.12–14
Several studies have examined the analytical model of dynamic response of spur gear with pitting. Yang 15 proposed a new dynamic model to simulate the vibration behaviors of a spur gear transmission with pitting and spalling defects, which considered the effect of gearbox and the experimental validation was performed. Yi 16 studied the nonlinear frequency responses of the geared rotor system with tooth tip chipped and several commonly used statistical indicators are applied to assess the system vibration behaviors. Tiancheng 17 developed a dynamic model of 8-degree-of-freedom spur gear pair under ideal conditions, which considered pitting-crack coupling but lack of experimental verification. I. Dadon18,19 developed a realistic dynamic model for pitting diagnosis, and the effect of pitting on response is represented by the lack of stiffness. Although many dynamic modeling methods have been investigated, the modeling ideas are generally consistent, that is the responses are affected by the change in the TVMS curve. A key problem ignored by many scholars is that the calculation process of TVMS is a process of transforming the surface pitting problem from three dimensions to two dimensions, which will lead to errors due to huge calculations.
Pitting gear vibration signals often show nonstationary characteristics as gears are always affected by the nonlinear impact. Although traditional signal processing methods such as the time-domain method have been well applied,20–23 these methods are not effective in small pitting states. Loutridis 24 presented a method for monitoring the evolution of gear faults based on the newly developed empirical mode decomposition (EMD) scheme, which can be utilized for system failure prediction. Parey 25 modeled a 6-degree-of-freedom gear dynamic model including localized tooth crack defect and decomposed a signal into some individual, monocomponent signals signal by the Hilbert–Huang transform (HHT) method. The EMD method could be applied to nonlinear and nonstationary signal processing perfectly because of the self-adaptive ability.26–29
Main work of this paper
In this paper, a dynamic model with pitting based on image processing is proposed, on this foundation, the healthy surface area is modeled as springs and pitting area is modeled as weak springs. The revised mesh stiffness is calculated and a new mesh stiffness calculation method with surface pitting is proposed, and the correctness of the method is proved. Furthermore, the dynamic model is validated by experimental data, and the HHT method has been applied for the detection of the vibration signals with small pitting area in gear system. The statistical indicators are induced and the Hilbert energy spectrum is obtained based on HHT. The detailed structure of this paper is shown in Figure 1.
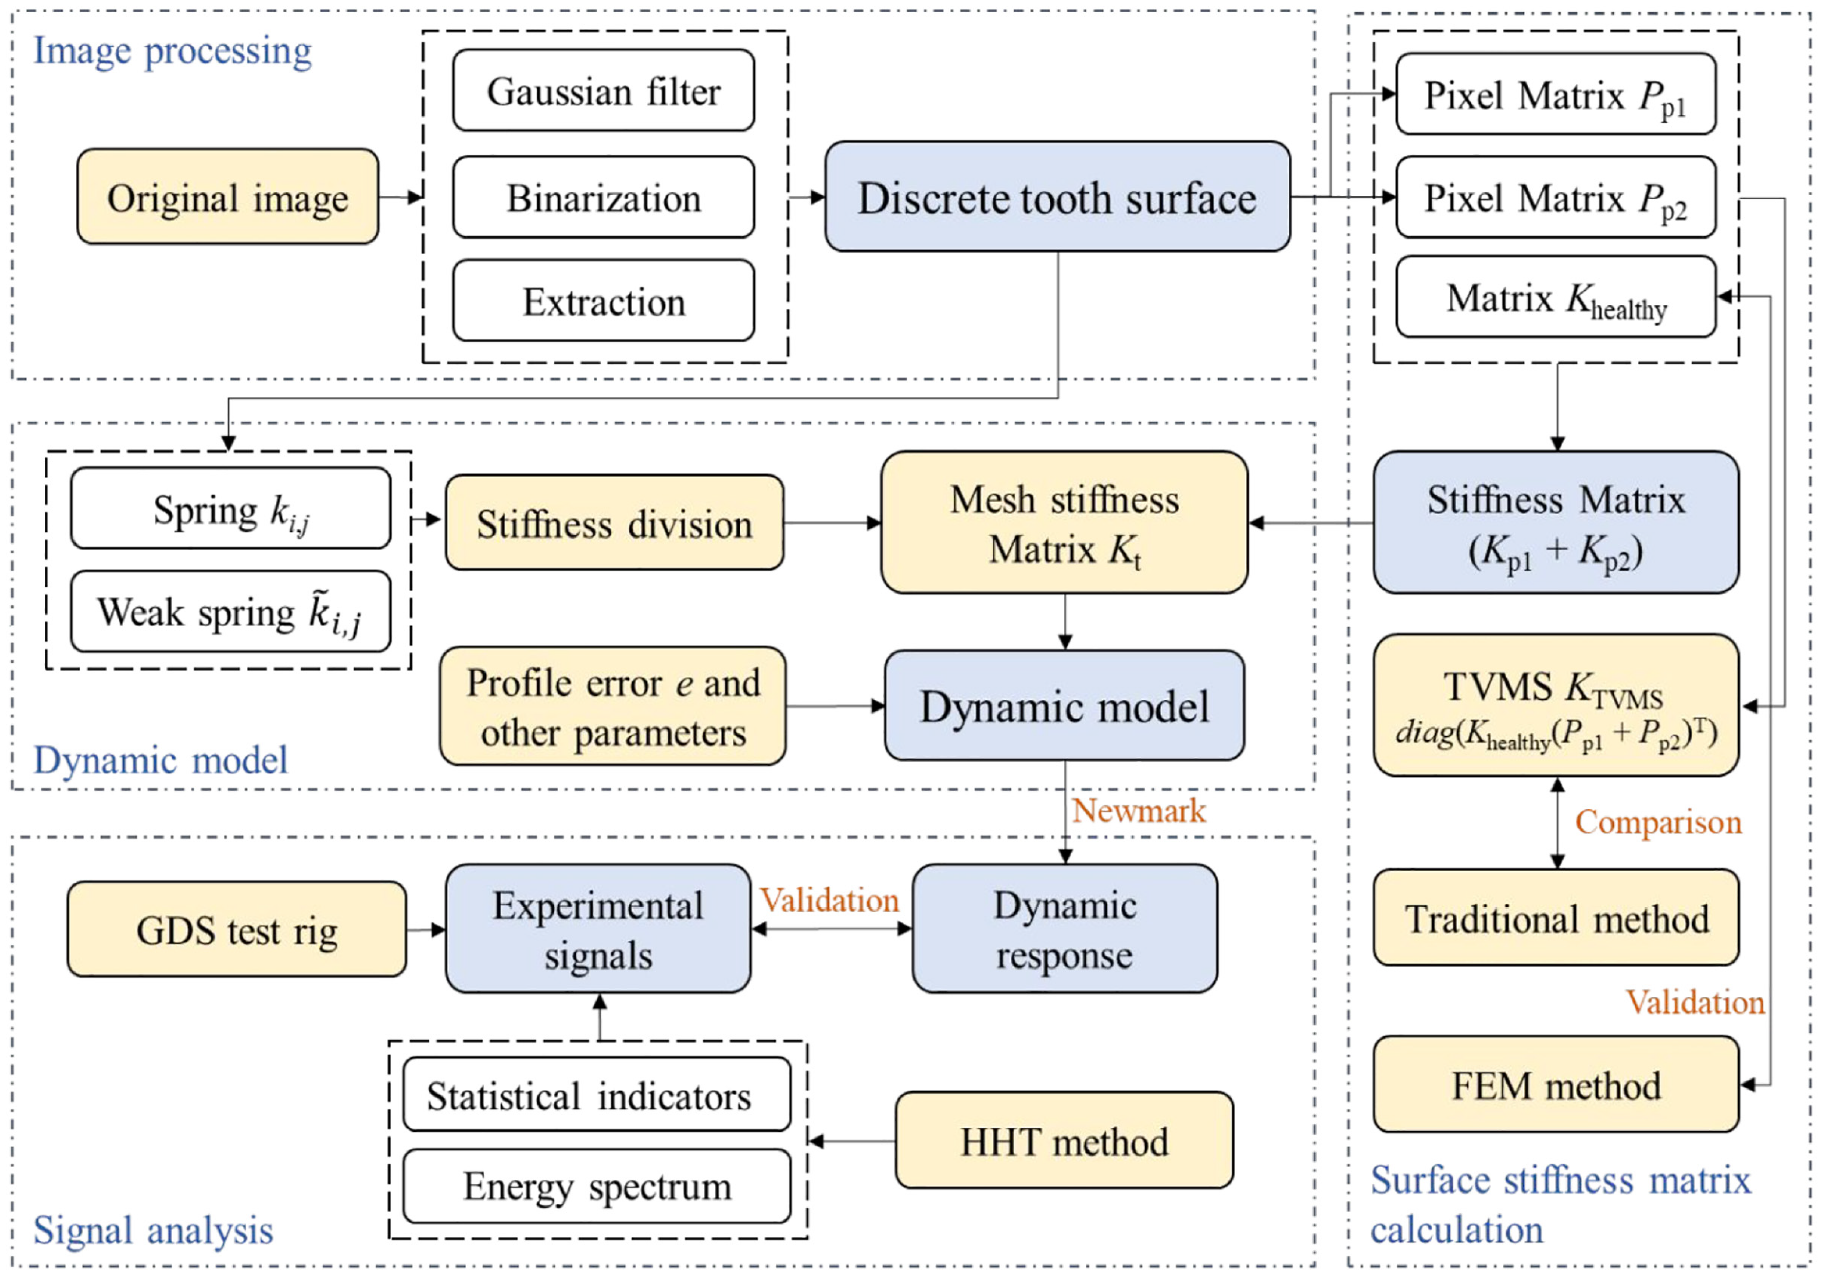
The structure schematic of this paper.
The practical significance of this research is that the dynamic response of pitting gear is directly solved by the surface spring stiffness matrix based on image processing, and the proposed model is specially for surface pitting with arbitrary shapes. The meshing process of pitting gears need not be analyzed separately, the calculation amount is reduced and the analysis process is simplified. Compared with the time-varying of traditional stiffness, 8 the calculation method in this paper focuses on the distribution of stiffness to replace the TVMS and the calculation efficiency is greatly improved.
Establishment of dynamic model with pitting defect based on image processing
The extraction process of tooth surface pitting and tooth stiffness model along the contact lines is described in this section. Furthermore, the dynamic model of gear system is presented.
Modeling of the tooth stiffness in the presence of pitting based on image processing
Tooth surface pitting is introduced on a single tooth in pinion as shown in Figure 2(a). In consideration of studying the influence of different pitting degrees and the convenience of subsequent experiments, surface pitting is created near the pitch line of gear tooth by drill. After smoothing by Gaussian filtering in Figure 2(b), the gradient operator is used to extract the pitting characteristics of tooth surface based on OPENCV. Figure 2(d) shows the binary image of surface pitting M (x, y) can be described as

Therefore, the tooth surface is discretized by pixels and the pitting features are extracted through image processing in Figure 2(e), and the image is composed of m × n pixels.
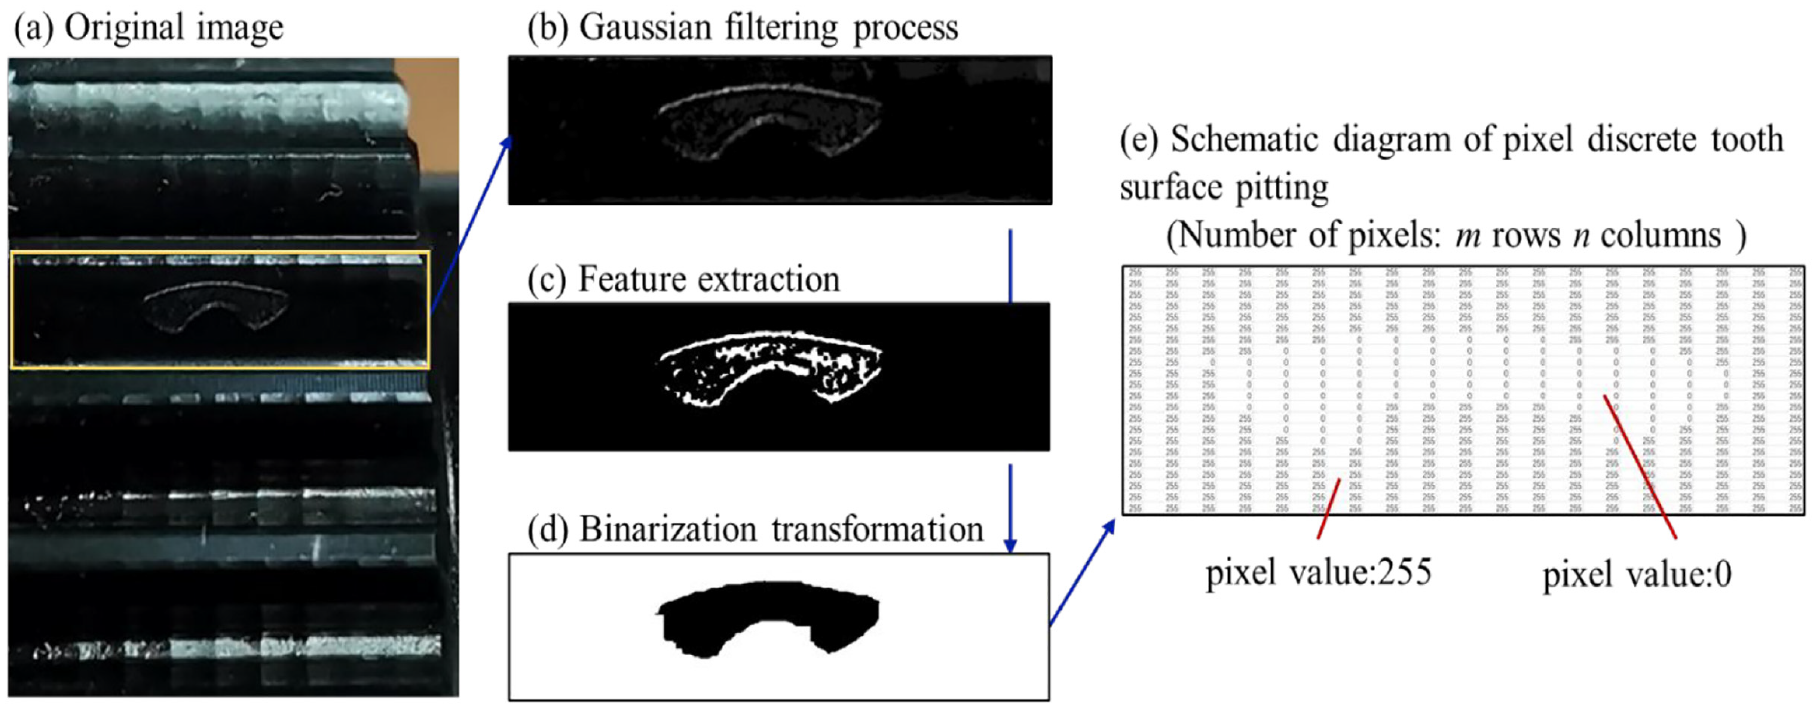
The extraction process of tooth surface pitting.
After the discretization of the tooth surface based on image processing, the mesh stiffness at any position on the tooth surface can be easily represented by pixels and the values of mesh stiffness along the contact line can be regarded as the sum of stiffness values of different pixels.
From Figure 3(b) and (c), it can be obtained that the contact plane is discretized into a set of pixel points, and a network of linear springs in parallel is used to model the contact points. The contact points of the healthy area are modeled as springs and the contact points of pitting area are modeled as weak springs. Therefore, the contact stiffness of pitting area will not be considered.
The stiffness of weak springs
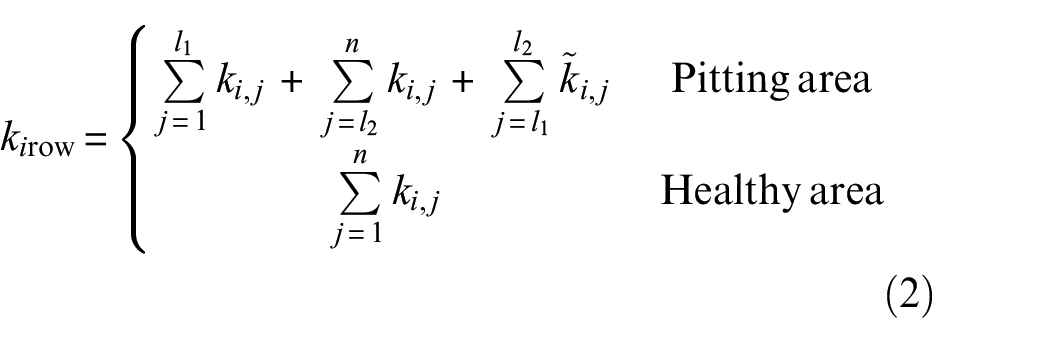
where m and n are pixel numbers along tooth profile and width direction as shown in Figure 3(b). i and j are, respectively, the coordinate points along tooth profile and width direction (i = 1,…, m, j = 1, …, n). The position of i is related to the angular displacement of pinion. l1 and l2 are, respectively, the distance from the pitting area boundary to the profile as shown in Figure 3(b).
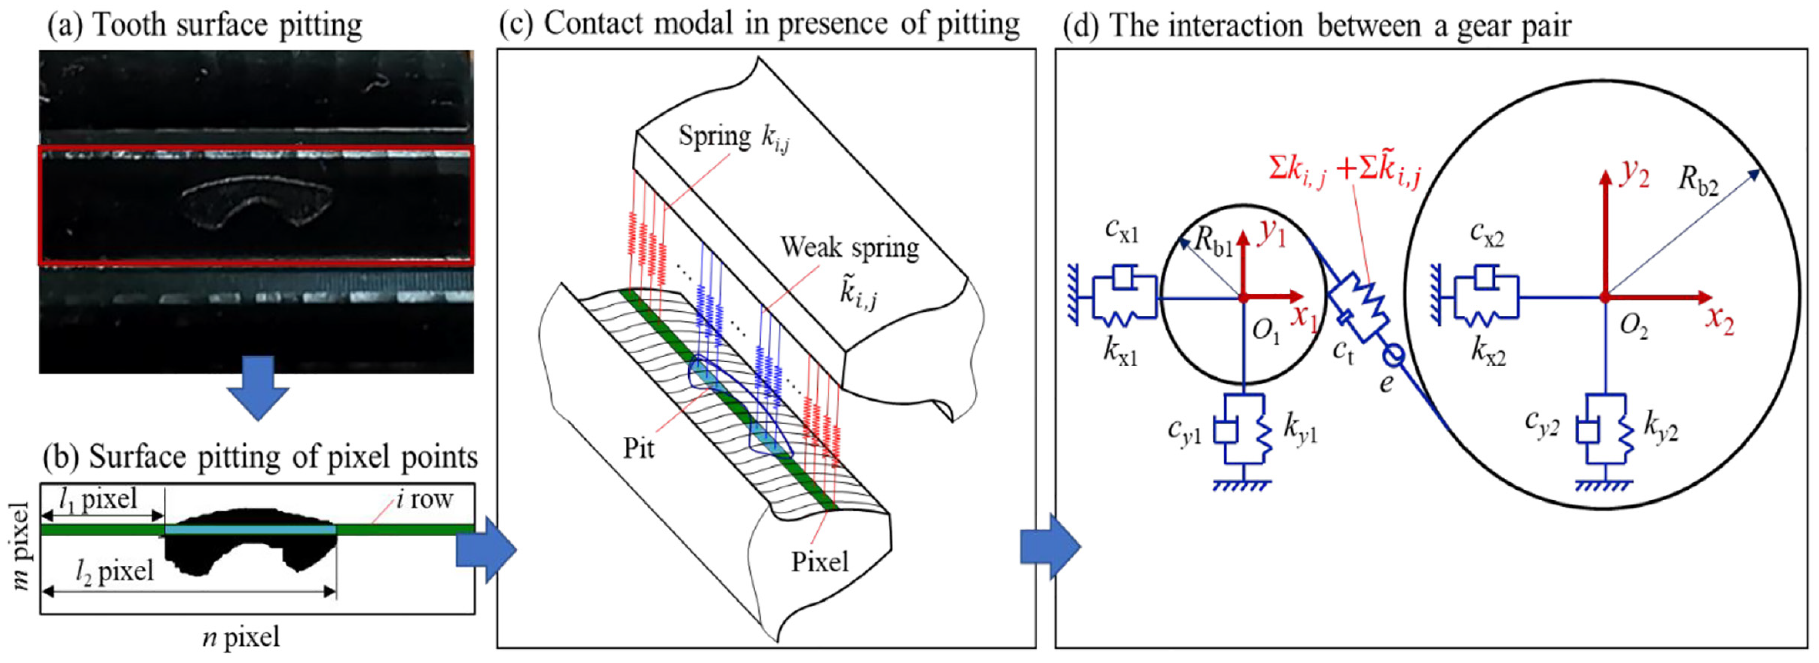
Modeling of contact tooth based on image processing.
Therefore, the mesh stiffness at any position and the values of stiffness along the contact line can be accurately calculated combined with image processing. The interaction between a gear pair is shown in Figure 3(d), in which the contact area is discretized by pixel points and the mesh stiffness can be described by pixel stiffness
Dynamic model of the gear system with pitting defect based on image processing
The gear system model consists of a spur gear pair, motor, two shafts, load, bearings, and two couplings. It is assumed the lubrication is ideal and the two shafts were assumed to be of finite torsional stiffness and infinite bending stiffness. The interaction between teeth meshing was modeled as shown in Section “Modeling of the tooth stiffness in the presence of pitting based on image processing.” A dynamic model of one spur gear pair including localized tooth pitting has been developed according to the stress characteristics shown in Figure 4.
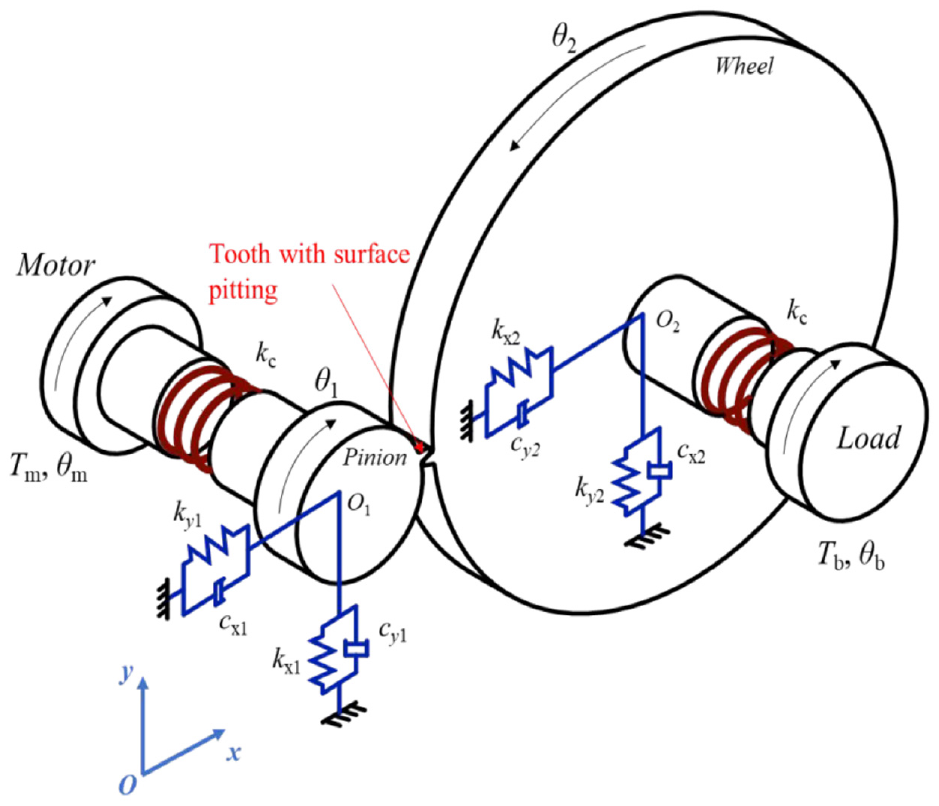
Dynamic model of the gear system with surface pitting.
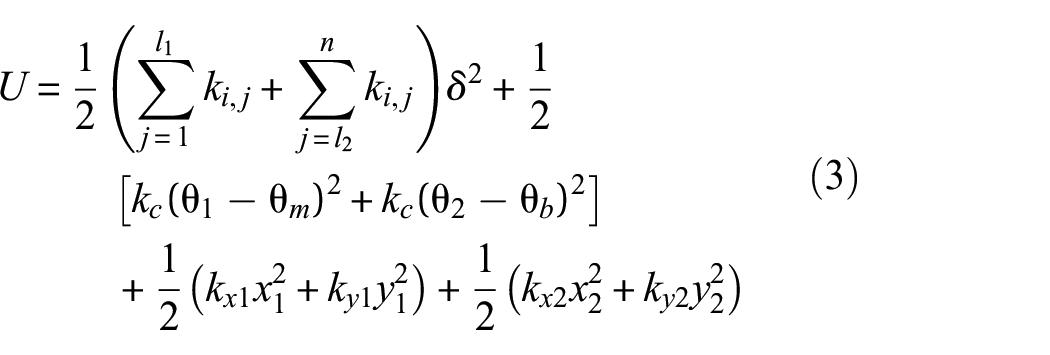
Potential energy related to meshing gears can be deduced from stiffness along each contact line:
The kinetic energy can be expressed as
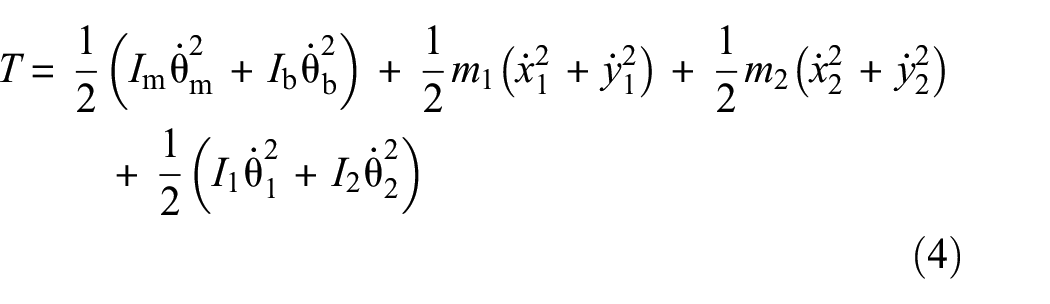
where m1 and m2 are the mass of the pinion and wheel. y1 and y2 are the vertical displacements of the pinion and wheel, respectively. θ1, θ2, θm, and θb are the angular displacements of the pinion, wheel, motor, and load, respectively. Tm and Tb are the moments of pinion and wheel, respectively. I1, I2, Im, and Ib are the mass moments of inertia of the pinion, wheel, motor, and load, respectively. Rb1 and Rb2 are the radius of the base circle of the pinion and wheel, respectively. φ indicates the pressure angle.
According to Lagrange equations for nonconservative systems, the general form of the dynamic equation is

where Fext is the excitation force vector that produced by input and output torques and profile error.
18
The profile error is defined as the deviation of the actual tooth profile and the ideal profile. Vector n is a generalized coordinate and M is a diagonal mass matrix. Kt is a structural stiffness matrix with pitting composed of spring stiffness ki, j and weak spring stiffness

where K1 represents the partial spring stiffness matrix, K2 represents the complementary spring stiffness matrix, and K3 represents the weak spring stiffness caused by pitting. C is a damping matrix, which can be obtained by the damping ratio ζ. All the matrix n, M, C, Fext, K1, K2K3, and parameters ζ are given in Appendix A.
Here, e is the tooth profile errors considered in this work. The value of the profile error depends on the gear precision grade.
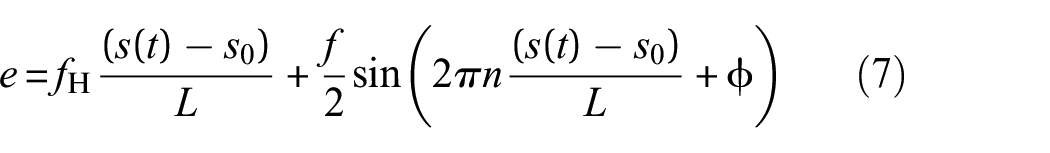
where fH and f are the profile angle deviation and the profile form deviation, respectively. s indicates the radius of the contact point. n represents the number of sinusoid cycles along the functional profile length and ϕ is the phase component of the sinusoidal term. The detail and derivation can be obtained in Mucchi et al. 30
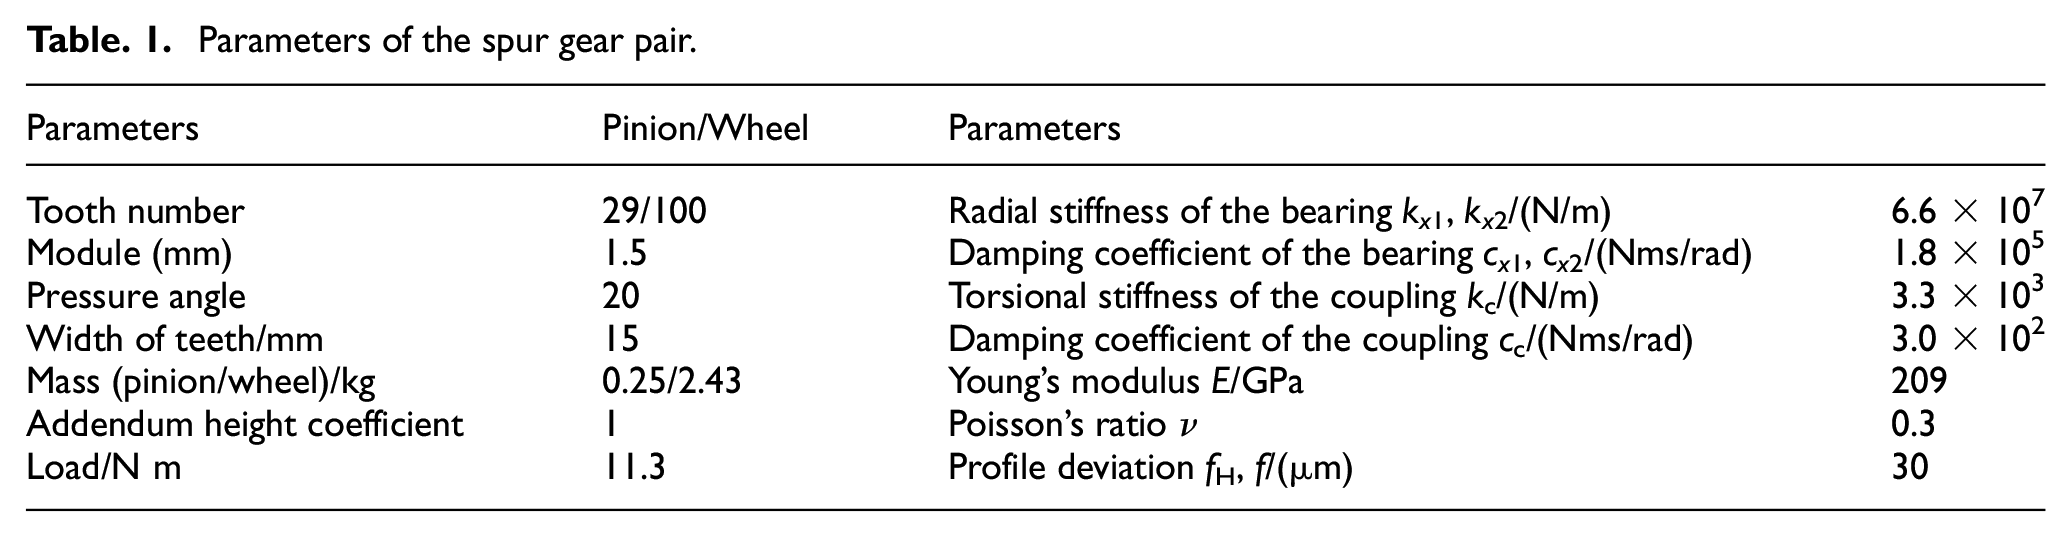
The numerical parameters of the gear system are given in Table 1, and the stiffnesses and the damping coefficients can obtained from Kisssoft.
Parameters of the spur gear pair.
Calculation of gear mesh stiffness with pitting based on image processing
Stiffness calculation and verification
The stiffness of healthy gear is the basis of stiffness distribution in this paper and the revised energy method 31 is used in this section. The gear tooth is modeled as a nonuniform cantilever beam,32–34 as shown in Figure 5. As shown in Figure 3, a1 denotes the operating pressure angle, a2 denotes the half tooth angle of the pinion. The total potential energy is composed of the Hertzian contact energy Uh, bending energy Ub, shear energy Us, axial compressive energy Ua, and fillet foundation energy Uf. These five energies can be written as follows based on mechanics of elastic solids:
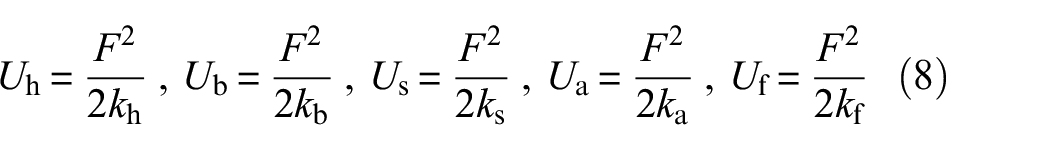
where F is the resultant force of gear meshing on the contact patch of the engaged tooth pair and k denotes the stiffness in meshing. The tooth stiffness km consists of the bending stiffness kb, shear stiffness ks, and axial compressive stiffness ka, respectively.
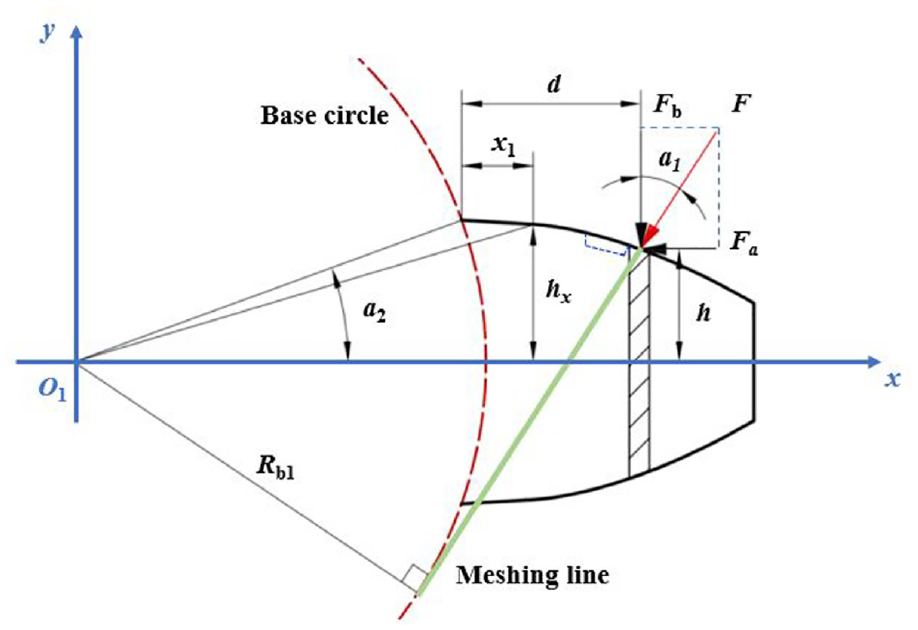
Nonuniform cantilever beam model of the tooth with pitting.
To conveniently calculate the stiffness, angular displacement notation is adopted. 35 According to the characteristics of the involute and transition curve the bending stiffness kb, shear stiffness ks and axial compressive stiffness ka can be expressed as
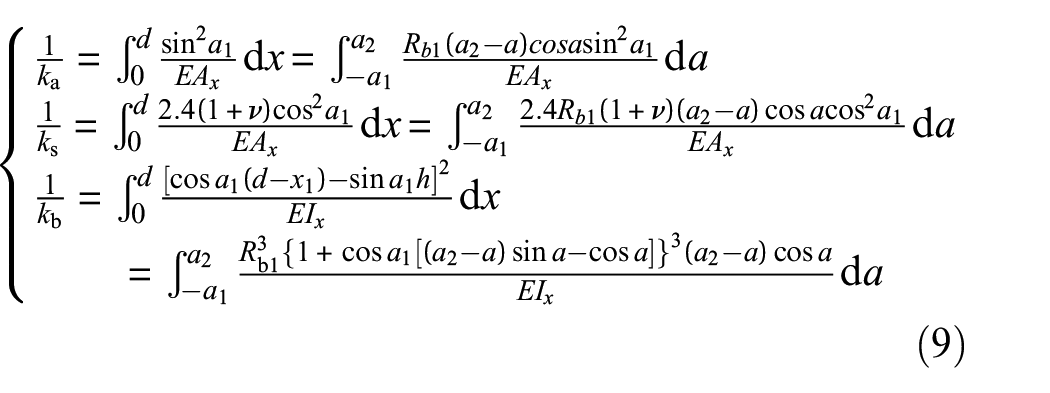
where L, E, and ν are tooth width, Young’s modulus, and the Poisson’ ratio, respectively. Ix and Ax indicate the area moment of inertia and the area of the section. Besides, fillet foundation stiffness kf can be expressed as
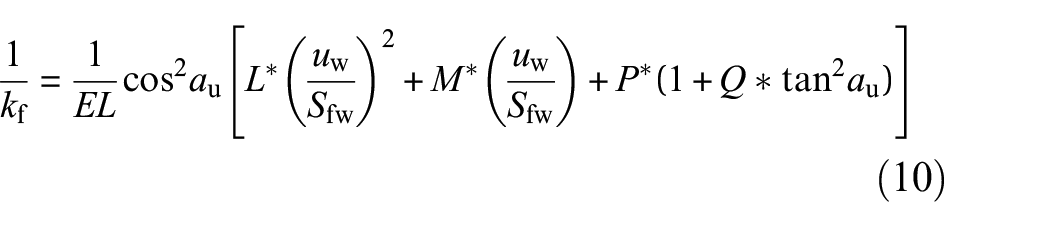
where au, uw, Sfw, L*, M* and Q* can be found in Yang and Shi. 36
Generally, the Hertzian contact stiffness in gears is nonlinear, it is related to the nonlinear contact force. The local contact stiffness kh can be expressed as Ma and Zeng. 31
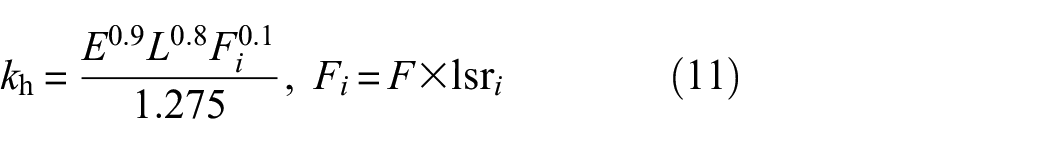
where Fi denotes the meshing force and lsr i is the load sharing ratio. A revised analytical model 5 modeled the stiffness as springs connected in parallel and the mesh stiffness km at the meshing point is
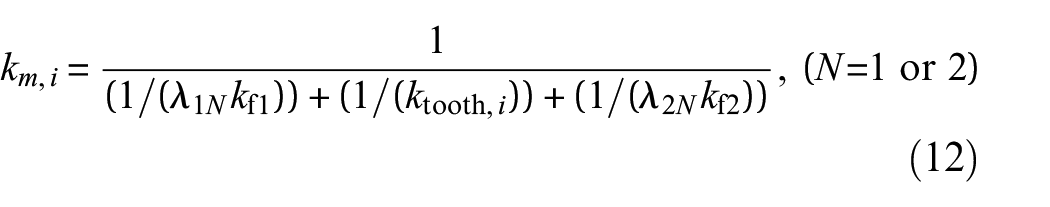

where j is the number of contact points, kf1 and kf2 denote the fillet foundation stiffness of the pinion and wheel. λ1N and λ2N are the correction coefficients which are detailed in Meltzer and Dien 26 (Figure 6).
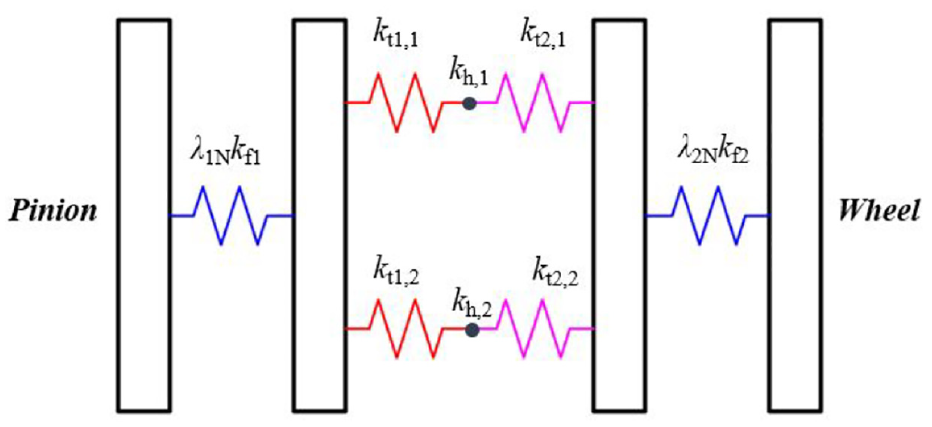
Revised mesh stiffness analytical model.
A finite element model using Solid185 elements is established to calculate the TVMS, as is shown in Figure 7. Considering the computational efficiency, only three teeth are established and other teeth are assumed to have no effect on the mesh stiffness. Due to the gear deformation, the TVMS can be calculated by the rotational displacement of the master node of pinion. The comparison between finite element model and theoretical results is shown in Figure 8.
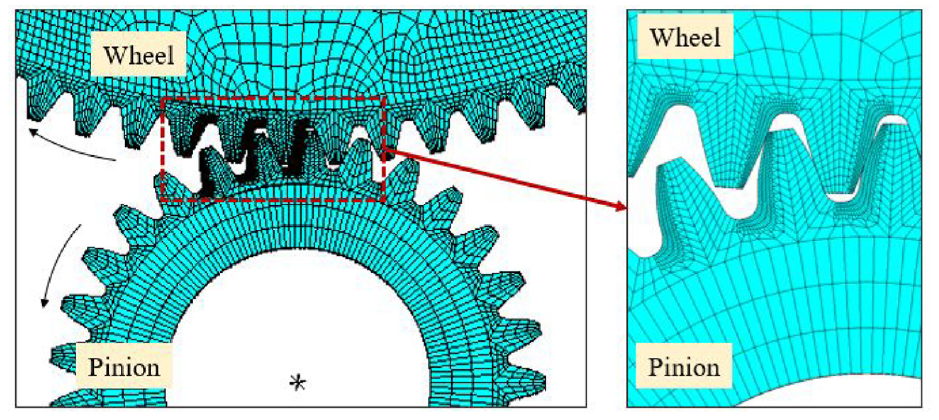
Finite element model of meshing gears.
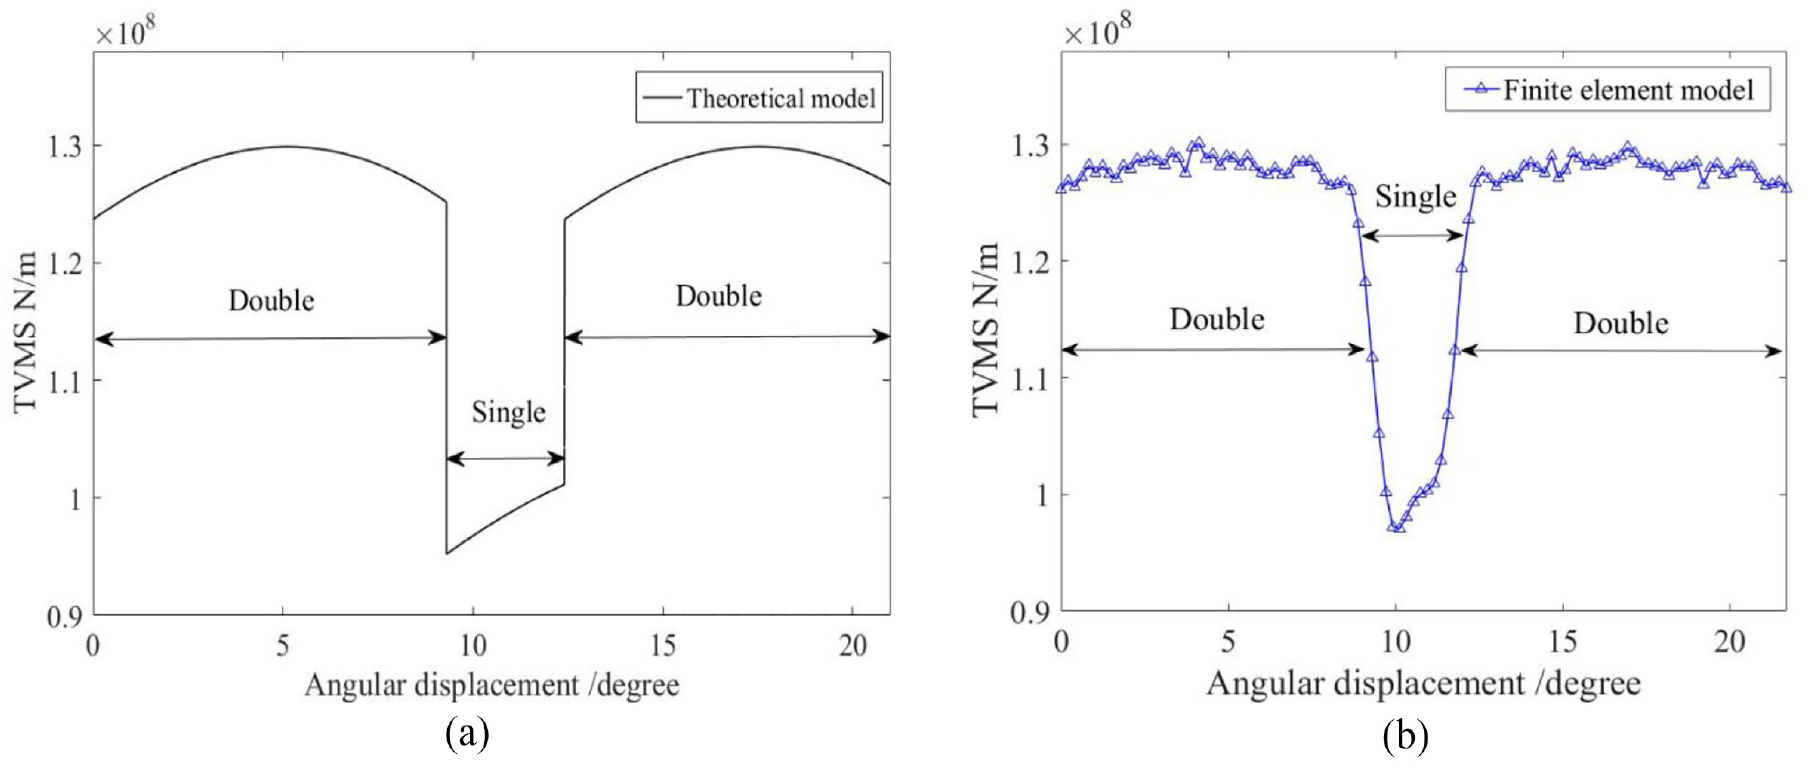
TVMS of healthy gear: (a) theoretical model and (b) finite element model.
The distribution of surface spring stiffness under different pitting states
The previous section has shown that the feature of surface pitting could be extracted combined with OPENCV based on the image processing technology and the TVMS has been calculated by energy method. This section takes the experimental gear as the research object (Figure 9) to calculate the TVMS with surface pitting.
The state of tooth surface pitting is expressed by the ratio of pitting area to tooth surface area. It is shown in Figure 9 that there are three kinds of surface pitting in different states (15% pitting, 20% pitting, and 25% pitting) on the tooth surface. The healthy surface and irregular shape pit in Figure 3 are also considered.
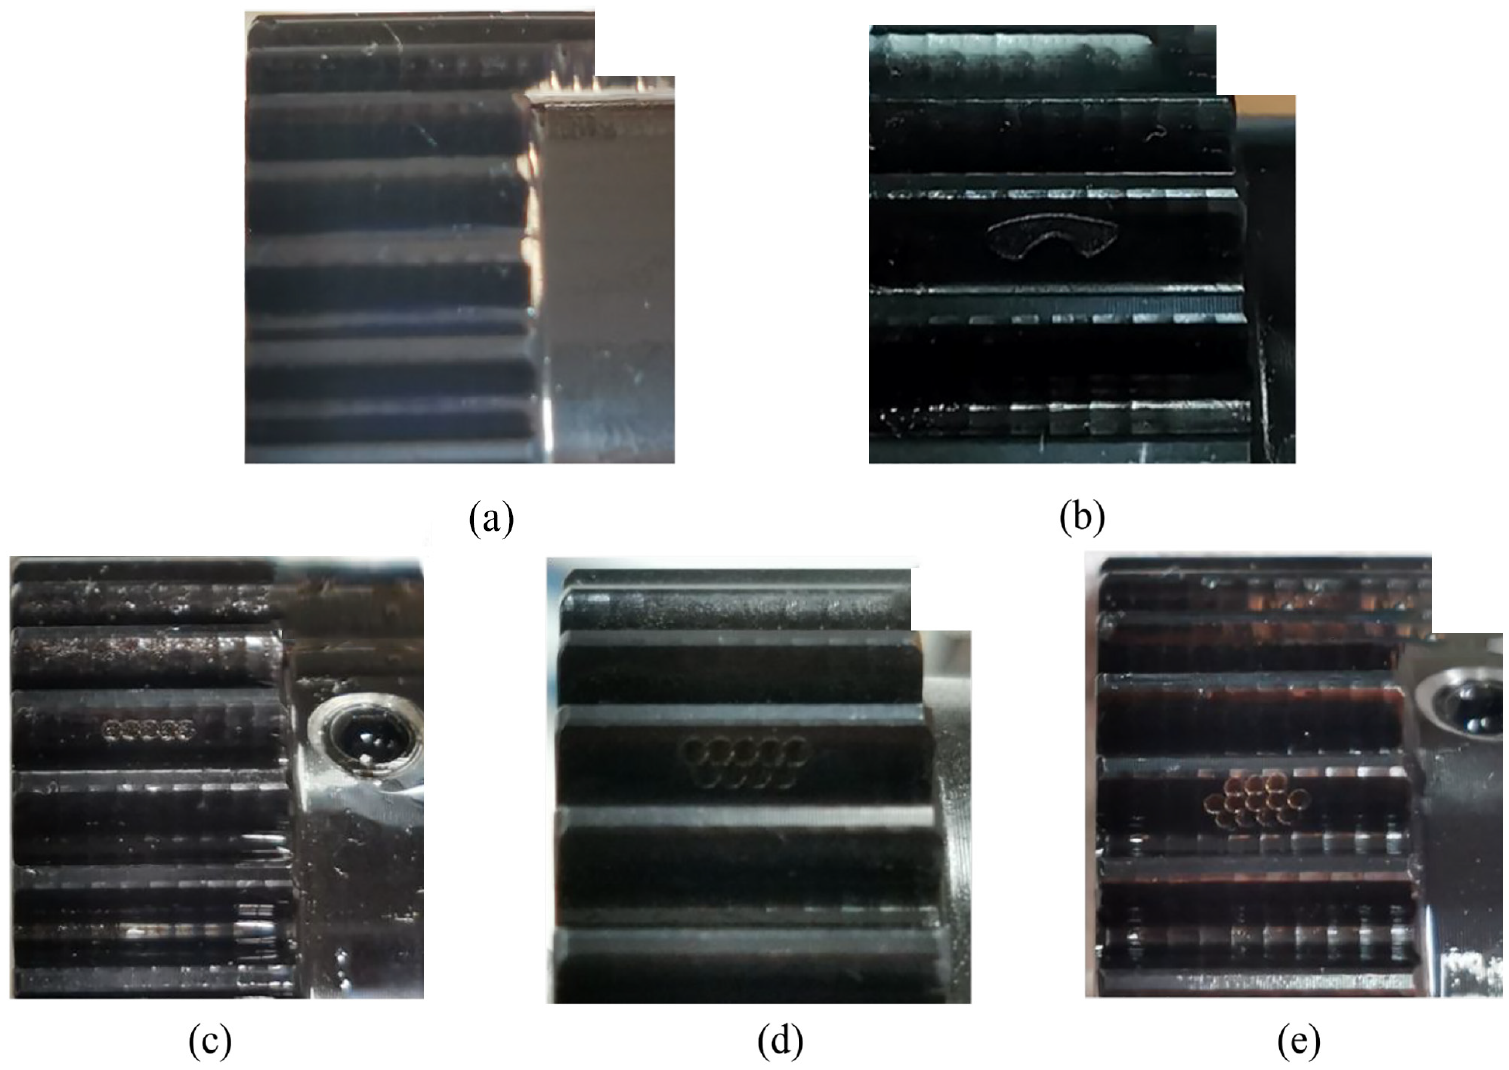
Gear with different pitting states: (a) healthy, (b) irregular shape pitting, (c) 15% pitting, (d) 20% pitting, and (e) 25% pitting.
A discretization of the tooth surface is performed in both length and width directions based on Section “Modeling of the tooth stiffness in the presence of pitting based on image processing.” (The discrete size of pitting surface is m = 219 pixels and n = 1000 pixels, the following Figures 10 –12 are scaled-down diagrams for convenience of understanding and analysis.) The TVMS of healthy gear can be discretized by pixels along the tooth width as shown in Figure 11(a). Taking irregular shape pitting as the analysis object, Figure 11(b) shows the diagram of pixel value distribution matrix Pp1 of tooth surface without pitting area. Furthermore, Figure 11(c) shows the diagram of pixel value distribution matrix Pp2 of pitting area and the surface pitting is modeled as weak springs according to Section “Modeling of the tooth stiffness in the presence of pitting based on image processing,” the values of pixels are calculated by the ratio rpit of the pitting stiffness kpitting and the healthy stiffness khealthy.
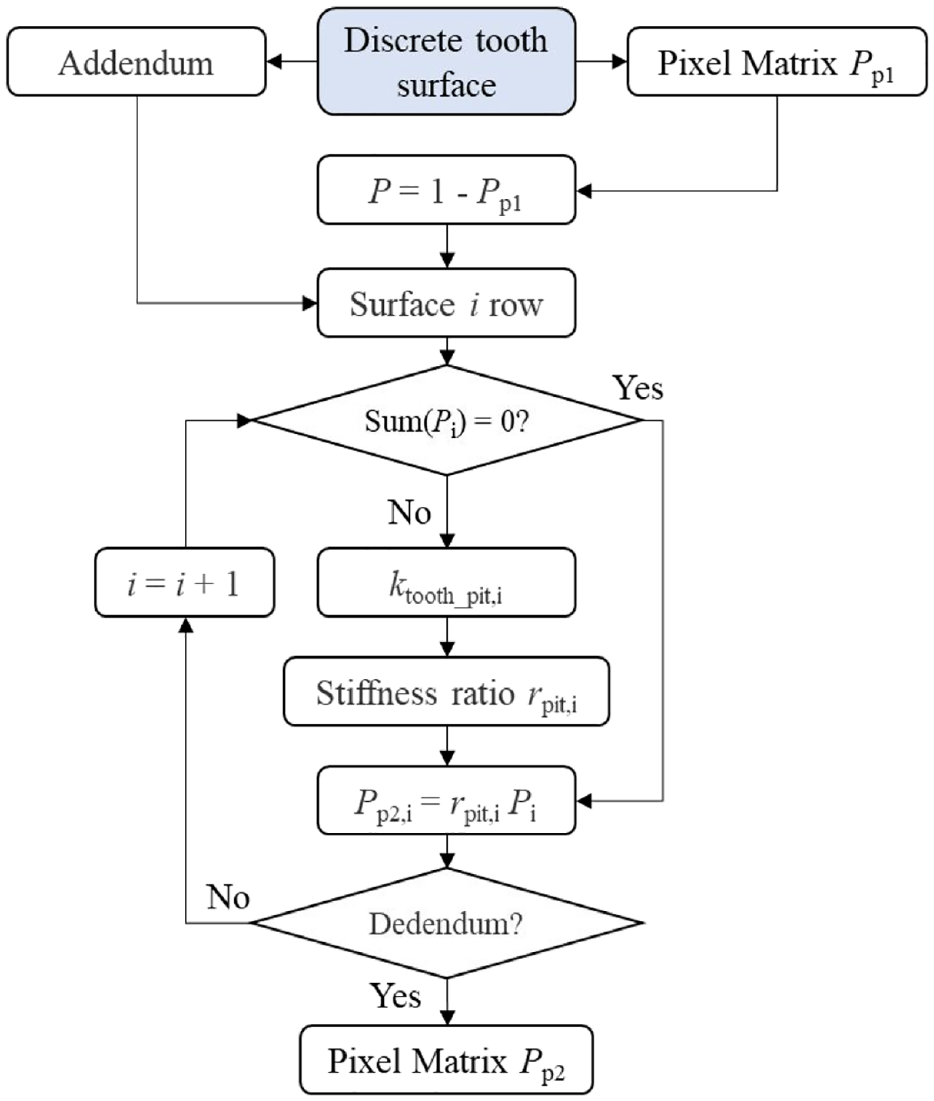
Diagram of stiffness distribution calculation process (irregular shape pitting).
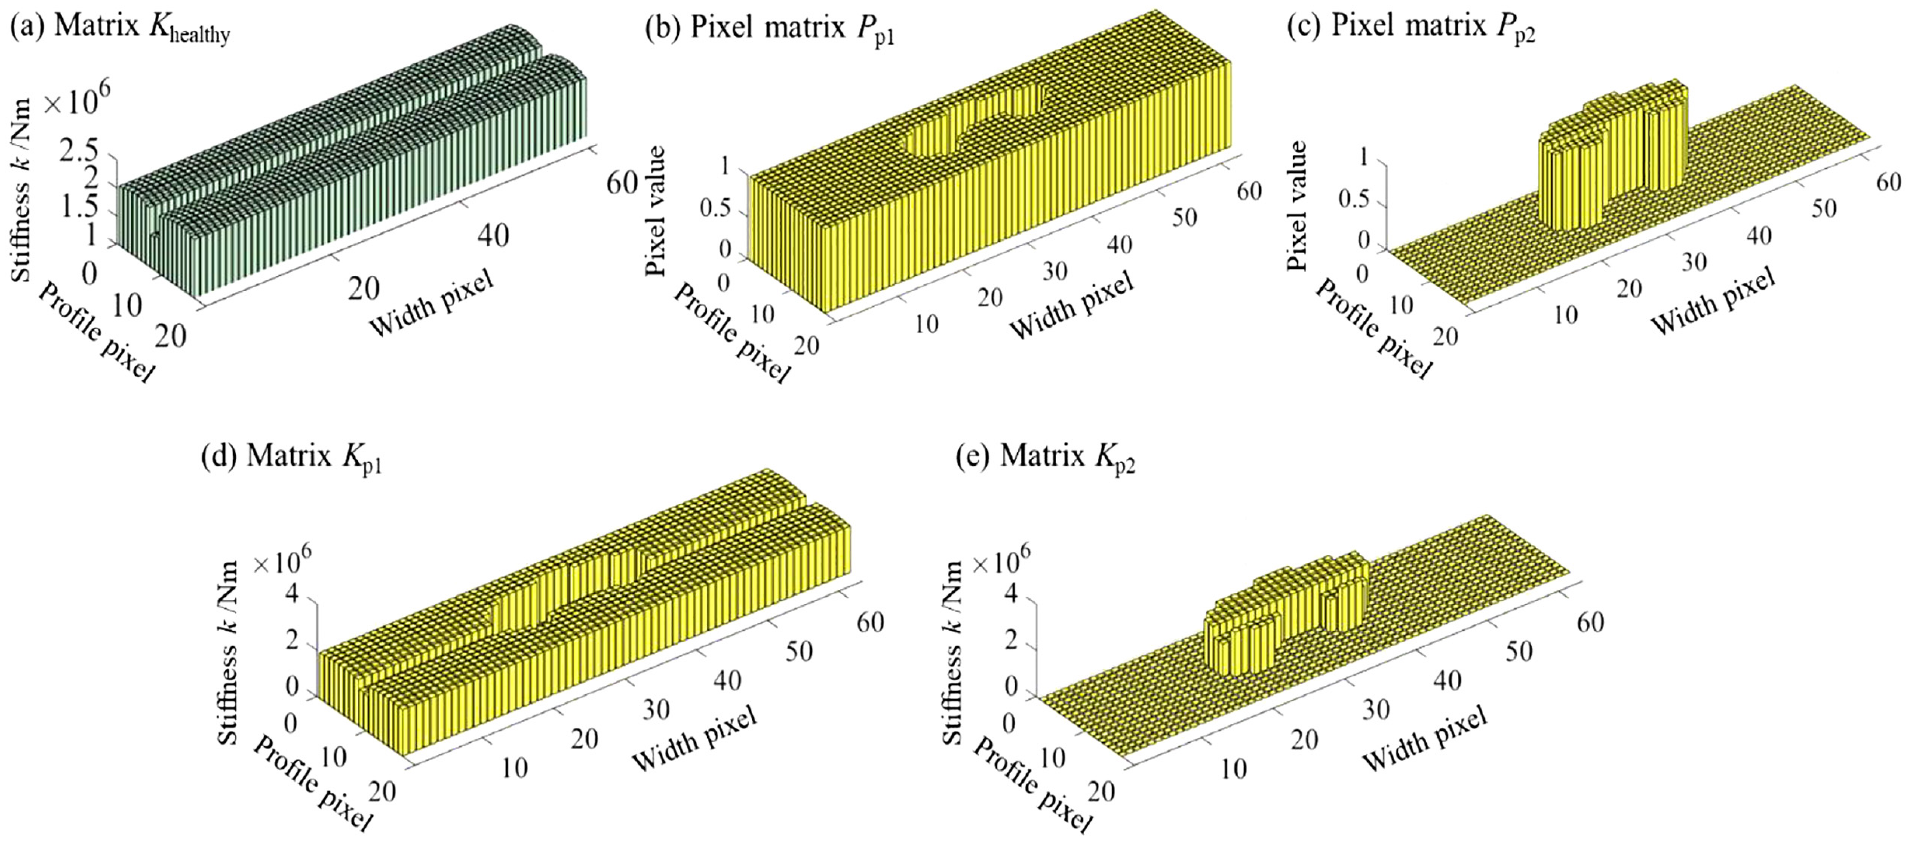
Diagram of distribution of stiffness with irregular shape pitting.
TVMS extraction.
It is worth noting that the pitting stiffness kpitting only includes bending stiffness kb_pit, shear stiffness ks_pit, axial compressive stiffness ka_pit, and fillet foundation stiffness kf. The calculation process of ktooth_pit can be found in Ma et al. 5
As a result, the values of pixel are related to Equation (9) change accordingly. The calculation process of pixel matrix Pp1 and Pp2 is shown in Figure 11. Therefore, the values of spring and weak spring stiffness (k and

where the matrix Kp1 represents the stiffness distribution of spring k and the matrix Kp2 represents the stiffness distribution of weak spring
Calculation process of pixel matrix.
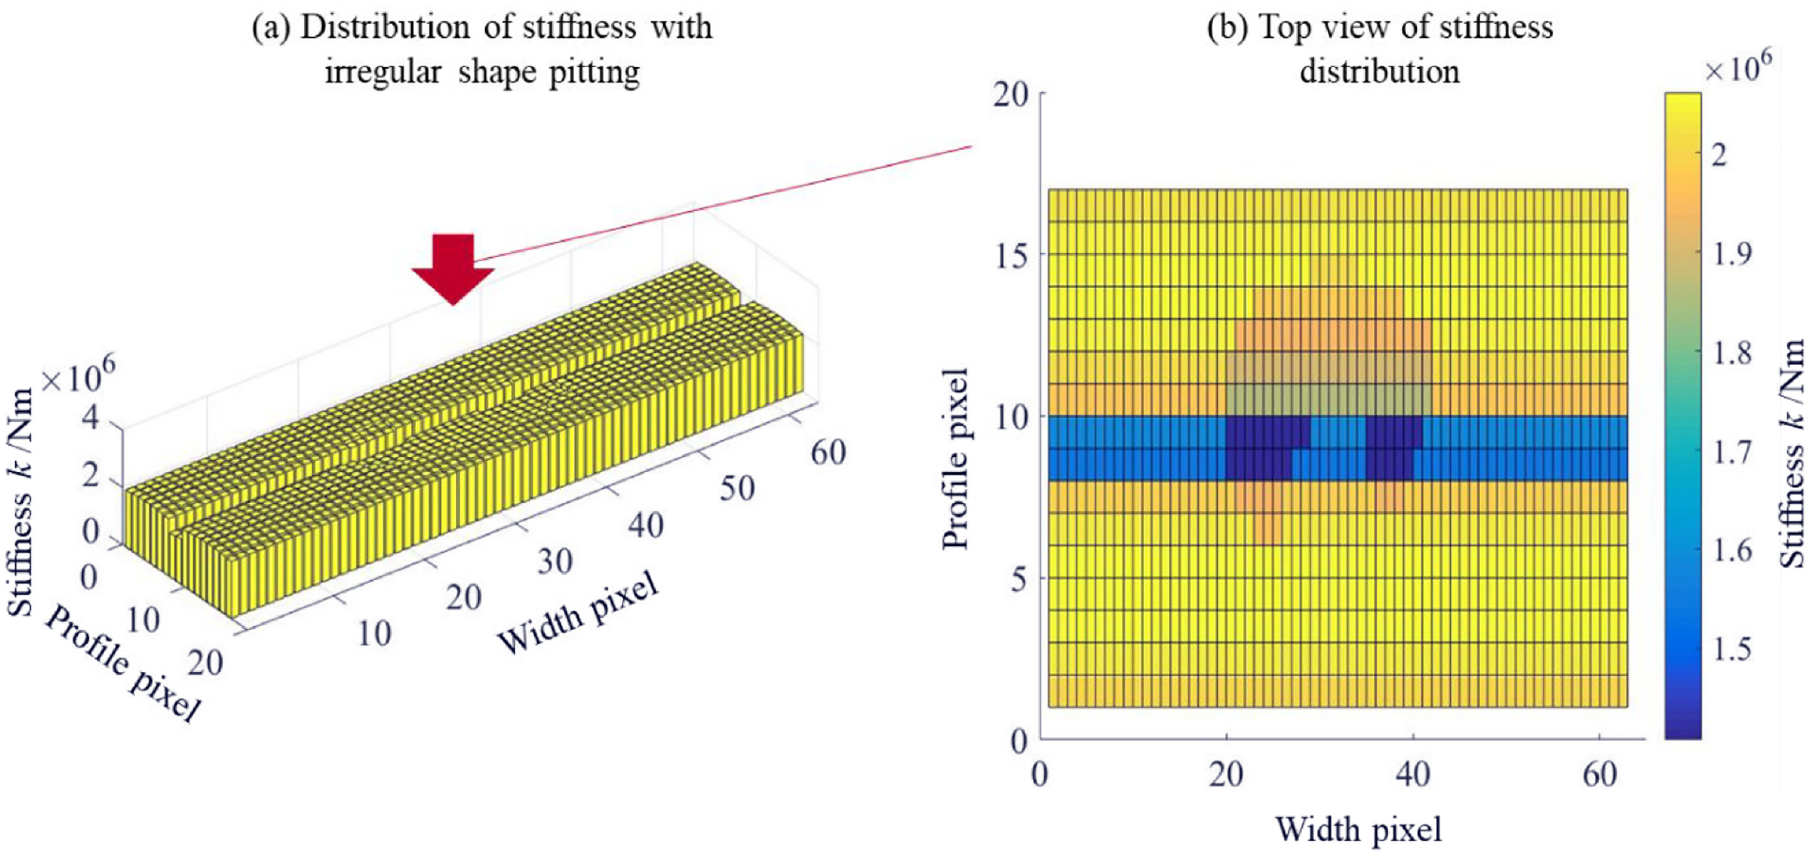
In the view of the above calculation, the pitting surface stiffness distribution can be obtained. Figure 12(a) presents the mesh stiffness matrix (Kp1 + Kp2) of the whole surface with irregular shape pitting in Figure 9(b). It can be found in Figure 12(b) that the stiffness characteristics of irregular shape pitting can be clearly displayed from the top view of distribution. It is worth noting that it takes less than 40 s to calculate the stiffness matrix of pitting surface based on the TVMS of healthy gear in one mesh cycle at a time.
The results in Figure 12 can be further used in the subsequent dynamic calculation, and the values of K1, K2, and K3 in Appendix. A can be determined. Therefore, the dynamic model based on image processing presented in Sections “Modeling of the tooth stiffness in the presence of pitting based on image processing” and “Dynamic model of the gear system with pitting defect based on image processing” is solved by the Newmark method.
Method comparison
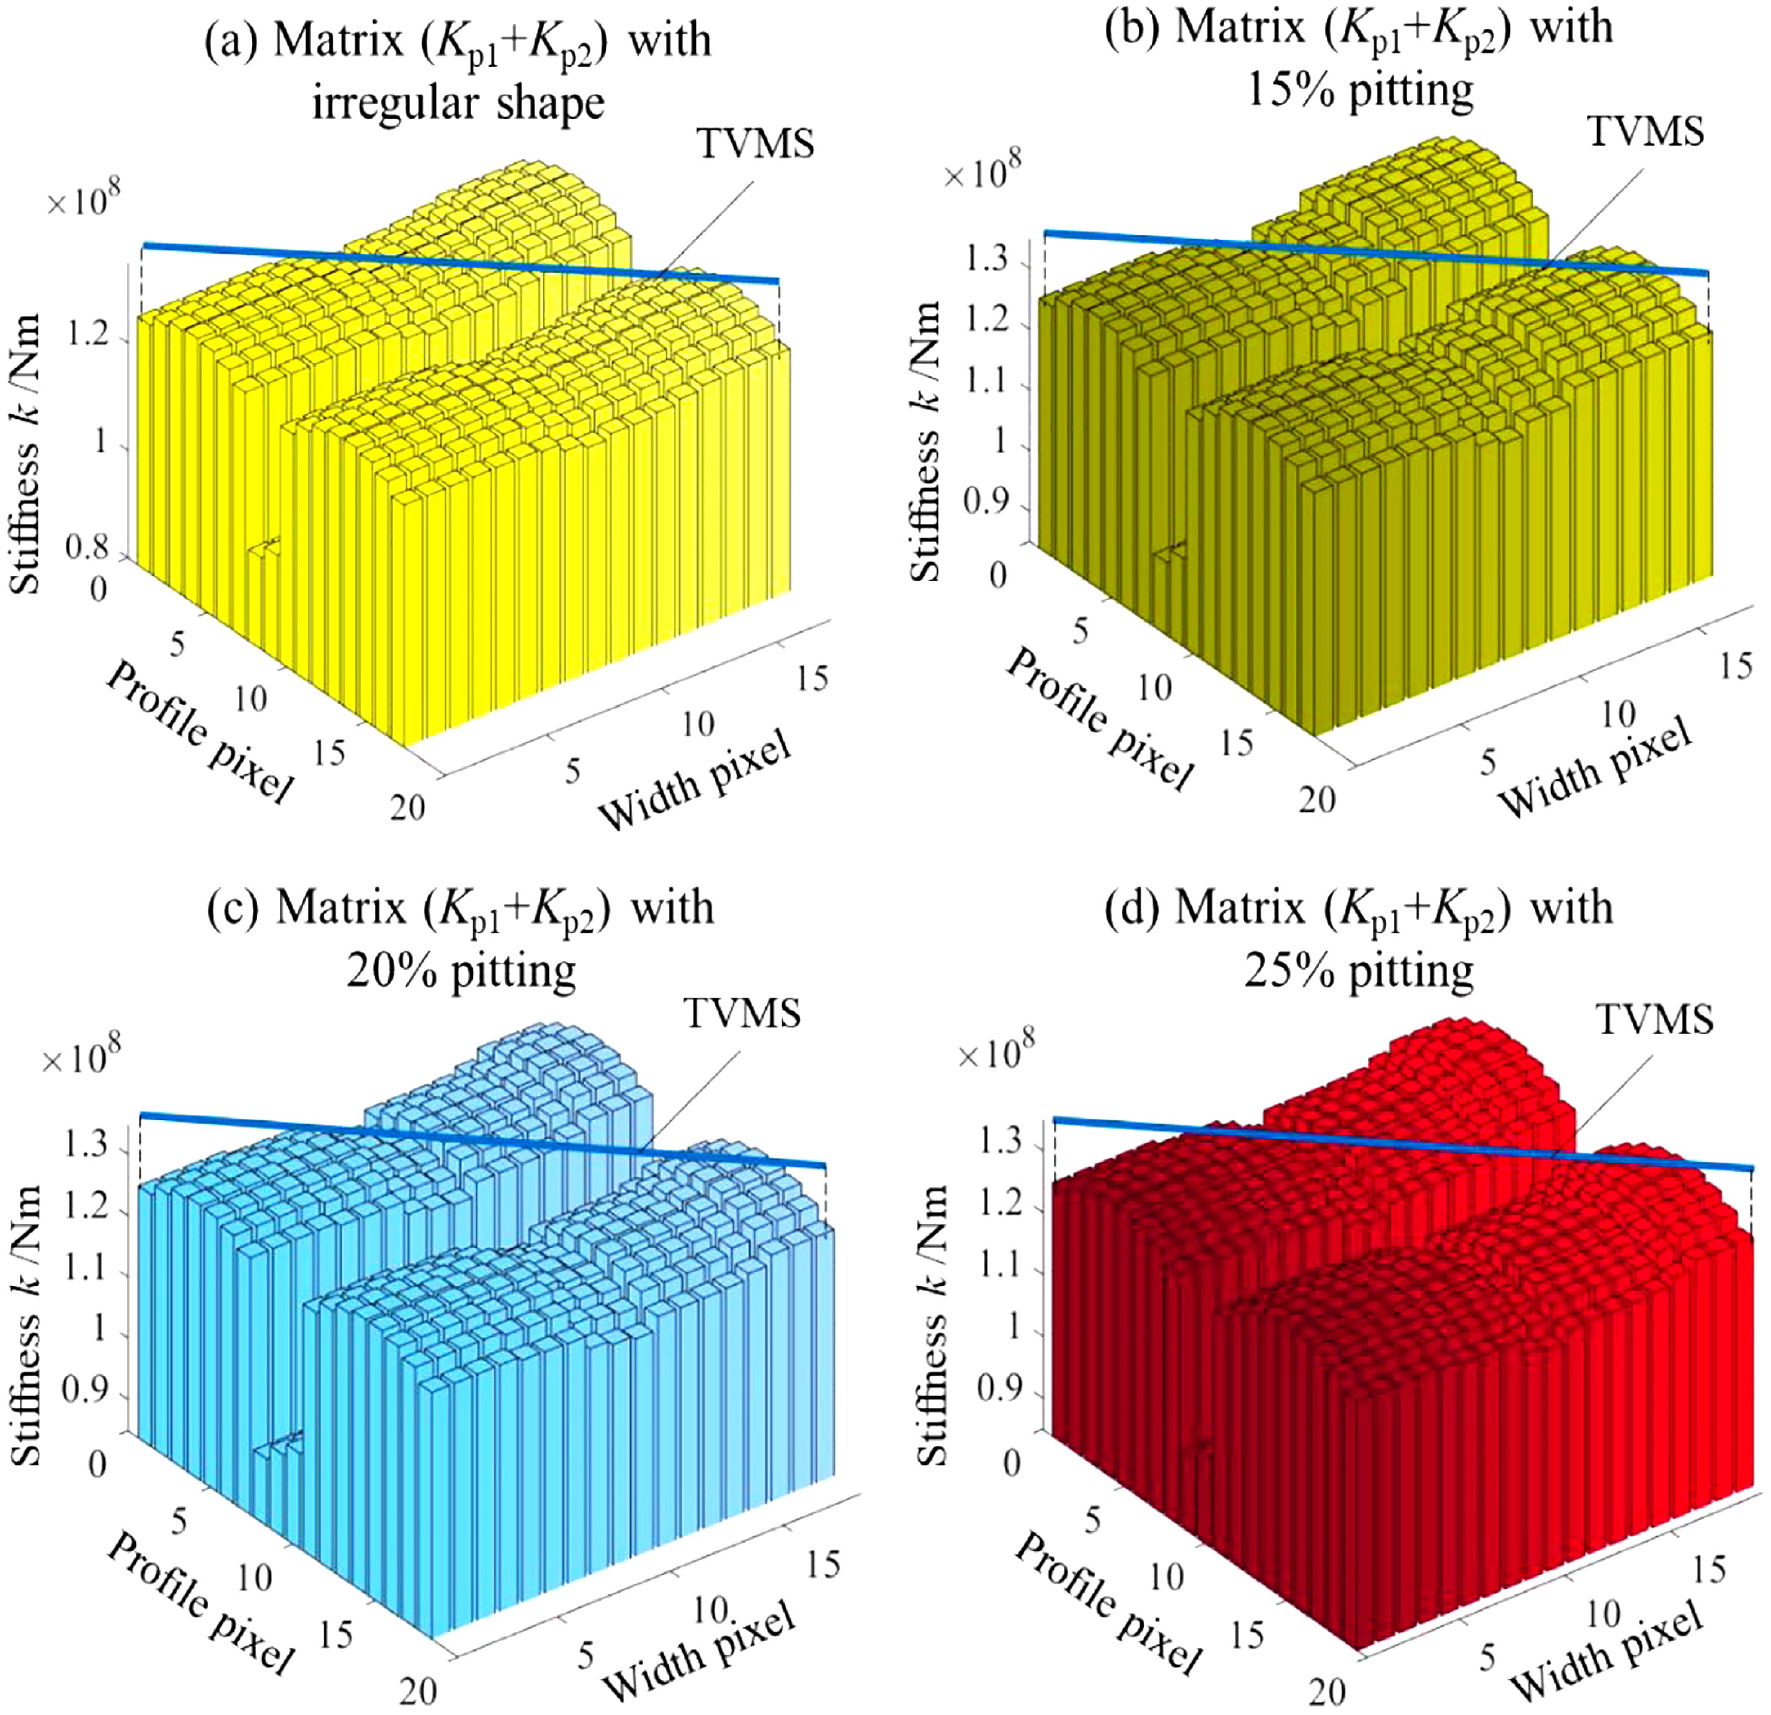
To verify the accuracy of the model, Section “Method comparison” proposes a method to calculate TVMS based on Section “The distribution of surface spring stiffness under different pitting states.” The TVMS matrix KTVMS can be expressed as

Furthermore, the TVMS matrix KTVMS with different pitting states as shown in the blue line in Figure 13.
Although it is no longer necessary to calculate the TVMS, the TVMS with different pitting states is calculated as shown in Figure 14 to verify the results. It can be found that the amplitude of variation of TVMS gradually increases with the evolution of pitting and extends from the single tooth meshing area to the double tooth meshing area.
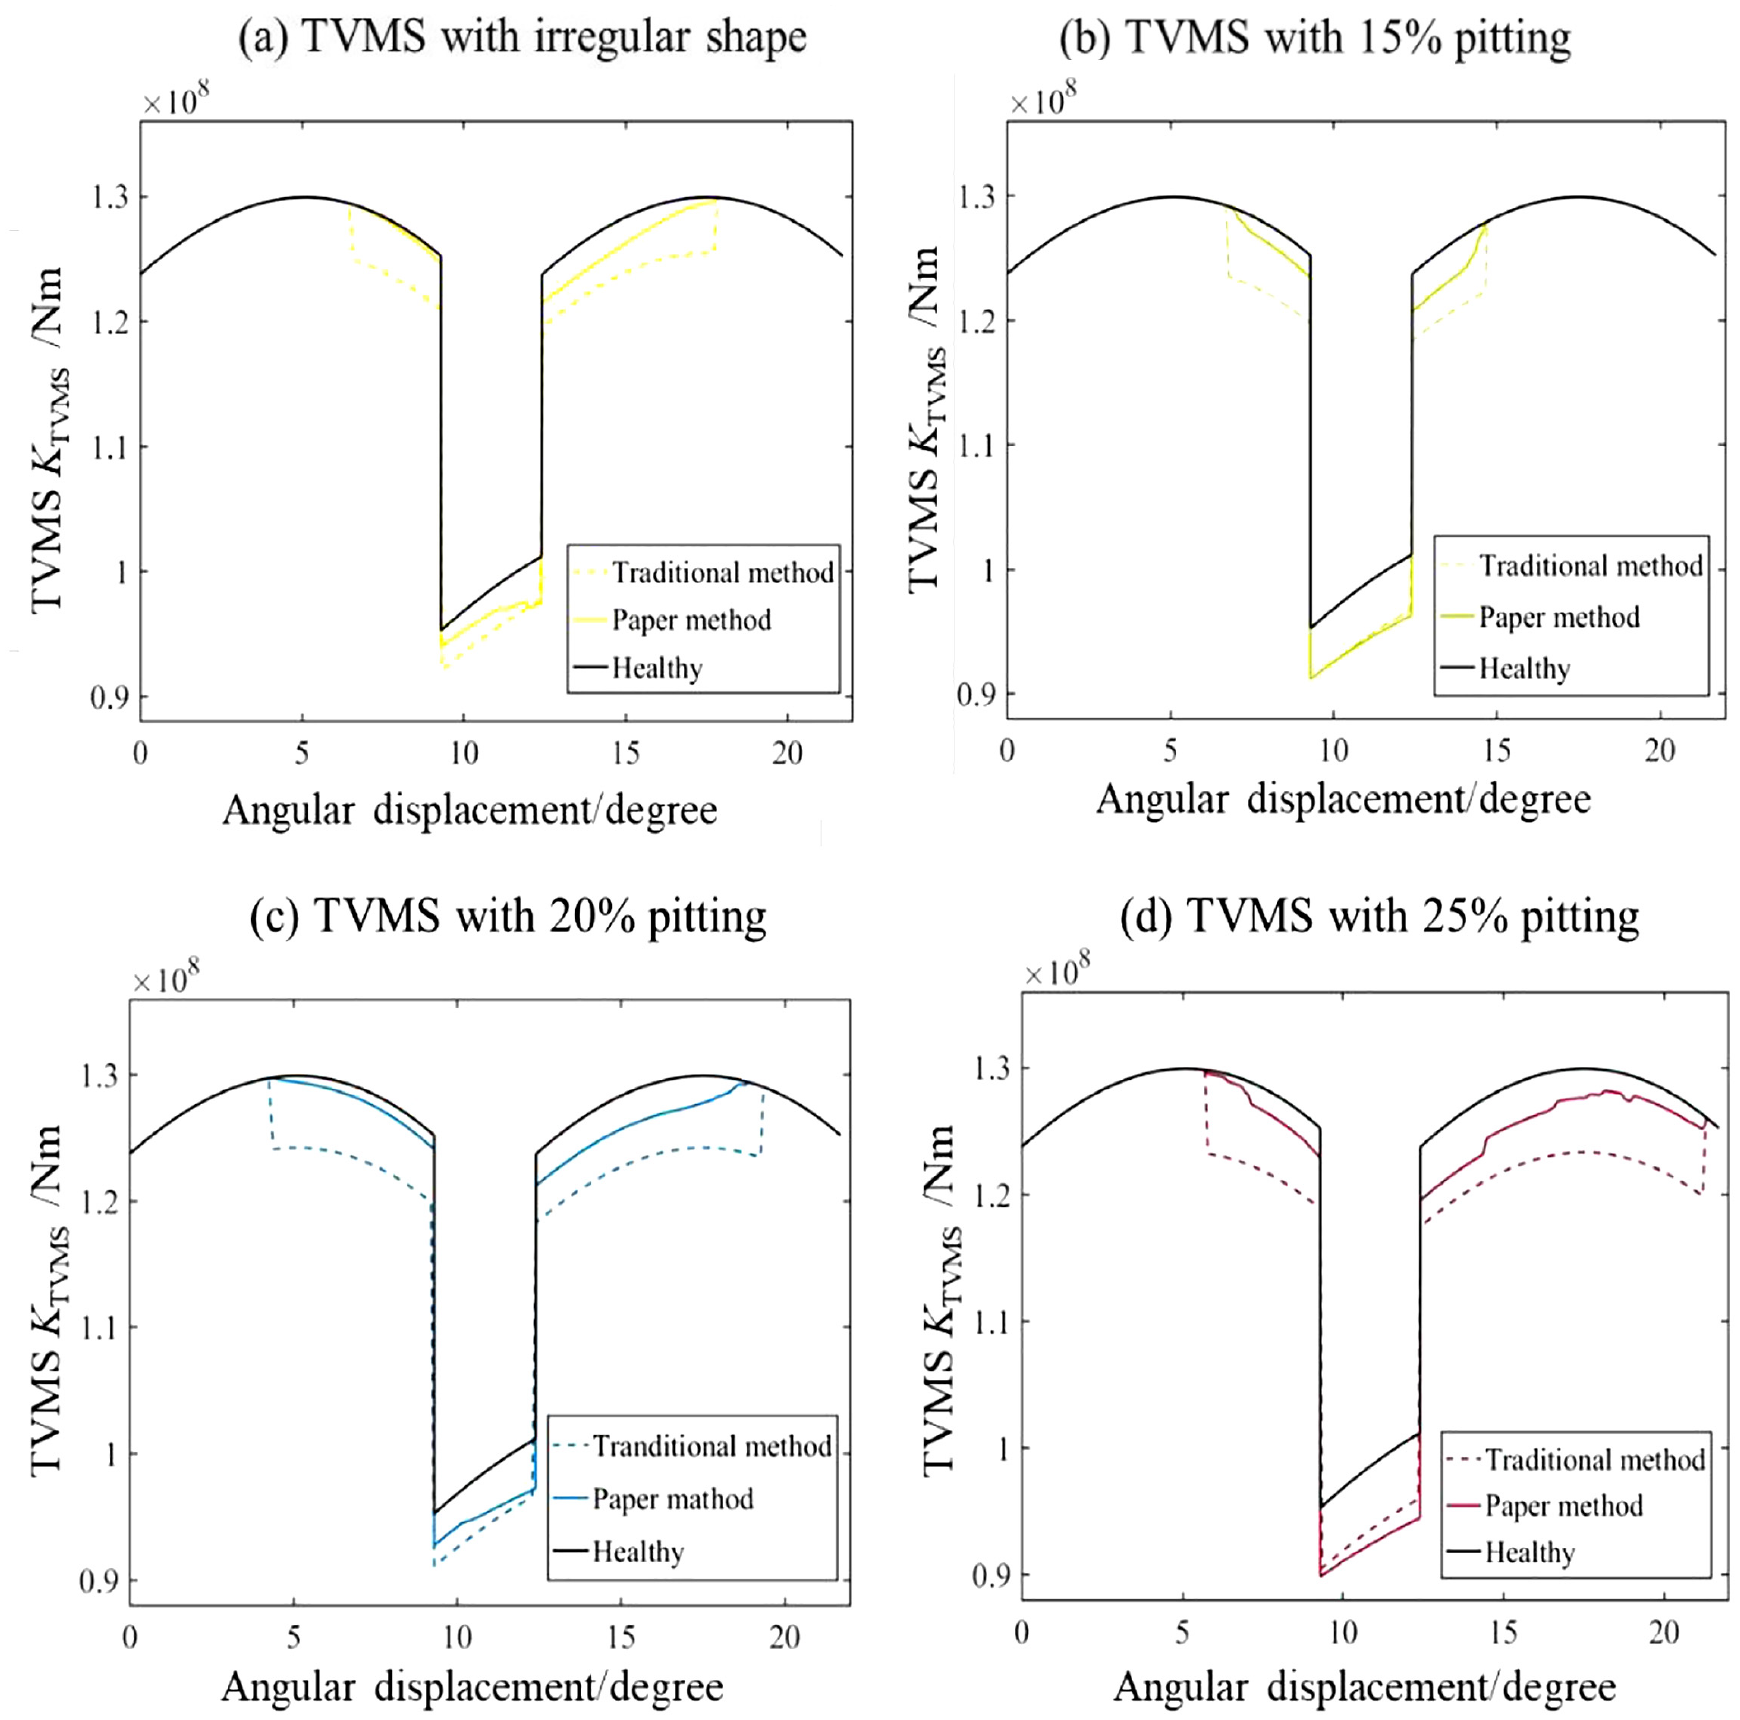
Comparison of TVMS.
Compared with the traditional energy method, 8 there is a big difference of stiffness between the initial and end of the pitting area. Figure 14(a) to (d) shows the maximum error of stiffness values can reach 10% when the gear is at the edge of pitting area. The mesh stiffness curve changes suddenly in Figure 14, which is due to the inappropriate simplification of pitting area and this will introduce unnecessary impact components into the dynamic response.
The influence of the shape of the pitting area on stiffness can be well reflected without the complicated calculation of the gear meshing process, and the speed of calculation is greatly improved. The computational time for the conventional model5,8 may take several minutes, whereas this model requires less than 40 s in one mesh cycle for computation of the stiffness matrix of pitting surface.
Dynamic response and model validation
The validation of the proposed dynamic model is based on the comparison of the simulated vibration signals with the experimentally measured signals both in the time and frequency domains under different rotation speeds and pitting states.
Description of the experimental setup
The one-stage reduction gearbox (Gearbox Dynamics Simulator) with different pitting shown in Figure 15 is to validate the theoretical results. The parameters of the gearbox are the same as Table 1. The experimental bench consists of three-phase AC motor, a pair of spur gears, a power supply unit with the speed control electronics (Lenze SMVector), and the uTekL data acquisition system. The brake type used in the test rig is an electromagnetic brake. The input shaft speed is from 500 to 1500 rpm and the load is 11.3 N m. The pitting is manufactured near the pitch line of the driven gear as shown in Figure 8. The vibration signals are measured by PCB three-axis 356A32 accelerometers of which the location as shown in Figure 16. Point I and point II are used to acquire signals by accelerometers. The sampling interval is 1/12,800 s corresponding to a sampling frequency of 12,800 Hz.
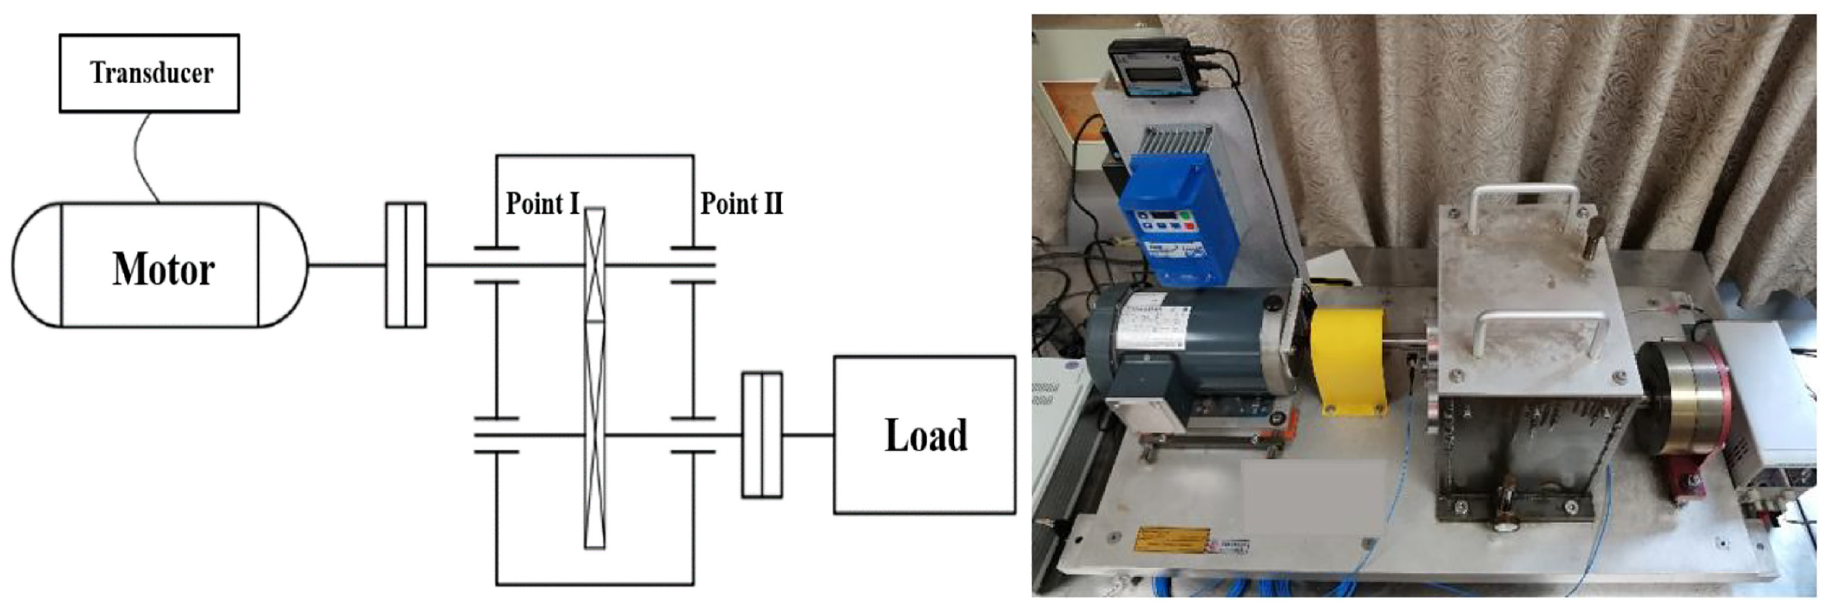
Gear pitting experimental test rig.
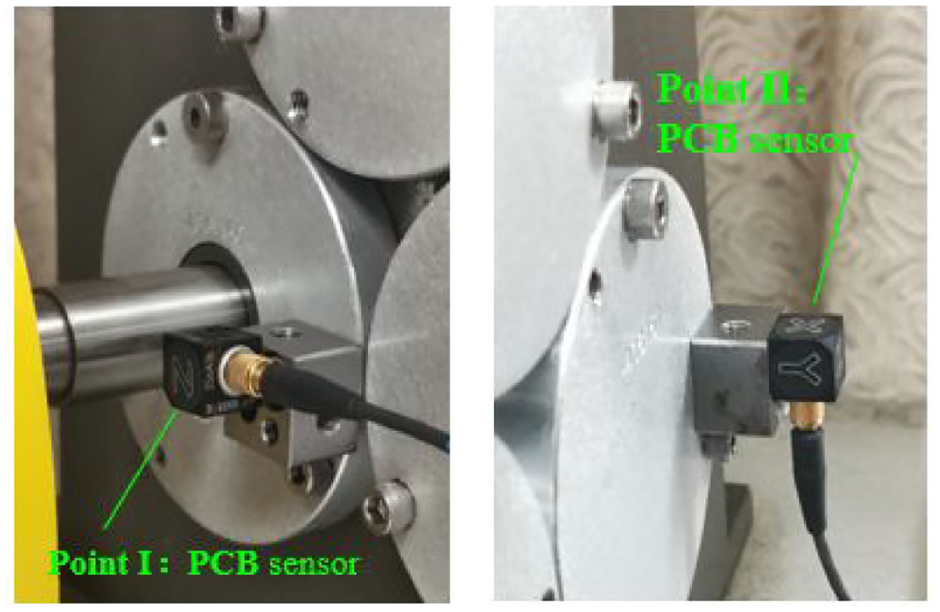
The location of PCB accelerometers.
The experimental and dynamic signals under healthy state
Taking the vibration signals of the pinion at 500 rpm, the meshing frequency fm is 241.6 Hz and the rotational frequency fz is 8.3 Hz. As shown in Figures 17 and 18, the vibration characteristics of experimental and dynamic signals can be found. As the same as the theoretical frequency spectrum, the 3fm is primary and the vibration response of the experimental signal is very close to the theoretical results both time and frequency domains.
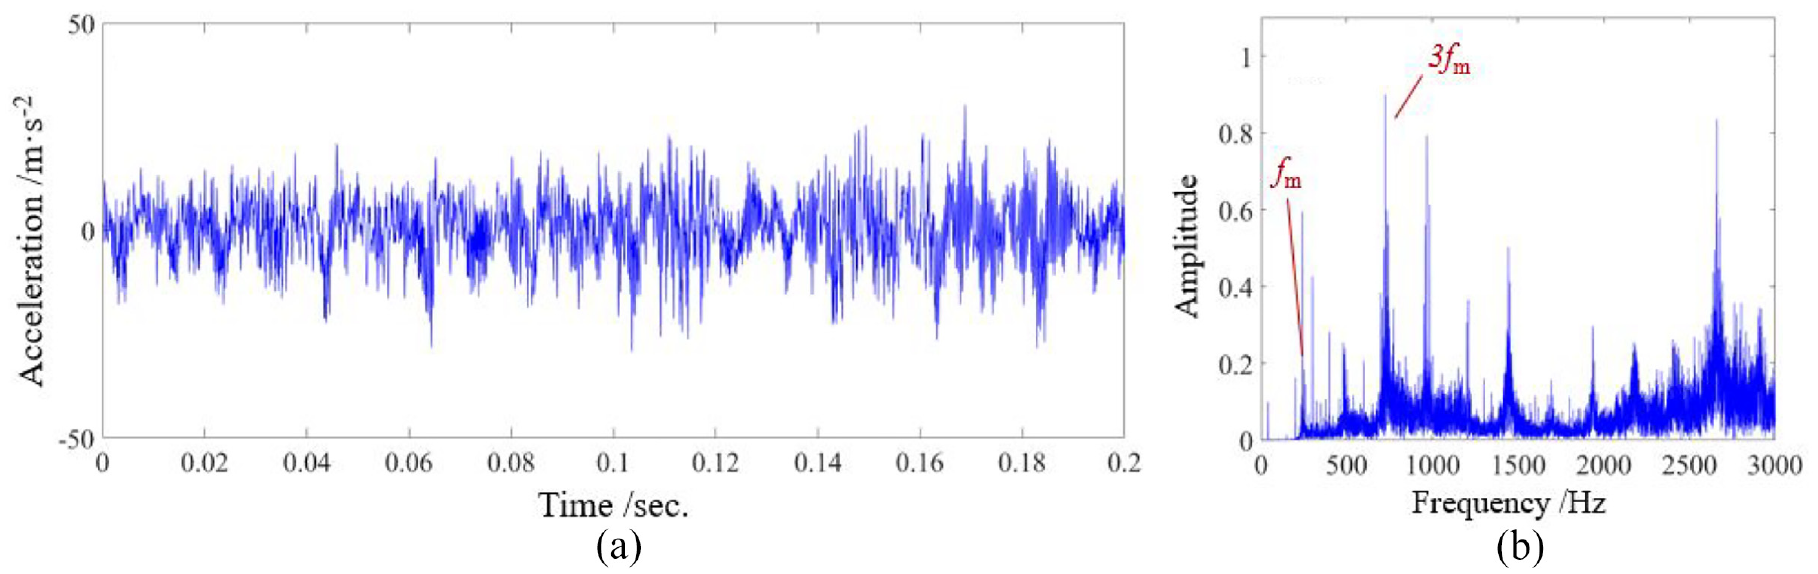
The experimental signal under healthy state at 500 rpm: (a) time history and (b) frequency spectrum.
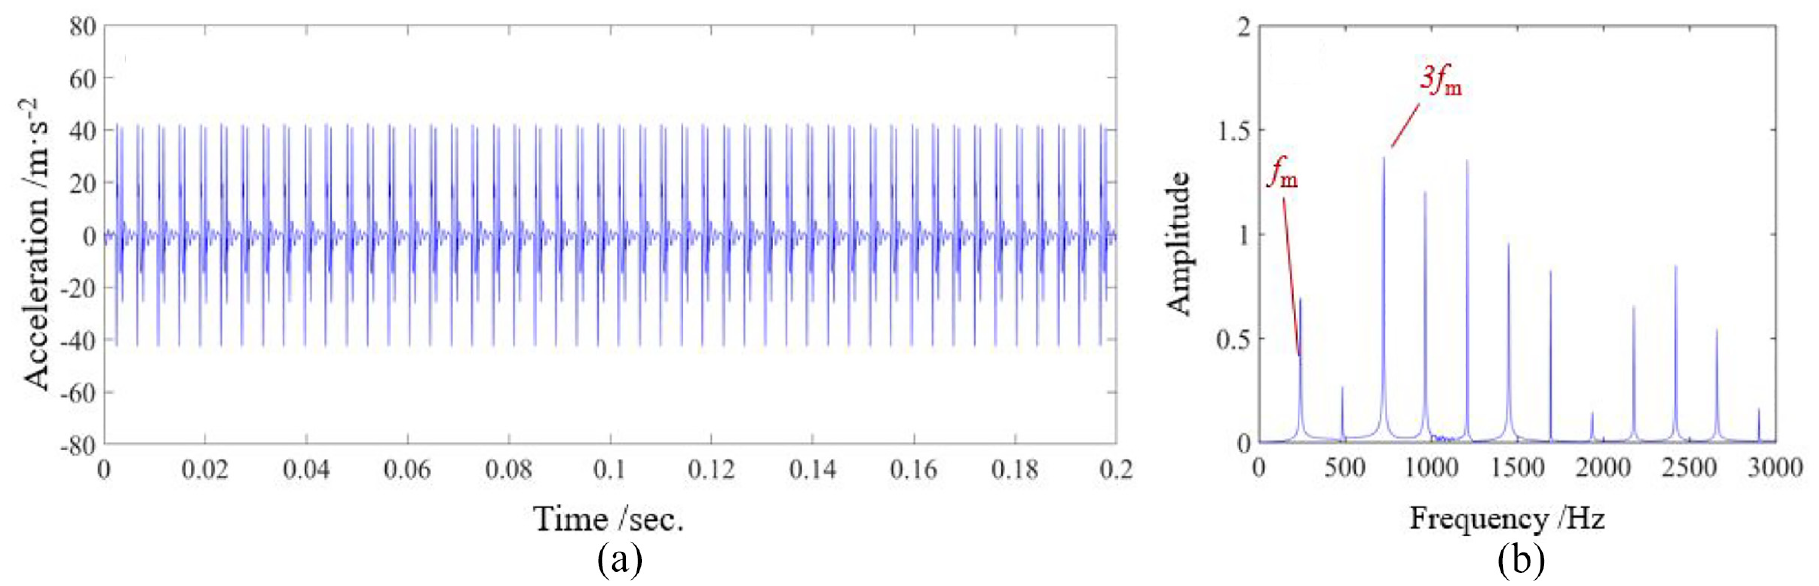
The dynamic signal under healthy state at 500 rpm: (a) time history and (b) frequency spectrum.
As observed in Figures 19 and 20, the vibration characteristics of pinion vary with the increase of the shaft speed. The primary frequency changes from 3fm frequency to fm frequency with the increase in speed.
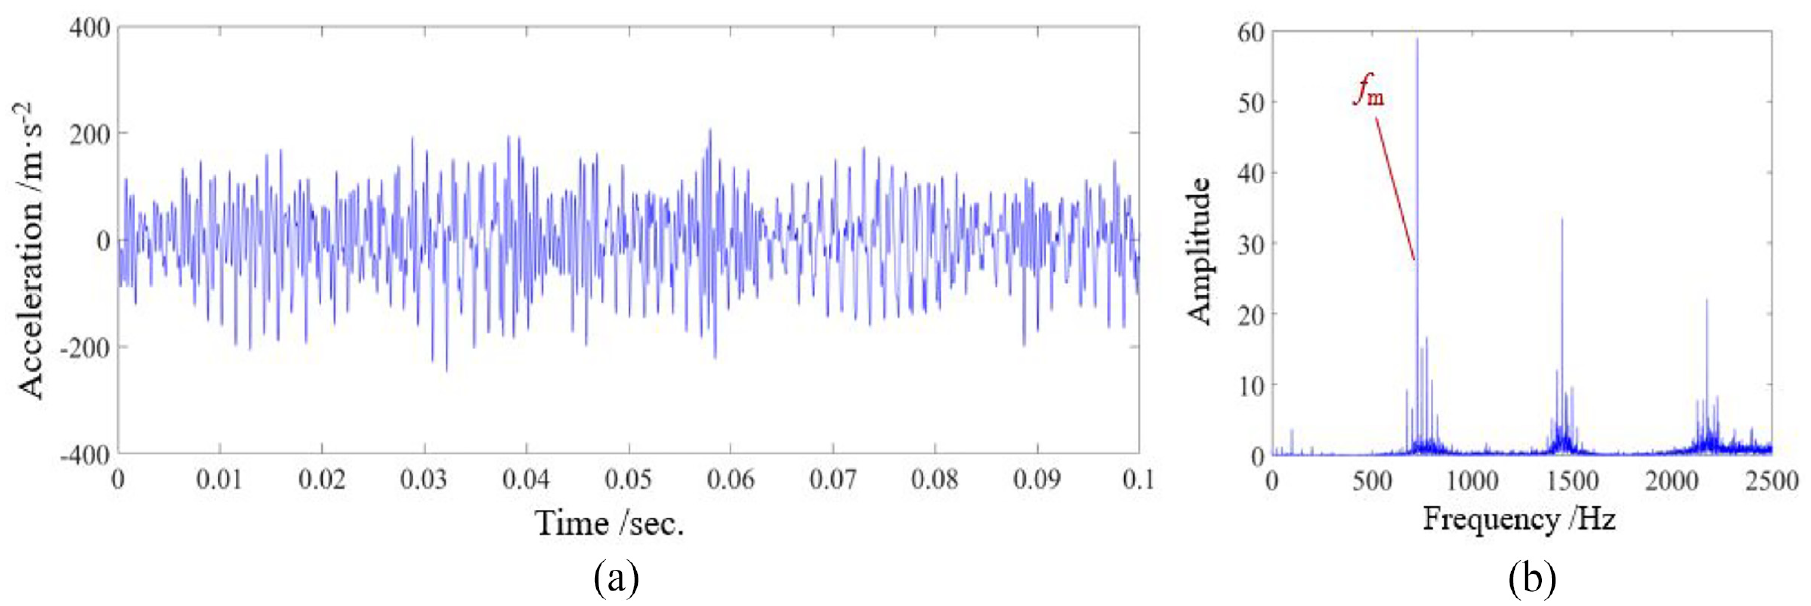
The experimental signal under healthy state at 1500 rpm: (a) time history and (b) frequency spectrum.
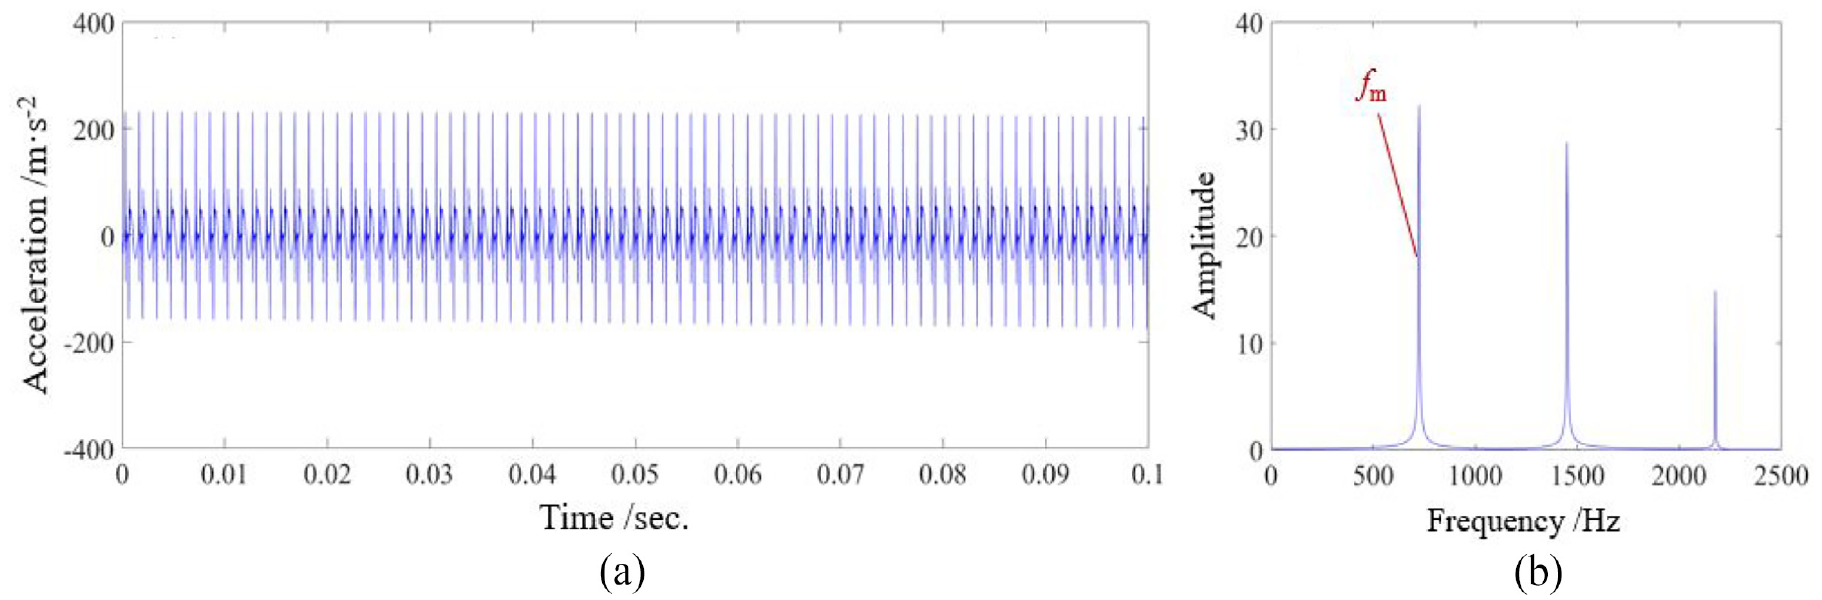
The dynamic signal under healthy state at 1500 rpm: (a) time history and (b) frequency spectrum.
The experimental and dynamic signals under different pitting states
In this experiment, a gear tooth with surface pitting is tested. Compared with Figures 17 and 18, Figure 21 shows the existence of impulse under 25% pitting state and the frequency of impulse is Δt = 0.04 s (the shaft speed is 1500 rpm). Time history shows impulse will be caused by the decrease of stiffness. And the vibration response of the experimental signal with pitting is very close to the theoretical results both time and frequency domains.
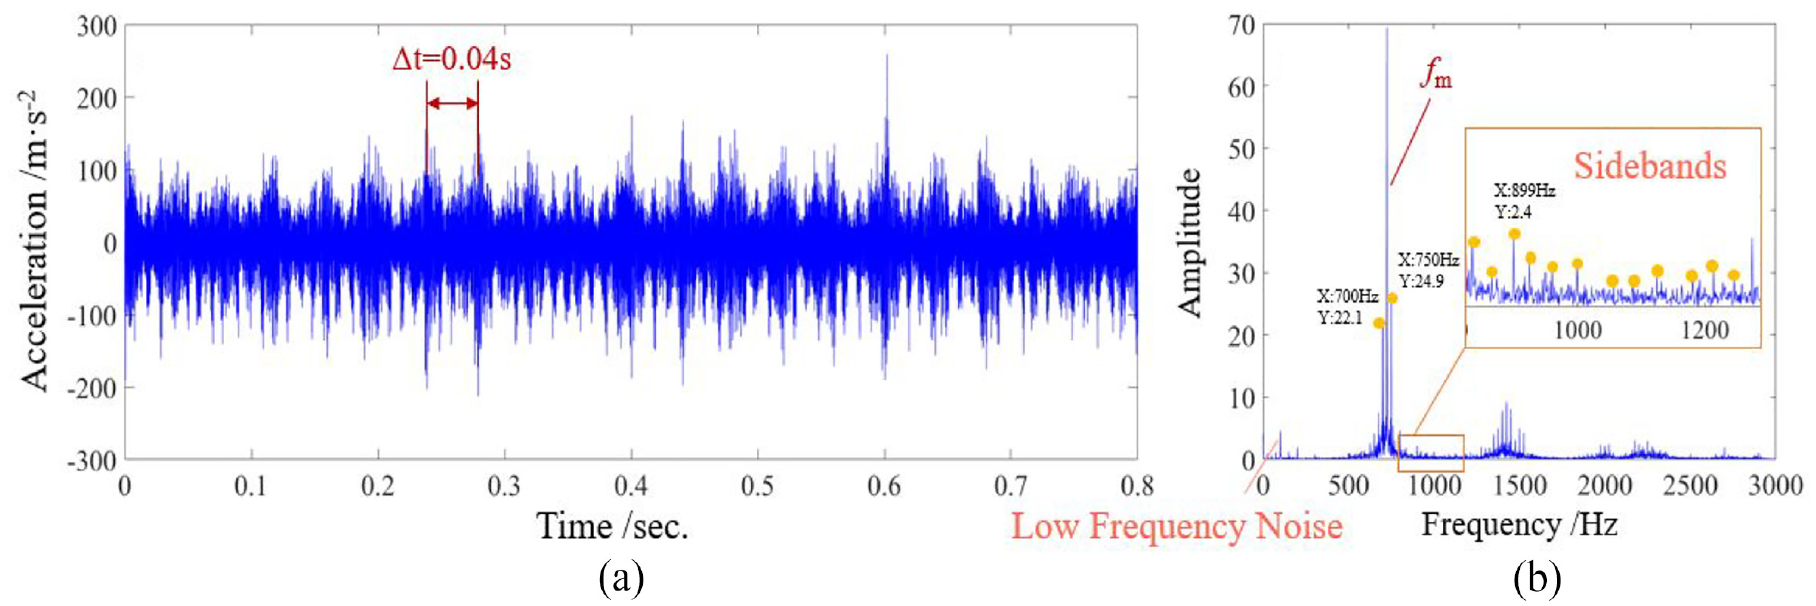
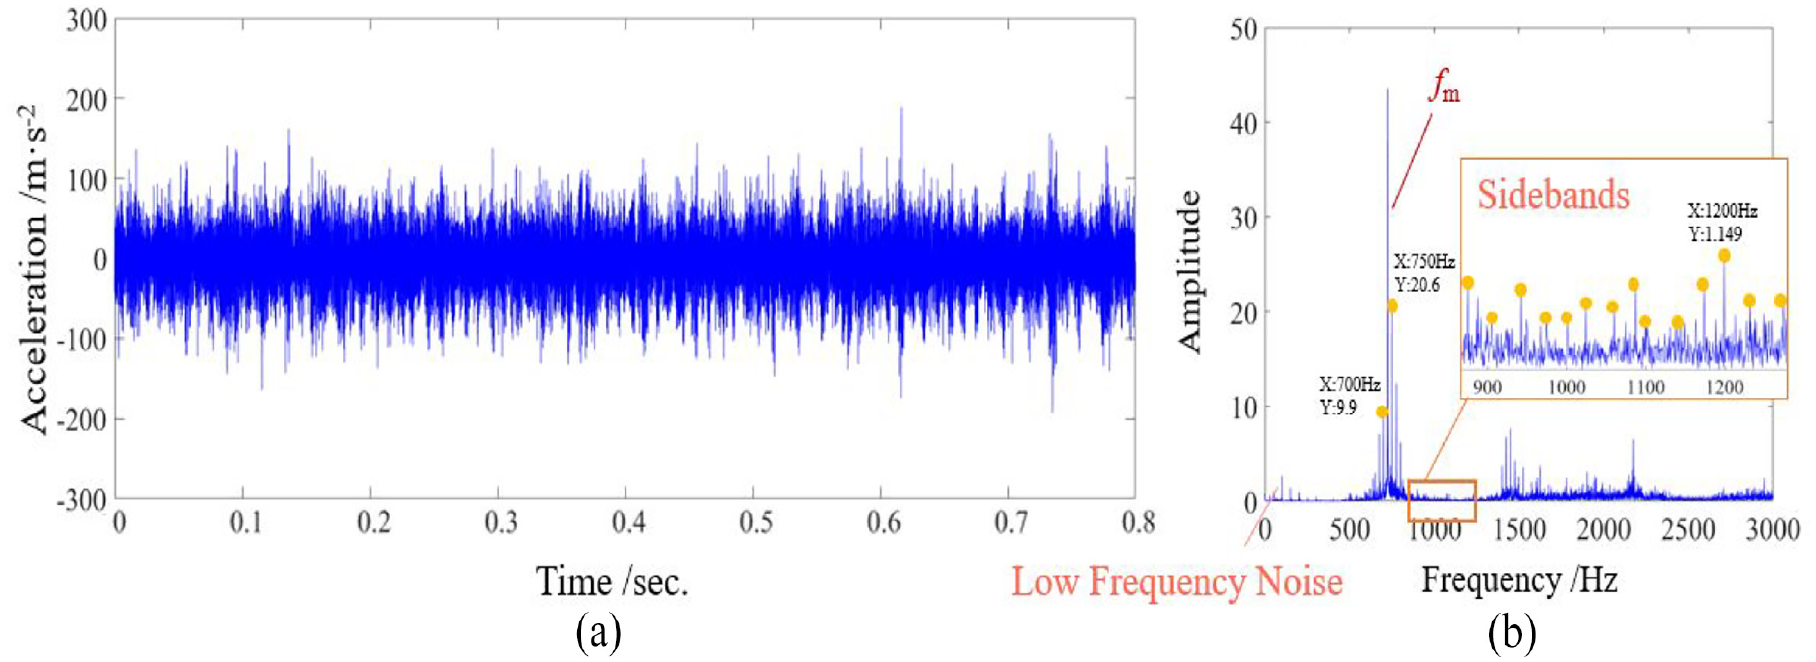
The experimental signal under 25% pitting state at 1500 rpm: (a) time history and (b) frequency spectrum.
As shown in Li and Ding, 37 for the convolution between the natural frequency evoked by the dynamic mesh stiffness, some spurious resonant frequencies would appear, which makes the resonant frequency bandwidth largely amplified. Figures 21 and 22 can clearly observe sidebands fz = 25 Hz caused by the surface pitting, which is the rotational frequency of the pitting gear. In general, the vibration response of the experimental signal agrees with the dynamic response.
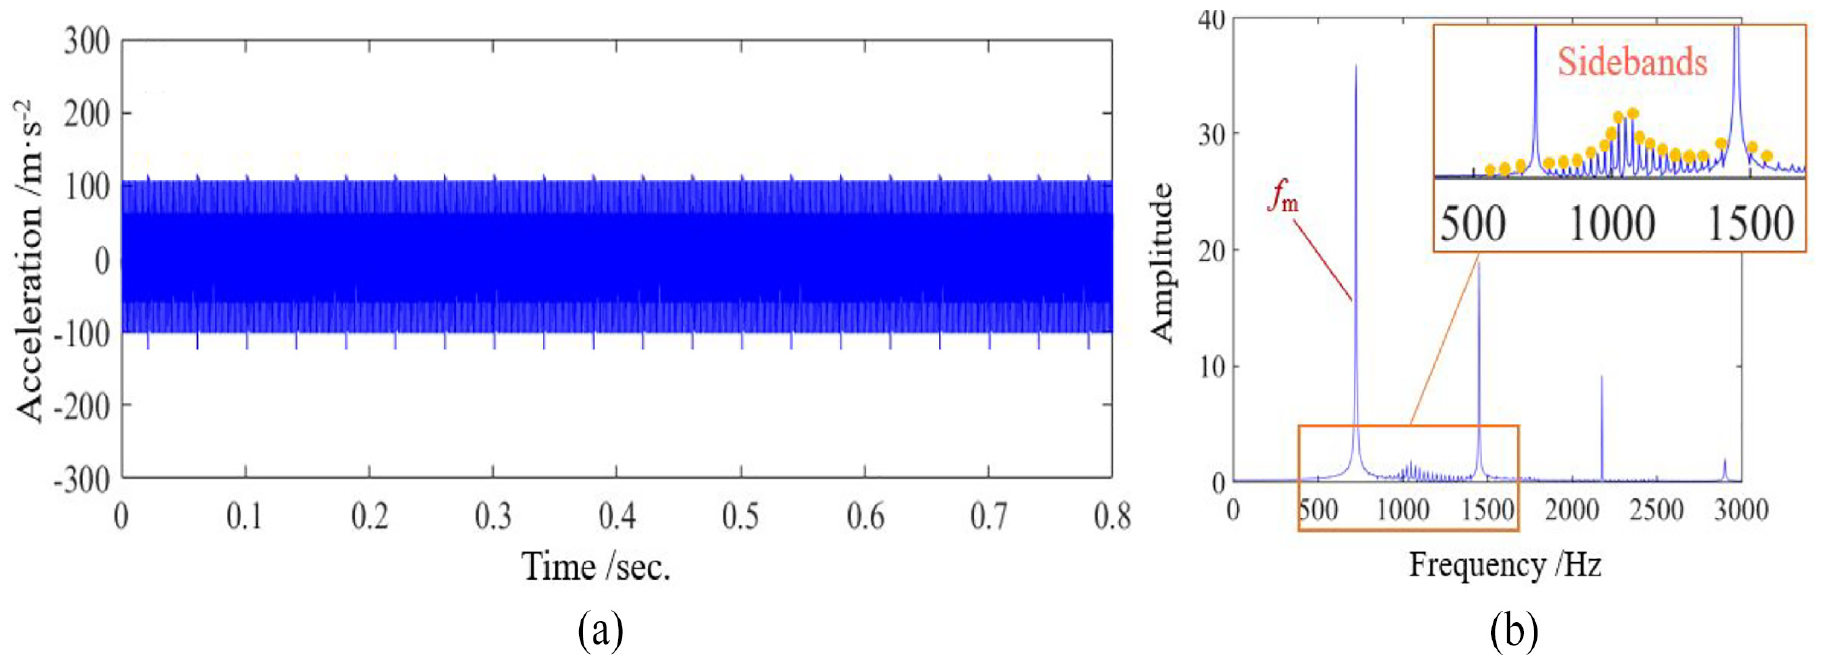
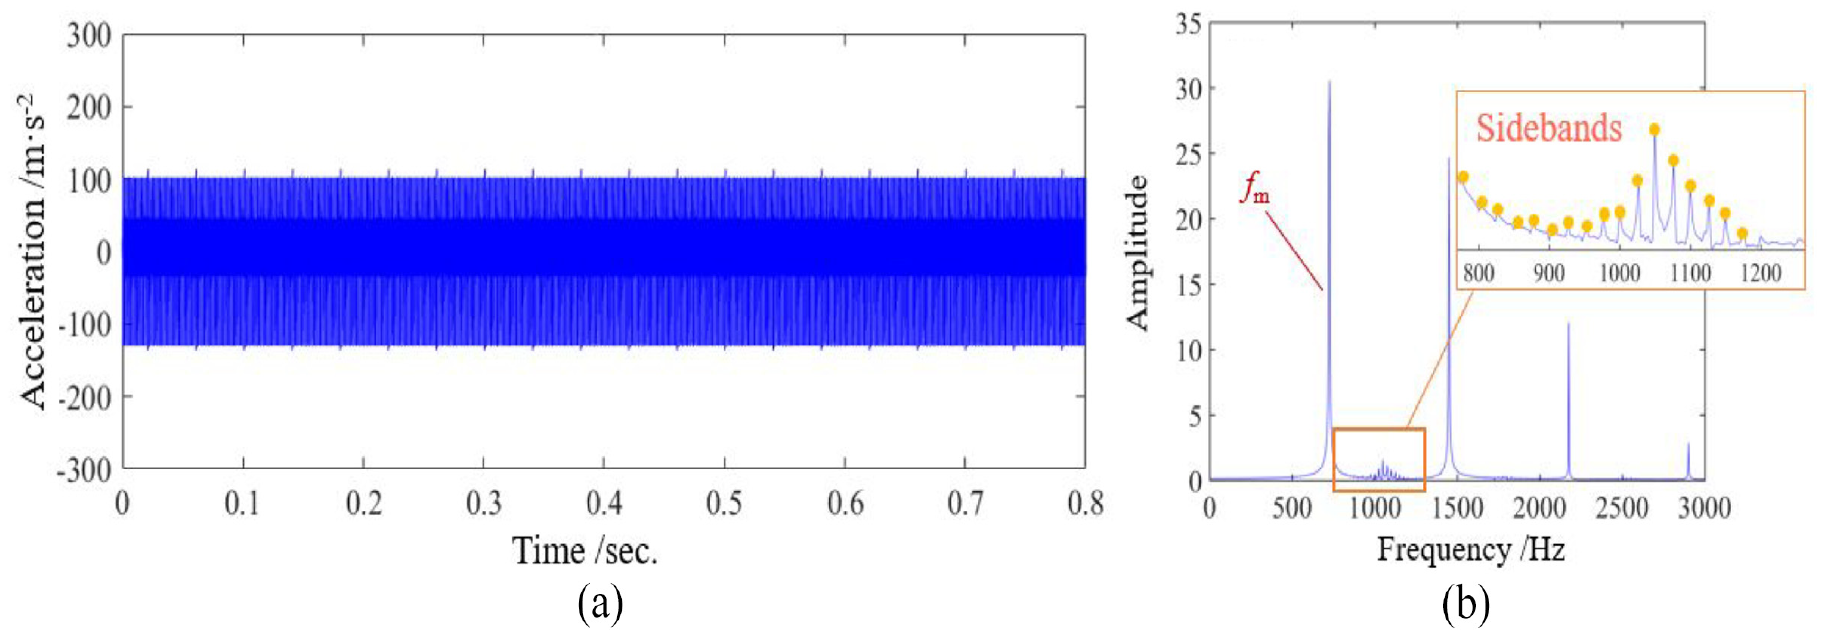
The dynamic signal under 25% pitting state at 1500 rpm: (a) time history and (b) frequency spectrum.
The comparisons between the experimental and dynamic signals with 20% and 15% pitting are shown in Figures 23 –26. It can be observed that the magnitudes of the impulse vibrations in the time domain increase with the increase in pitting severity. All the results show the amplitude of primary frequency fm increase and the amplitude of 2fm decrease gradually with the increase in pitting severity. And the amplitude of sideband frequency increases with the evolvement of pitting in the frequency domain. In addition, the experimental and dynamic results indicate surface pitting has a great influence on the frequency between fm and 2fm.
The experimental signal under 20% pitting state at 1500 rpm: (a) time history and (b) frequency spectrum.
The dynamic signal under 20% pitting state at 1500 rpm: (a) time history and (b) frequency spectrum.
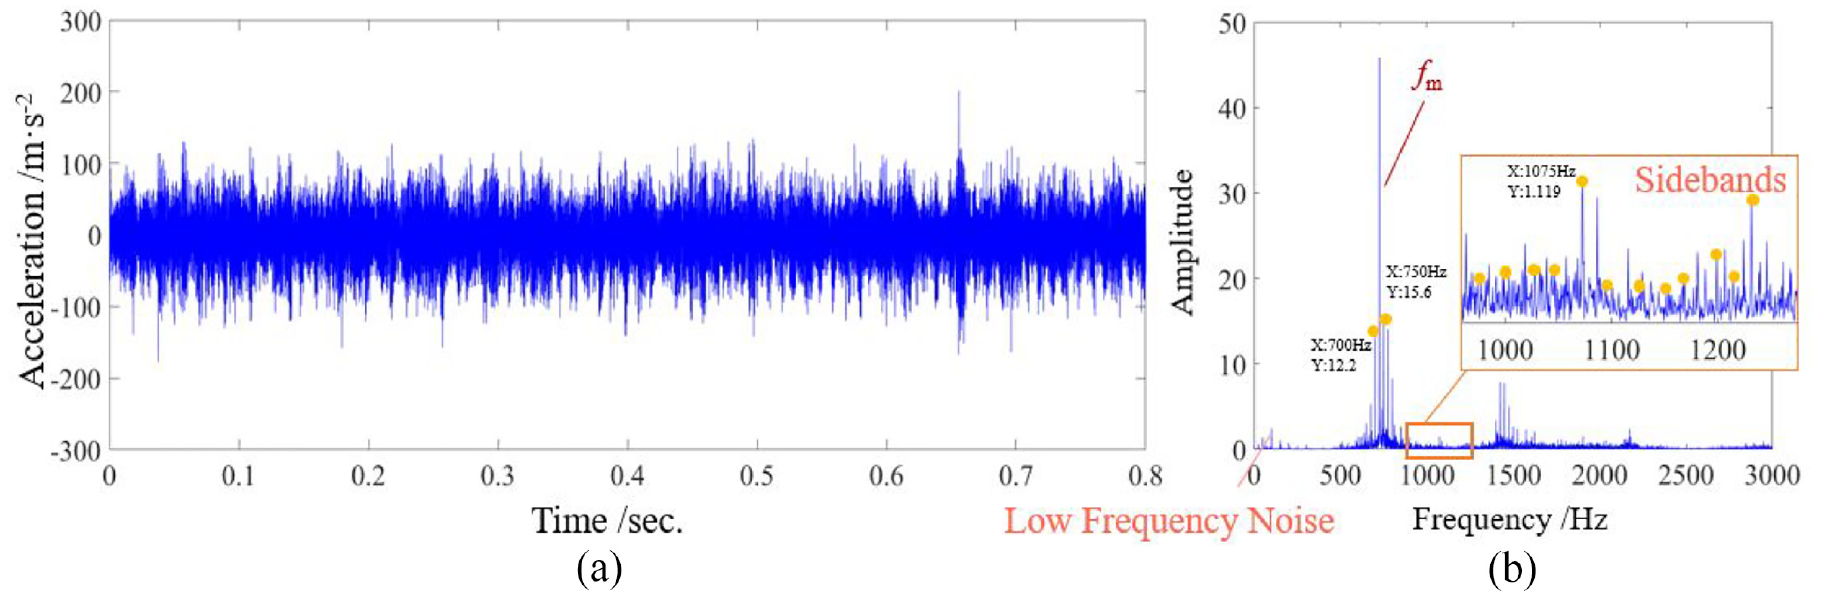
The experimental signal under 15% pitting state at 1500 rpm: (a) time history and (b) frequency spectrum.
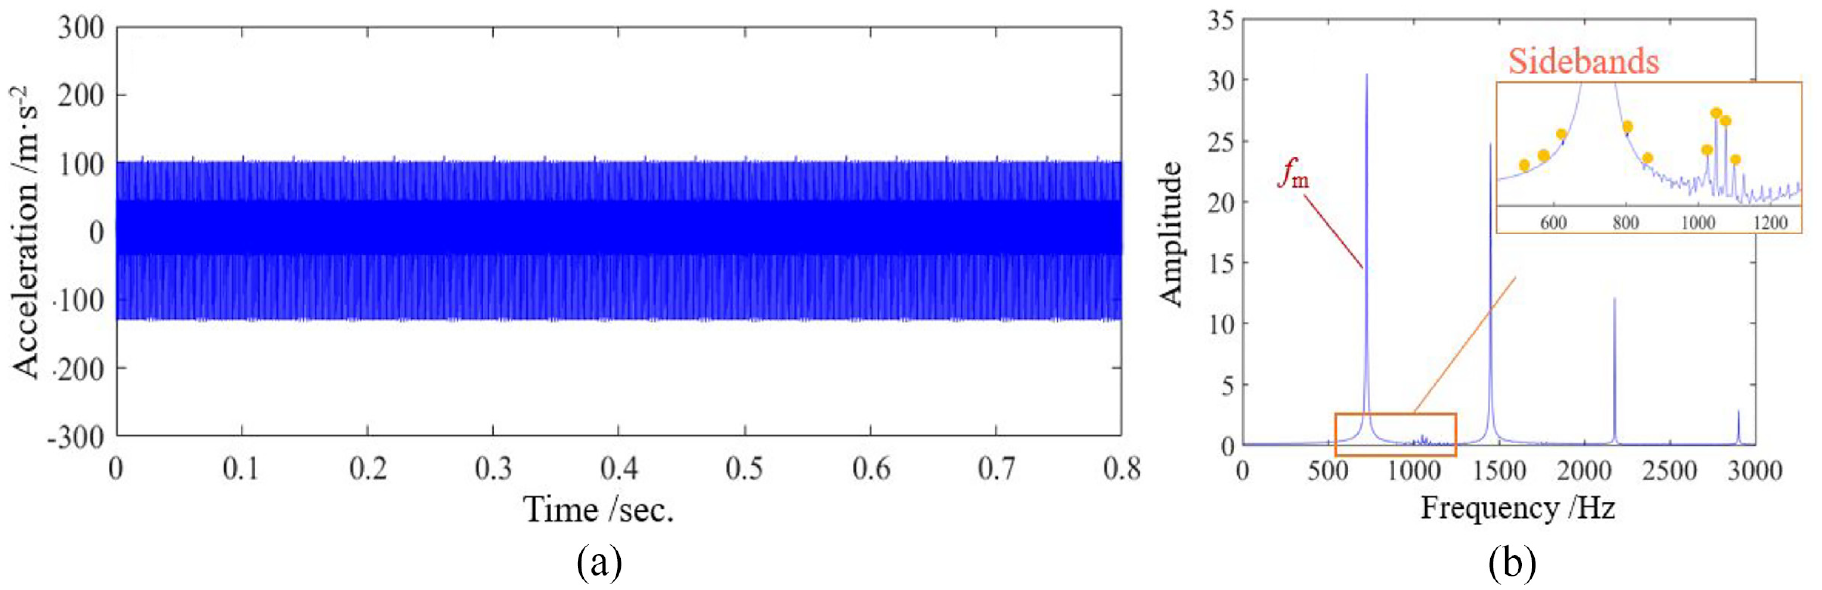
The dynamic signal under 15% pitting state at 1500 rpm: (a) time history and (b) frequency spectrum.
As shown in Figures 23 and 25, the magnitudes of the impulse vibrations have no obvious change when the increase in pitting from 15% to 20%, which shows the impulse will be covered by external noise. Besides, Figure 25(b) shows the sideband frequency caused by pitting is difficult to distinguish from the noise frequency.
Analysis of signal characteristics of gear system with pitting
Time-domain characteristics of pitting gear vibration signal
As mentioned in Section “Introduction,” among various signal-processing techniques, a number of simple signal metrics based on the time domain waveform still have widespread applications in mechanical fault detection. All the indexes (root-mean-square, Kurtosis, and Crest factor) above 1 have been used in this paper to further analyze the pitting gear signal as shown in Figure 27. Each pitting degree corresponds to five groups of statistical indicators to improve the accuracy of results.
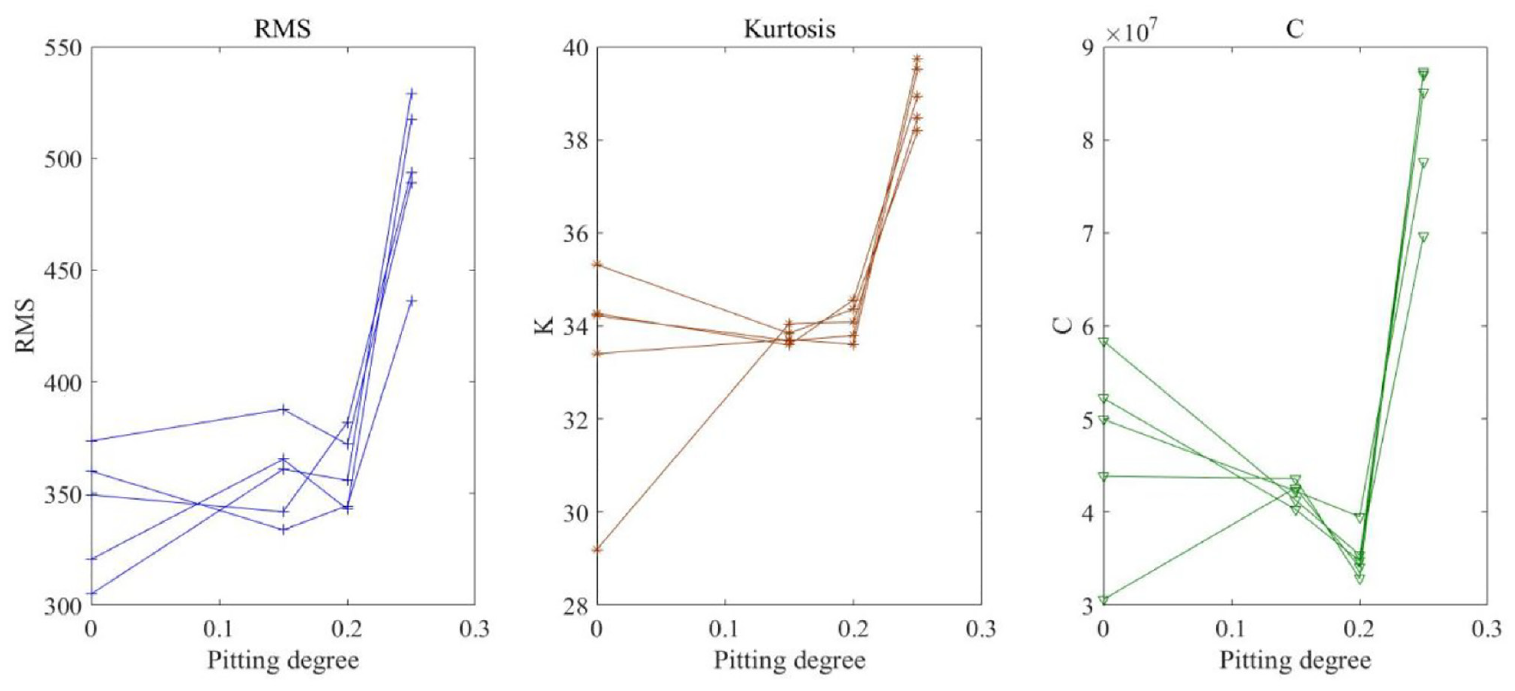
The statistical indicators under different pitting severity.
Figure 27 shows the relationship between the three statistical indicators and the pitting severity, which indicates some values of statistical indicators under 20% pitting is less than the 15% pitting values and even smaller than healthy gear with the increase in the pitting degree.
However, the above three statistical indicators reach the maximum value when the pitting area reaches 25%. The reason for this phenomenon may be the vibration signal is disturbed by external noise during the experiment, which makes the impulse caused by pitting inconspicuous. Therefore, it is difficult to distinguish the surface pitting degree according to these statistical indicators when the pitting area is small.
The application of the HHT energy spectrum method on the pitting gear signal
In this study, an HHT energy spectrum method is applied for pitting gear signals. Hilbert–Huang transform includes EMD and corresponding Hilbert transform. 38 Each signal could be decomposed into a number of intrinsic mode functions (IMFs) with different frequencies. 39 The process is summarized as follows.
HHT is applied to the experimental signal with 20% pitting, the gear pitting can introduce modulations into the vibration signals.
Select the sensitive IMF containing fault features. The frequency analyses are performed for each IMF and compared with dynamic signals. The statistical indicators in Section “Time-domain characteristics of pitting gear vibration signal” are calculated for the most sensitive IMF.
The energy signal is used for monitoring the evolution of gear fault based on IMFs. Therefore, taking the most sensitive IMF as the main signal to further analysis. The theoretical and experimental signals are compared based on the index E(t).
Figure 28(a) shows the result of decomposition based on the vibration signal of 20% pitting degree and the instantaneous signal frequencies from IMF1 to IMF6 as shown in Figure 28(b). The effect of pitting on the vibration signal is stronger in the first six IMFs, so the instantaneous signal frequencies of these are given.
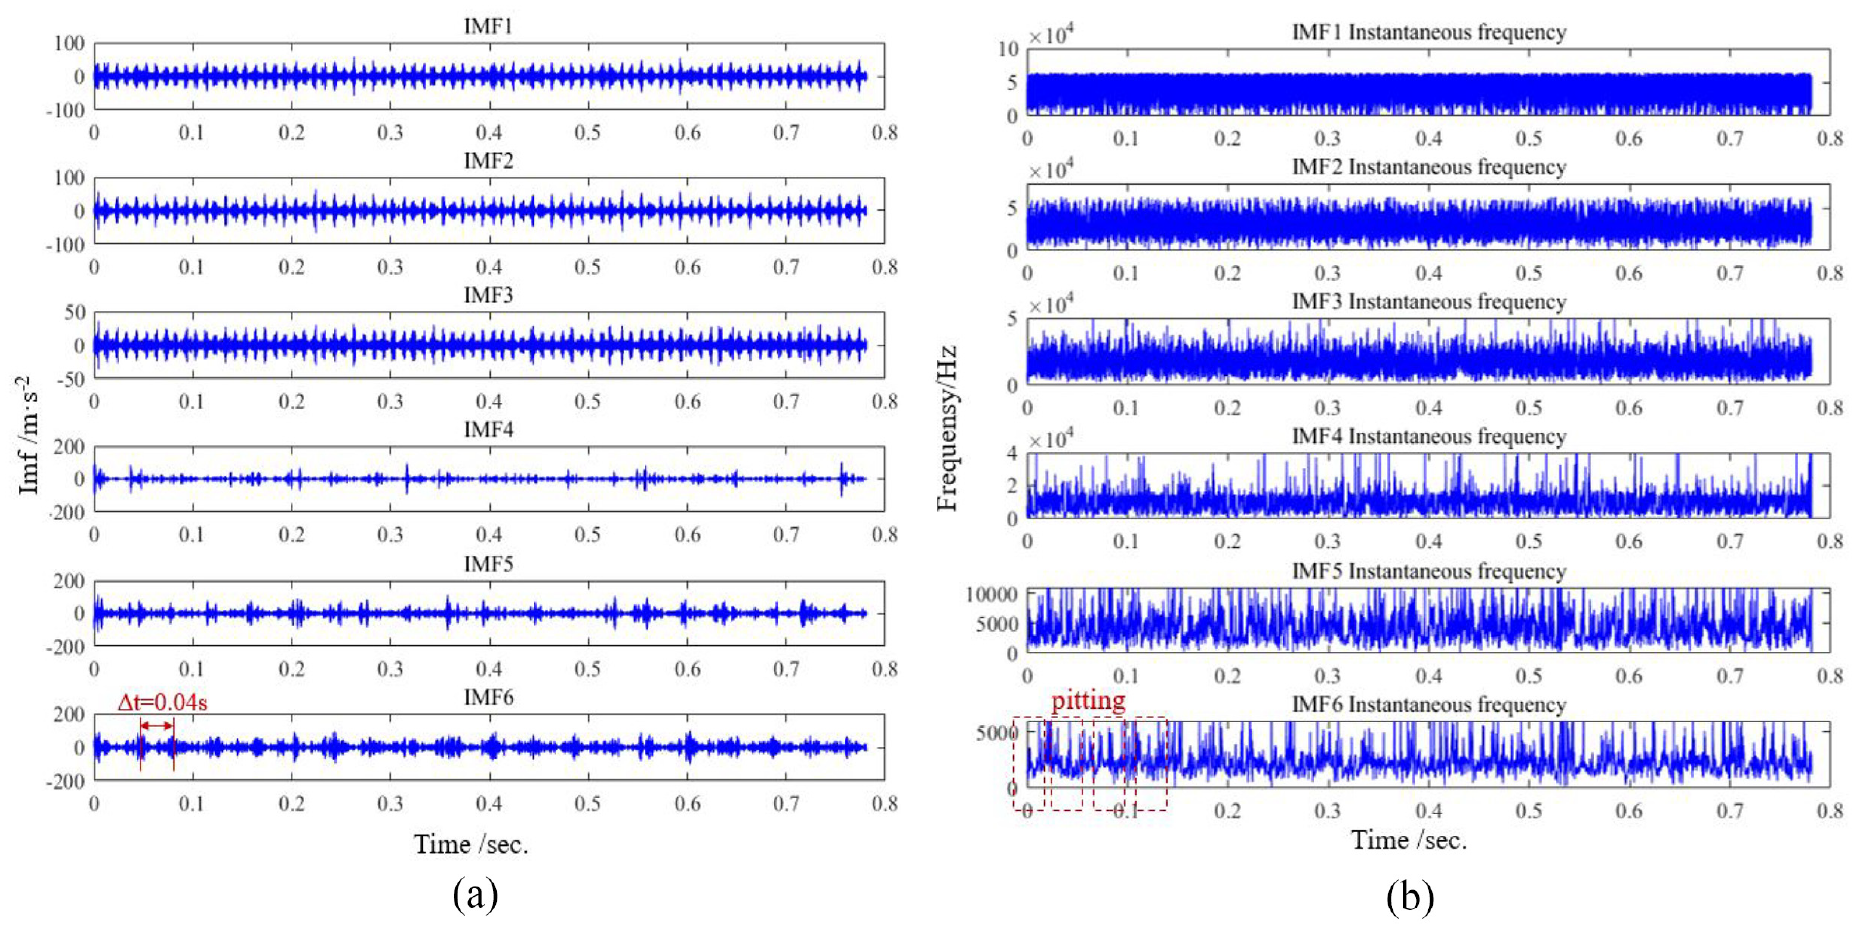
HHT on the experimental signal: (a) the intrinsic mode functions of vibration acceleration experimental signal (20% pitting) and (b) the instantaneous frequency of vibration acceleration experimental signal (20% pitting).
Each segment of the signal contains 6 rotation periods (40 ms). The impulse of IMF6 under this pitting state can be identified clearly in Figure 28(b). The instantaneous frequency of IMF6 fluctuates between the harmonic meshing frequency of 725 and 1450 Hz, which is the same as the dynamic results that the surface pitting has a great influence on the frequency between fm and 2fm as shown in Figure 29. These features are exactly the same with the gear with pitting vibration signal characteristics and coincide with the real condition.
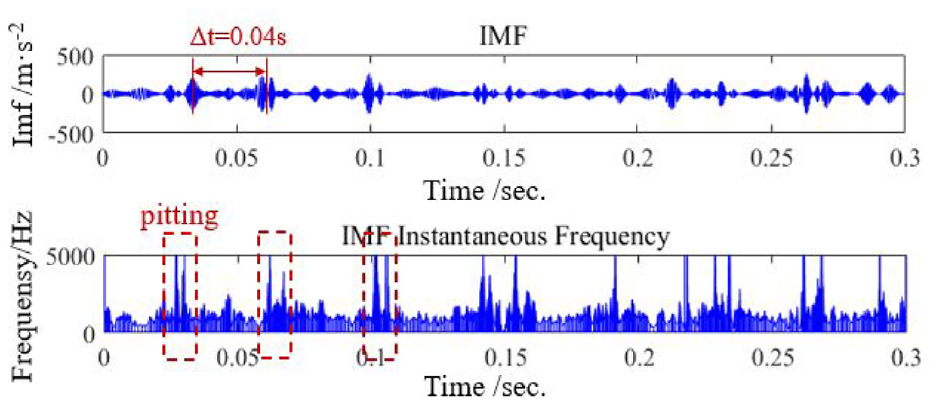
IMF6 of dynamic signal.
At the moment, when the pitting tooth is engaged in power transmission, the instantaneous frequency is significantly lowered because of the abrupt change in stiffness. Therefore, the instantaneous frequency is more sensitive to frequency modulation phenomena, and the characteristics of pitting gear signals can be better identified by the HHT method when the area of pitting is small.
Hence, the intrinsic mode IMF6 is considered to extract pitting features from experimental vibration signals. Figure 30 shows three indicators above of IMF6 signals versus pitting severity. It can be seen from the plot that the RMS, K, and C values increase steadily compared with Figure 27.
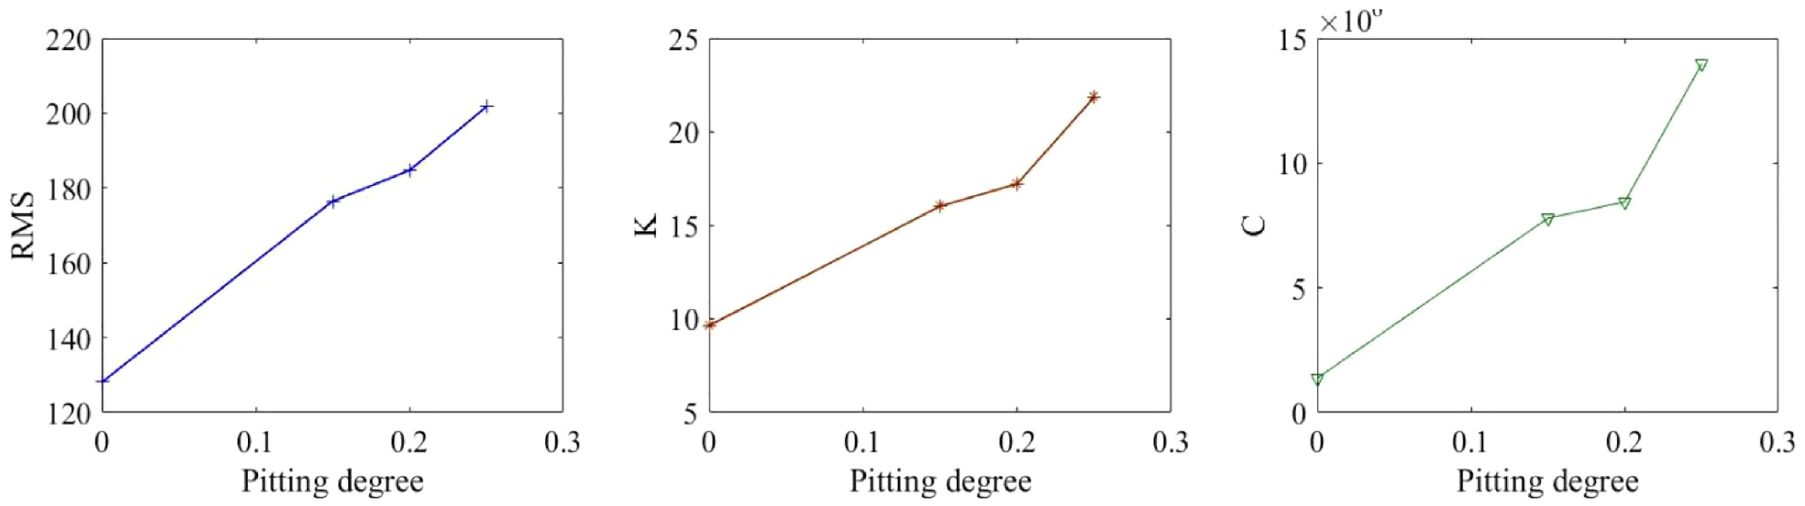
The statistical indicators under different pitting severity based on HHT.
When pitting occurs in gear, the energy of the gear fault vibration signal would change strongly in some frequency bands, but in other frequency bands the energy maybe changes weakly. 40 Therefore, taking the IMF6 experimental signal as the main signal to further analysis.
Thus, the index E(t) of component IMF6 can be defined as

where the Hilbert spectrum H (ω, t) offers a measure of amplitude distribution with the change in each frequency and time. ω indicates the instantaneous frequency. Figure 31 shows the comparison between the index E(t) of experimental and dynamic signals under 20% pitting state, from which we know that the signal has some periodical characteristics.
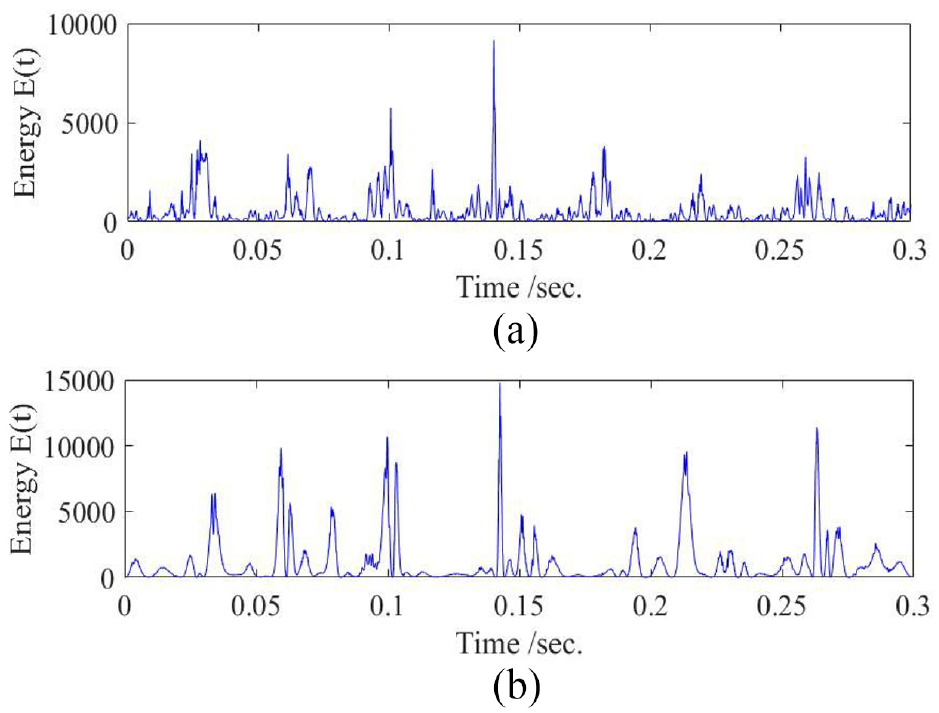
Comparison of index E(t) of 20% pitting gear vibration signal: (a) the index E(t) of experimental signal under 20% pitting state and (b) the index E(t) of dynamic signal under 20% pitting state.
The vibration energy comparison between the energy spectrum of experimental and dynamic signals from Figure 31 shows good agreement. And the energy of the pitting gear vibration signal mainly concentrates in a certain frequency band, which can be used to further identify the pitting gear severity.
Figure 32 further shows the vibration energy as detailed above versus pitting states. Obviously, the vibration energy gradually increases as the increase in pitting severity. In general, the tendency of the experimental signal index E(t) approximatively agrees with the theoretical results.
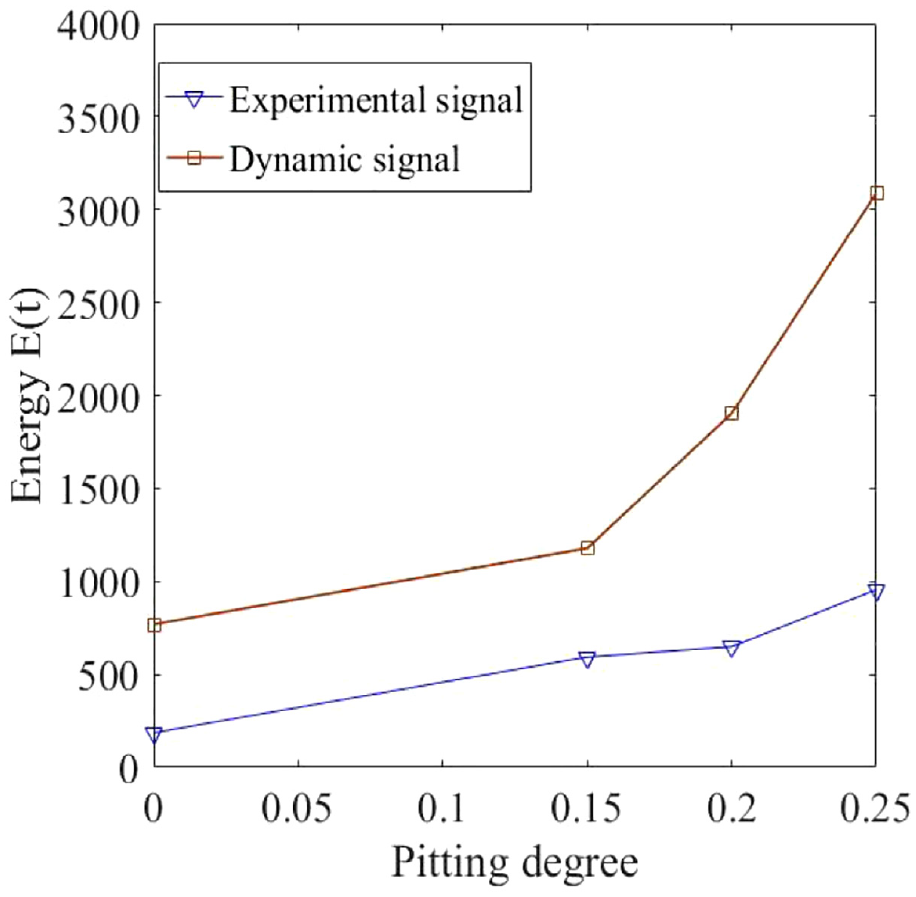
Comparison of the index E(t) between experimental and dynamic signal.
Conclusion
This paper proposed a dynamic model with pitting based on image processing. First, the proposed model enables us to simulate tooth surface pitting more accurately especially in the initial and end of the pitting area with an accuracy improvement of 10% compared to traditional methods at the edge of the pitting area. The revised mesh stiffness of healthy gear is calculated and validated by FEM with stiffness error of less than 5%. Furthermore, the proposed model also demonstrated faster calculation speeds, with less than 40 s required to calculate the stiffness matrix of pitting in one mesh cycle. Moreover, the effectiveness of the proposed model is validated by comparing the responses obtained from experimental test rigs under different rotation speeds and pitting states. Statistical indicators and index E(t) are induced based on HHT-energy spectrum method. The characteristics caused by surface pitting can be well represented which demonstrates the method’s sensitive to the impact caused by surface pitting.
However, the proposed method still requires further improvements. For instance, the fillet foundation stiffness should be revised by considering the structure coupling effect, and the effect of irregular pitting shape on the dynamic response signal should be investigated. Therefore, a further investigation is required to reasonably quantify the extent of tooth surface irregular pitting, as well as to extract fault signals completely.
Footnotes
Appendix A. Matrix
Acknowledgements
The authors would like to express the heartfelt thanks to the National Key R&D Program of China (Grant No. 2018YFB2001300).
Declaration of conflicting interests
The author(s) declared the following potential conflicts of interest with respect to the research, authorship, and/or publication of this article: We declare that we have no financial and personal relationships with other people or organizations that can inappropriately influence our work, there is no professional or other personal interest of any nature or kind in any product, service, and/or company that could be construed as influencing the position presented in, or the review of, the manuscript entitled “Dynamical Modeling of Spur Gear with Pitting based on Image Processing Tooth Surface.”
Funding
The author(s) disclosed receipt of the following financial support for the research, authorship, and/or publication of this article: This work is supported by the National Key R&D Program of China (Grant No. 2018YFB2001300).