
Abstract
From the interference fit bolt installation to tensile loading stage in single-lap joint with a hi-lock bolt, the stress and strain fields were studied experimentally and numerically. A three-dimensional finite element model was generated to simulate the experimental setup, which was validated using the experimental data. The fatigue behavior of the bolted joint is influenced by the local stress fields on the faying surface near the holes in single-lap joints. Therefore, with the aim to improve design awareness, the effects of the parameters on the local stress fields were investigated by means of finite element simulation. With an increase in the interference fit size, the occurred position of the maximum stress values on the upper plate faying surface moves away from the hole edge gradually. As the clamping force or friction coefficient increases, the position of larger stress area is changed to the side of bearing load from the transverse direction. The lap geometry of the bolted joint as well as the amplitude of tensile load has apparent impact on the maximum stress value.
Introduction
The bolted joints constitute a mode of connection of the mechanical components, which are often used in fields such as aeronautics and automotive. In the aircraft assembly, at the junction of the main load-bearing components, such as wing beams and fuselage strengthen frames, in order to improve the structural fatigue performance, the interference fit bolted joints are widely used. 1 In addition, the interference fit bolted joints often are adopted as an important solution in aircraft repair. 2 By the virtue of their high strength, light weight, controlled preload, high fatigue life, and other characteristics, titanium (Ti) alloy bolts are used with as many as 40,000 in a B747 and 5500 in a A320 wing; 3 as the interference fit fastener, it can achieve lighter weight and longer fatigue life for aircraft structures.
There are some researches on interference fit joint using the theoretical method. Based on the theory of thick-walled cylinders, Япковец, 4 Pedersen, 5 and Croccolo and Vincenzi 6 calculated the stress distribution around the hole, which limited to idealized assumptions. Considering the interference fit assembly process, finite element (FE) analysis and experimental approaches are employed. Paredes et al. 7 established a FE model to simulate the assembly process of interference fit fastener in the plates and to analyze the radial pressure in the holes and axial tension loss. Jiang et al.8–10 developed an axis-symmetric FE simulation to study the interference fit bolt insertion process and presented a comprehensive analysis about hole vicinity residual stress distribution and hole deformation.
With the aim to know the performance of the interference fit bolted joint, Ramamurthy, 11 Sundarraj et al., 12 and Pradhan and Ramesh 13 analyzed the stress distribution when the bolted joint was in tension, but ignored the simulation of the fastener installation. Chakherlou et al. 14 and Bi et al. 15 simulated the entire process covering the interference fit pin insertion, bolt clamping, and tensile loading and studied the effect of interference fit size on the hole vicinity stress distribution. For the effects of the other parameters on the mechanical behavior in the bolted joints, Minguez and Vogwell, 16 Chakherlou et al., 17 and Alkatan et al. 18 studied the tightening torque (or clamping force) effect on fatigue strength and load transfer of the bolted joint bearing tensile load. Yu and Chen 19 and Zhang and Cao 20 analyzed the effect factors, such as clamping force, friction coefficient, and load amplitude, in the double-lap bolted joint. Hoang et al. 21 investigated the effect of geometric dimension, bolt number, and tightening torque on failure mode of the single-lap bolted joint. Moreover, Manes et al. 22 studied the effect of riveting assembly parameters on local stress field around the hole in tensile loading stage. However, the assembly parametric studies in the single-lap bolted joint with the interference fit were rarely seen.
In this article, the local stress fields on the faying surface (near to the hole) in single-lap joints are studied experimentally and numerically. First, the experimental tests of the entire process including bolt insertion, bolt clamping, and tensile loading are carried out. Then, using FE software ABAQUS 6.10-1, 23 a three-dimensional (3D) FE model is established to simulate the above experimental processes and also is validated by the experimental results. Finally, the parameters such as interference fit size, clamping force, friction coefficient, and tensile load amplitude affecting the local stress field are analyzed.
Experimental tests
Specimen information
A total of four joint specimens are designed and manufactured, and the specimen configuration is shown in Figure 1. Each lap joint consists of several 5-mm-thick 7050-T7451 aluminum (Al) alloy plates, the upper plate, the lower plate, and the two backing plates. The dimension of the upper and lower plates is 140 × 60 × 5 mm, and the distance between the plate free edge and the hole center is 20 mm. To ensure that the hole on the upper and lower plates is coaxial and matched in hi-lock bolt insertion, the two plates are pre-fastened using four common screws M4. At each common screw, the tightening torque of T0 = 0.5 N m is applied. By the empirical formula
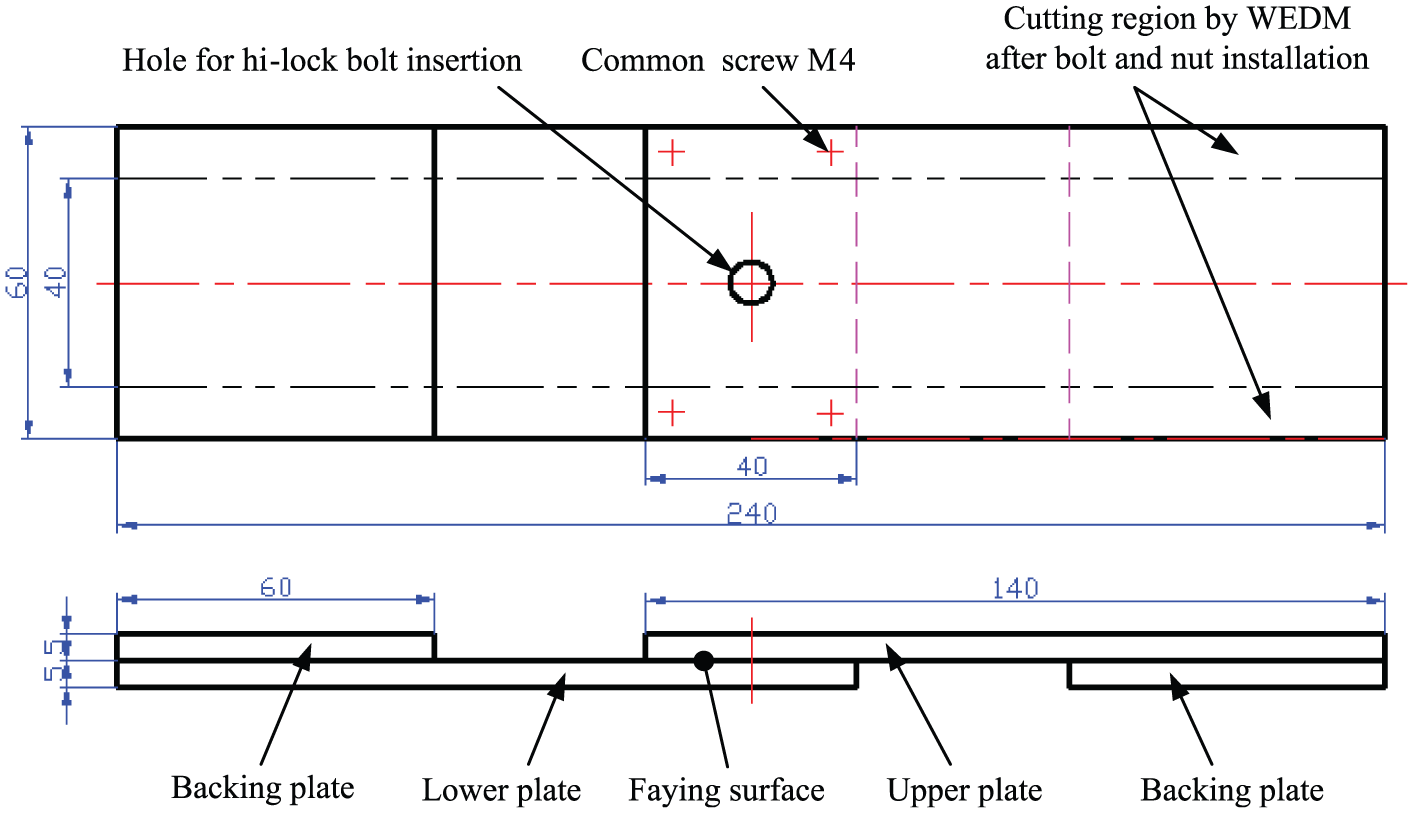
Specimen for interference fit bolt insertion (mm).
In this article, d and D present the bolt shank diameter and hole diameter, respectively, and the interference fit size is defined as
Ti-alloy (Ti-6Al-4V) hi-lock bolt M8 are chosen in the experiment and four bolts with the same shank diameter of 7.97 mm are selected. The holes for the bolts’ insertion are fine milled by computer numerical control (CNC) machining center. And the diameters of the holes and interference fit sizes are listed in Table 1.
Interference fit sizes.

Tolerance is 0 and +0.003 mm.
Tolerance is ±0.003 mm.
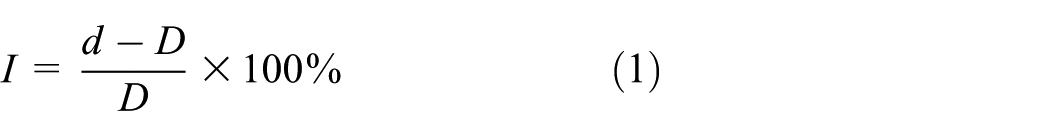
In the experimental test, strain gauges made by Zhejiang Measurement and Instrument Company are employed to capture the strain variation during the lap joint experiencing tensile load, and the type of B × 120-1AA with the sensitivity factor of 1% and transverse effect factor of 0.5% is chosen. After the installation of the hi-lock bolt and nut, strain gauges (G1–G6) are mounted on the upper plate, and the positions are shown in Figure 2. G2 and G4 are used to measure the hole vicinity hoop (tangential) strains, G1 and G3 measure the radial strains around the hole, as well as G5 and G6 are used to evaluate the secondary bending level of the upper plate in the tensile loading stage.
Strain gauge mounted on joint specimen (mm).
Experimental test
The interference fit insertions of the hi-lock bolt are carried out on the material test machine WDW-100(kN), as shown in Figure 3. A supporting fixture with a central hole is placed on the base seat of the machine. In order to ensure that the bolt insertion is quasi-static, the squeeze speed is set to 2 mm/min. The squeeze force data collected by the pressure sensor are recorded in the insertion process.

Interference fit hi-lock bolt insertion test.
After the insertion of interference fit bolt, the spring steel washer (outer diameter of 13 mm, inner diameter of 9 mm) and M8 × 1 common steel nut are applied for bolt clamping. The tightening torque on the nut is T = 3.5 N m for every specimen. By
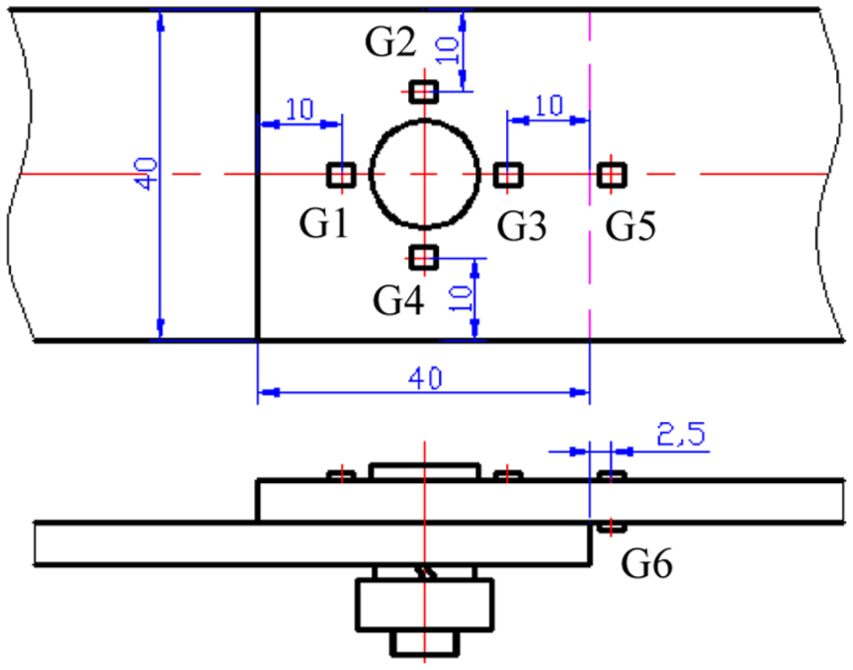
The tensile tests of the bolted joints are carried out in the multi-function testing machine, as shown in Figure 4. The machine (made by the Institute of Applied Mechanics, Zhejiang University) consists of the reaction frame, hydraulic power devices (YZB50-2 × 2 pump and YCD-5 jack), and the strain force sensor (RCT-21kN produced by Showa, and measuring error ≤0.3%). The specimen is connected to the frame with two M14 screws and two U-shape connectors. The strain gauges (G1–G6) are connected to the dynamic strain indicator and a PC with data acquisition card. Each specimen undergoes three cycles of tensile loading, the time of a cycle is 1 min, and the maximum value of tensile loading is 10 kN.
Tensile test and specimen in test machine.
FE simulations
FE model
In FE model, the material property parameters are required. To obtain the exact elastic and plastic material properties of the lap plates and hi-lock bolt, compressive tests were performed on

True stress–strain curves.
According to the specimen configuration, the FE model is developed in the ABAQUS, as shown in Figure 6. Due to the bolted joint being a symmetrical structure, only half of the joint is modeled in the FE model, and the symmetric boundary conditions are applied to the joint center plane along the longitudinal direction. To simplify the model, the bolt threaded segment is replaced with a simple cylinder, and the nut and washer are regarded as one part. The details, an arc of 2.5-mm radius and 25° at the bolt transition region (also called the import part), and a chamfer C0.6 mm at the hole entrance of the lap joint, are shown in Figure 6(c).

Three-dimensional FE models (including boundary conditions and load): (a) global model, (b) boundary conditions in insertion step, and (c) details.
The model is meshed with the hexahedral reduced element C3D8R, which has higher computing speed and greater accuracy than the tetrahedral element C3D4 in ABAQUS. The mesh in the hole vicinity is refined (element size is about 0.4 mm), and the mesh at the ends of the joint is coarsen.
Complicated contact friction was produced between the bolt shank and the hole wall in hi-lock bolt insertion, and a friction coefficient of 0.1 is specified (as recommended by the bolt manufacturer). Considering previous industrial work, the friction coefficient of 0.2 is estimated for the faying surfaces between the upper and lower plates, the washer, and the lower plate.
FE simulating
Corresponding to the experimental process, there has been three analytical steps in the FE simulation. The first step is the interference fit bolt insertion process, which is defined as the static analysis step. A reference point (RP-1) is defined, and then the coupling constraint is established between RP-1 and the bolt top surface. The bolt is uniformly pressed into the hole by applying a displacement condition Uz on RP-1 (using a default time of 1 s); at the same time, the squeeze force is recorded through RP-1. And the actual squeeze force is the double recorded value because only half of the model is used in the simulation. The other boundary conditions are Uy = 0 at the symmetric plane of the bolt and plates, Ux = 0 at both ends of the surface, and Uz = 0 (
The second step is bolt clamping, which is also defined as the static analysis. The bottom of the bolt is fully constrained first in this step, and then the washer and nut (as a part) are applied as a distance condition to obtain an average pressure of q = 30 MPa (according to tightening torque of 3.5 N m in the test) on the washer surface in contact with the lower plate. In the FE model, the initial distance is 0.3 mm between the washer and the lower plate. When the interference fit size is 1%, the distance of the nut rising is Uz = 0.335 mm. The interference fit bolt insertion created the protruded deformation around the hole on the exit plane8–10,21 (called “protuberance”), and the deformation on the exit plane of the lower plate increased with the increase in interference fit size, so the distance of the nut rising decreased slightly with increasing interference fit size.
The third step is defined as an implicitly dynamic analysis. In this step, the bolted joint is subjected to tensile loading. One end of the joint is fixed, and a cyclic force is applied at the other end, which is F(t) = 1/3 × t kN (t = 0–30 s) and F(t) = 1/3 × (60 − t) kN (t = 30–60 s), as shown in Figure 6(a).
To ensure that the nut and bolt can form a whole part after installation and work together in tensile loading, a constraint named “tie” is imposed on them at the third step. And the technique “transferring results between Abaqus analysis” is used. First, an old job is generated to conduct the first and second steps in the FE model. Second, the tie-constraint is established, the FE model is updated, and the result of the old job is imported. Finally, a new job is generated to finish the final step.
FE model validation
In the interference fit bolt insertion, the squeeze force (Fsq) determines the hole deformation and the hole vicinity stress distribution to a certain extent, which is regarded as the object for comparison. When the interference fit size is 1.5%, Figure 7 displays the curves of the squeeze force history from the experimental and FE results. More comparisons about other interference fit sizes were described in previous studies of Jiang et al.8–10 It can be seen that the squeeze forces experienced two cycles of increase and decrease because the bolt insertion occurred in the hole and the protruded deformation created on the exit plane of the upper and lower plates.
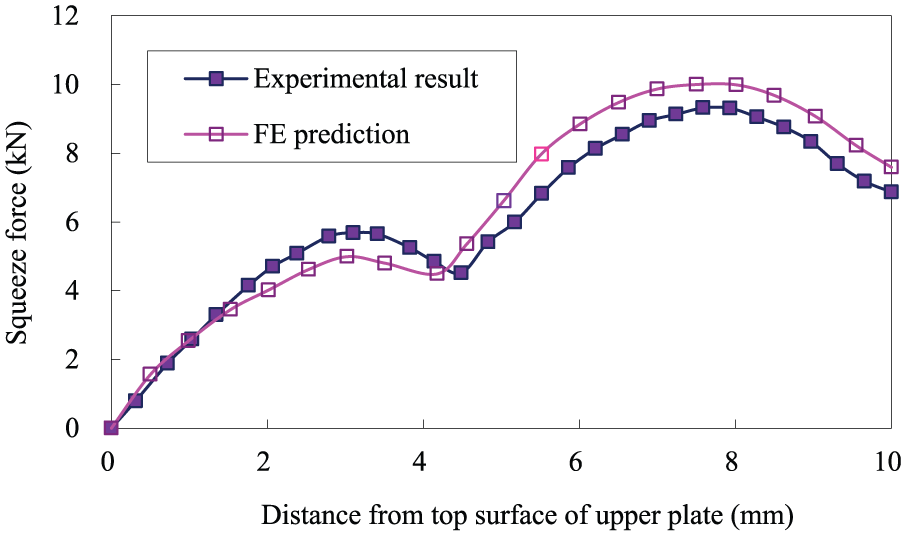
Squeeze force history from experimental and FE results (I = 1.5%).
The relative errors generate between the experimental results and FE predictions, and the biggest error is 8%. The error may occur as a result of the following reasons: in the experimental test, the hole has certain shapes and position errors, and the friction coefficient of the entire hole wall cannot be completely consistent. While in the FE simulation, the hole and the friction conditions are idealized assumptions. From the comparison of the squeeze force history, the FE prediction is basically consistent with the experimental results, so the FE simulation is accepted in the bolt insertion stage.
In tensile loading stage, when the single-lap joints are in tension, the load path eccentricity induces secondary bending of the bolted joint. Figure 8 presents the secondary bending and strain distribution from the FE prediction as the maximum tensile load is 10 kN and the interference fit size is 1.5%. As the tensile load increases, Figure 8 presents the strain variations obtained from both the experimental and FE results. The strains in G1–G6 are set to 0 at the beginning of tensile test, the experimental strain data in Figure 9 are the actual measured values, and the FE strain values are the differences between the tensioning and tensile beginning. Note from Figure 9 that the strain variation is nonlinear with the tensile load increasing. As shown in Figure 9(a) and (b), the strain values obtained from G2 and G3 are compressive, and in Figure 9(c) and (d), the strains from G5 and G6 present the compressive and tensile, respectively, because of secondary bending.

Secondary bending from FE prediction (I = 1.5%, tensile force is 10 kN).

Strain variation history at tensile loading stage (I = 1.5%): (a) G2, (b) G3, (c) G5, and (d) G6.
There is a discrepancy between the experimental result and FE prediction from the strains’ comparison in Figure 9. It could be explained by the following: (1) errors inherited from the bolt insertion and bolt clamping stage in the FE model, (2) differences existed in how the strain values were obtained that the strain is determined from a point/node in the FE model while it is averaged over the gauge area in the experiments, and (3) errors are associated with the strain gauge, for example, gauge reliability and mounted conditions. In addition, the error of hoop strain from G2 is a little larger than others. The reason may be that the bending deformation of the bolt head is very complex and produced errors in the tensile loading simulation, which affects the hoop strains (G2) in the transverse direction. It could be drawn from these strain comparisons that the FE simulation in the tensile loading stage basically reflected the actual experimental situation, and our interesting local stress and strain on faying surface around the fastener hole could be analyzed using the current FE results with reasonable accuracy.
Joint failure and FE analysis
In the test state, only three cycles of tensile loading are carried out in 10 kN, and the fatigue failure test with low cycle is not conducted. But a destructive test is carried out on the specimen with interference fit sizes of 1% and 2%. The test results present that the failure mode of the joints is bolt fracture.
When the maximum tensile load is about 27 kN, the hi-lock bolts fractured in the bolted joints. The destroyed bolt head is shown in Figure 10(a) with an arrow (I = 2%); there is no obvious damage in the Al-alloy plates of the structure. In the FE simulation, when the tensile load reaches 27 kN, the deformations and stress distributions of the bolted joint are shown in Figure 10(b). It can be seen that interference bolt connected structure produces obvious secondary bending deformation, the maximum stress (1372 MPa) appears in the root below the bolt head, and the value exceeds the tensile limit (1270 MPa) of Ti-alloy, which leads the destruction developed from the root to the top of the bolt head (shown in an arrow), and the bolted joint is failure. The maximum principal stress (also first principal stress σ1) is seen as a vector sum from the normal stress and shear stress component, and its value determines whether the structures are cracked and failure. So the maximum principal stress component is chosen for stress analysis using the FE results in this article.

Bolt failure and FE prediction (I = 2%): (a) bolt fracture and (b) FE prediction.
Parametric studies
As already introduced, some parameters have a significant influence on the stress distribution and finally on the fatigue endurance of the joints, and this paragraph aims to analyze these effects on the local stress field around the hole, especially the faying surface of the upper plate by FE simulation. The analyzed parameters are the interference fit size, clamping force, friction coefficient, joint lap geometry, and tensile load amplitude.
Interference fit size
Figure 11 shows the maximum principal stress as the tensile force is the maximum of 10 kN (bolt, washer, and nut hidden). It can be seen that as the interference fit size is 0.5%, the tensile maximum stress value is 347 MPa. When the interference fit sizes increase to 1%, 1.5%, and 2%, the maximum tensile stresses decrease to 276, 275, and 277 MPa, which are far below the Al-alloy 7050-T7451 static tensile strength (525 MPa). So the danger of structural failure is reducing with the increase in interference fit size apparently. On the hole wall, the zone of stress concentration appears at the faying position of the plates (shown with circles in Figure 11), especially at I = 0.5% and I = 1%. When the single-lap bolted joint bears the longitudinal tensile load, the shearing and secondary bending occur at the same time, and the hole vicinity in the transverse direction becomes the larger stress zone. When the interference fit sizes are 1.5% and 2%, another region of stress concentration occurs at the upper plate bottom in contact with the washer and nut (shown with arrows in Figure 11). As the interference fit size increases, the hole and bolt become a union, the tensile load does not lead to the shearing deformation, secondary bending dominates the deformation, and the nut and washer attempt to prevent the bending deformation, so another larger stress zone appeared.

Stress distributions on lap joint when tensile loading is 10 kN: (a) I = 0.5%, (b) I = 1%, (c) I = 1.5%, and (d) I = 2%.
Usually, crack nucleation occurs on the upper plate faying surface around the fastener hole during fatigue tests of the single-lap joints at the first time. Figure 12 shows the maximum principal stress distribution on the upper plate faying surface of the bolted joint. With the increase in interference fit size, the change in the maximum stress value is not obvious (shown in Figure 12(e)), but the change in the maximum stress position is significant (shown in Figure 12(a)–(d)). When the interference fit sizes are 0.5% and 1%, the position of the maximum stress is close to the hole edge. As the interference fit sizes increase to 1.5% and 2%, the positions are about 2.5 and 3.7 mm distant from the hole edge, and the direction of the maximum stress changes and forms an angle of approximate 45° with the transverse direction. The likelihood of crack nucleation first appeared in the hole decreases with increasing the interference fit size.
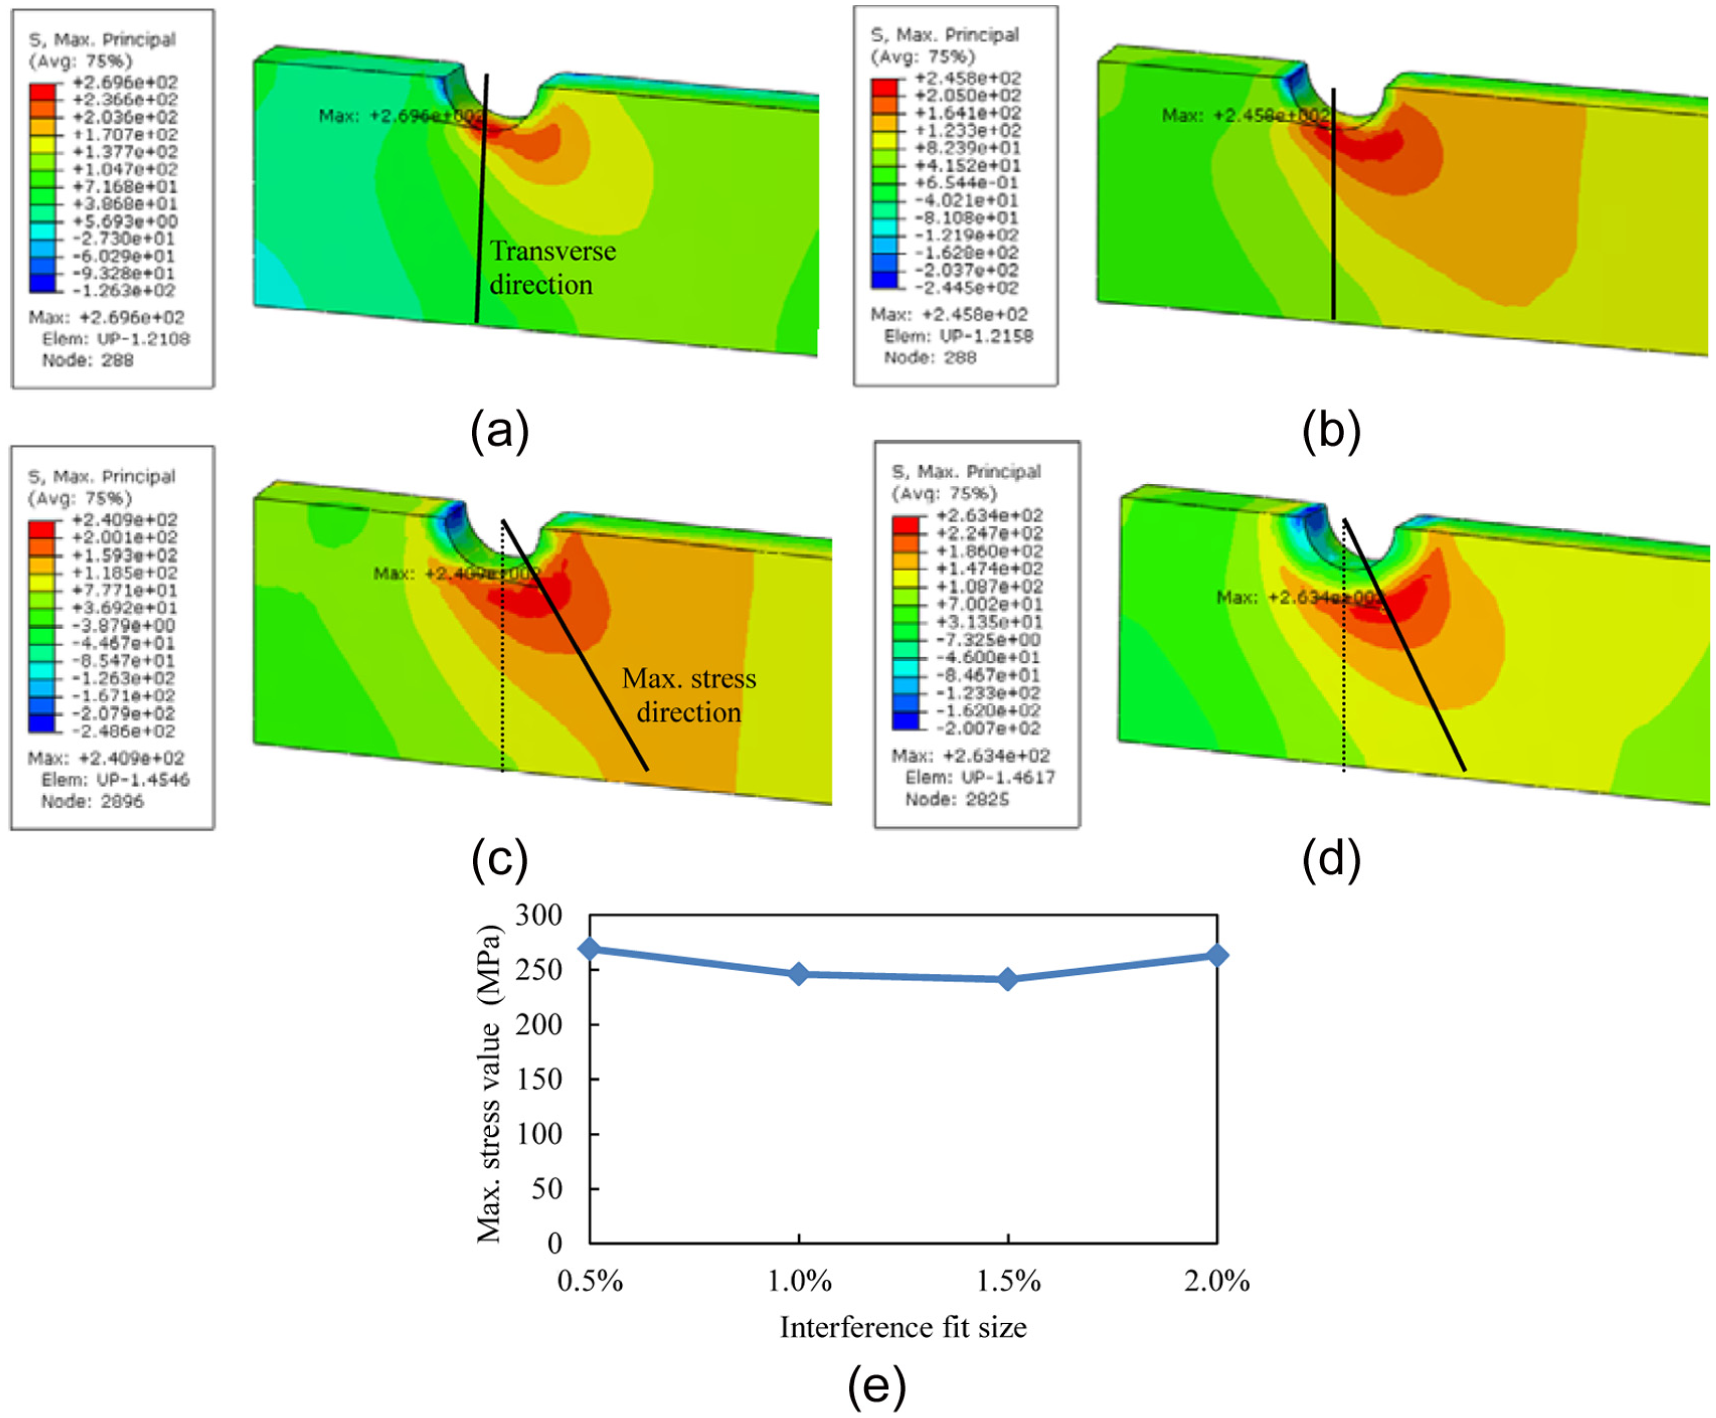
Effect of interference fit size on local stress field: (a) I = 0.5%, (b) I = 1%, (c) I = 1.5%, (d) I = 2%, and (e) stress variation.
Clamping force
In the FE model, when the interference fit size is a certain value (such as I = 1%), by modifying the nut rising distance, different clamping forces can be obtained. When the nut rising distance reaches 0.335, 0.40, and 0.45 mm (initial distance is 0.3 mm between the nut and lower plate), the average clamping pressure on the top surface of the washer is 30, 45, and 90 MPa, respectively, which is changed into the tightening torque (T) and is 3.5,5.25, and 10.5 N m, respectively.
When the interference bolted joints bear maximum tensile load of 10 kN, the maximum principal stress field of the upper plate faying surface around the hole is shown in Figure 13. Under the same interference fit size (I = 1%), different clamping force causes some difference in the maximum principal stress distribution. When the tightening torque is T = 3.5 N m, the larger stress area (circled scope in Figure 13(a)) is mainly located around the hole in the transverse direction. When the torque rises to 5.25 and 10.5 N m, the larger stress areas (circled scope in Figure 13(b) and (c)) go to the location on one side of bearing load. The position change in larger stress area can also reveal that with the increase in clamping force, the friction force between the plate increases, and the load transferred by the bolt reduces, so the tensile and bending load is mainly concentrated in the side of bearing load. Moreover, as the torque of the nut raises to 10.5 N m, due to large clamping force, the circular stress distribution on the free end connected with wisher area (arrowed in Figure 13(c)) is rather obvious. In addition, viewed from the maximum stress value (Figure 13(d)), there is little change under three kinds of clamping forces, so clamping force has little effect on the maximum stress value.
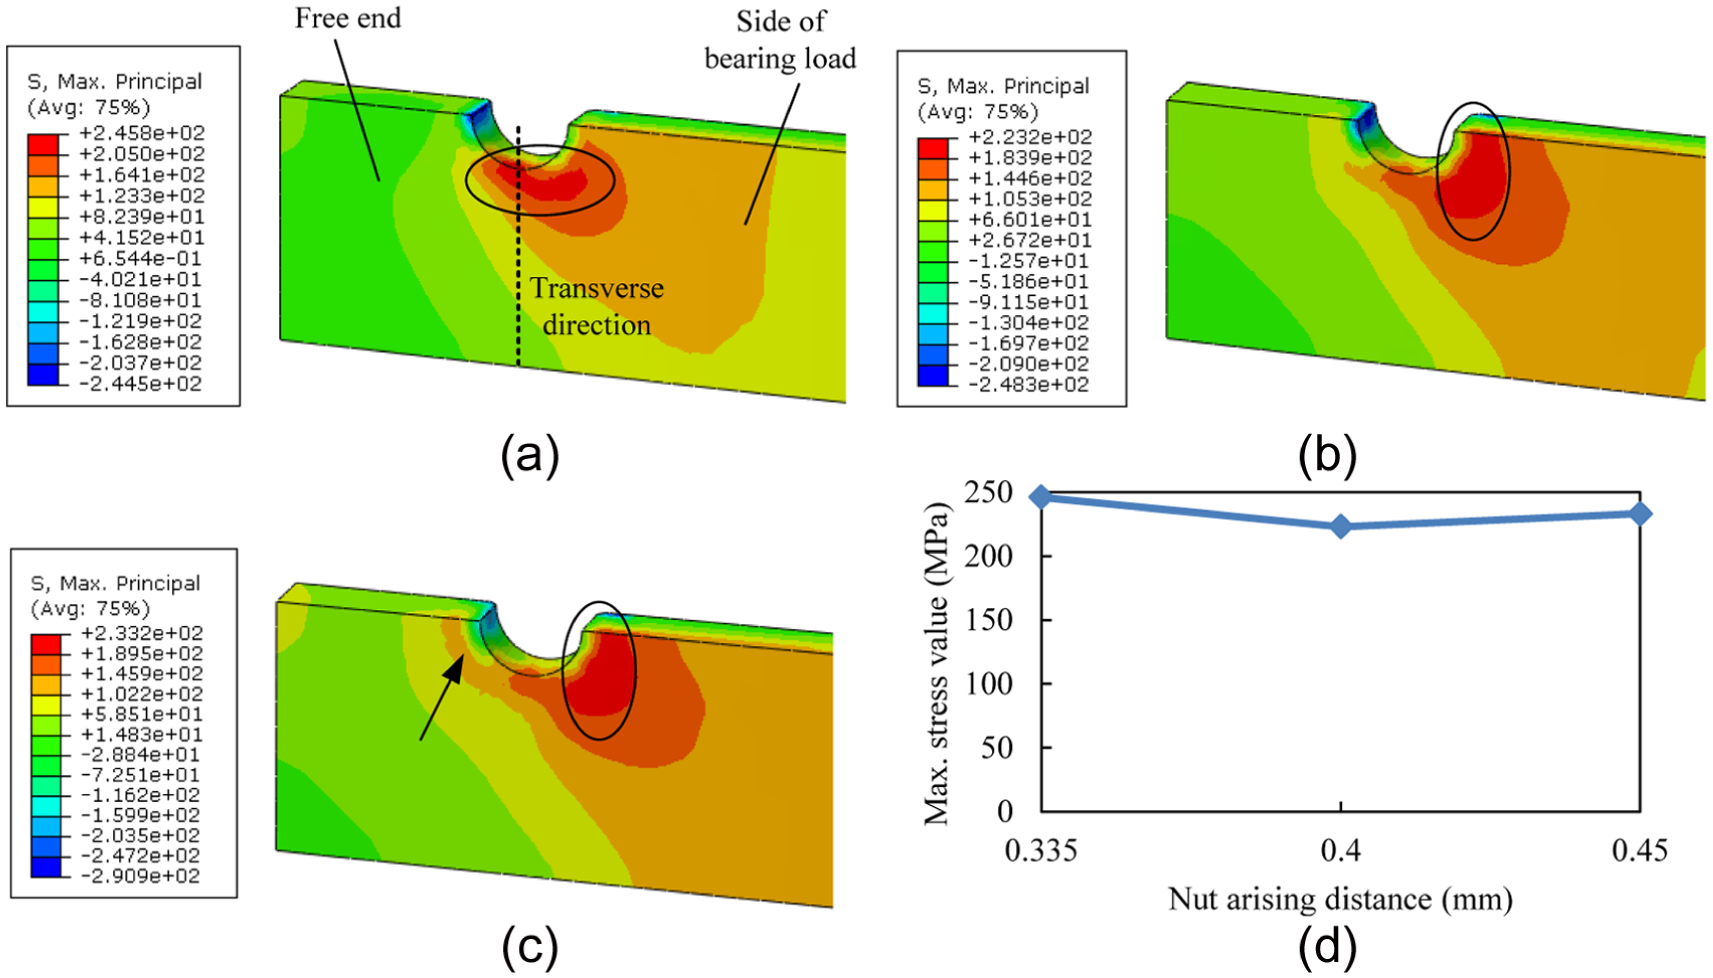
Effect of clamping force on local stress field: (a) T = 3.5 N m, (b) T = 5.25 N m, (c) T = 10.5 N m, and (d) stress variation.
Friction coefficient
The friction coefficient (f) between the plates has a certain influence on the load transfer in the process. In the initial phase of the bolted joint bearing cyclic load, the friction coefficient is small, and with an increase in cyclic times, the friction coefficient increases. A study 25 shows that friction coefficient increases gradually from 0.2 to 0.65 in the fretting fatigue tests of Al-alloy joints. In the article, there are only three cycles of tensile loading in the test, so friction coefficient of 0.2 is chosen firstly. Here it is assumed that friction coefficient changes to 0.4 and 0.6 with increasing cycle number, and the effect of friction coefficient on local stress field is analyzed.
When the interference fit size is 1% and the tightening torque is 3.5 N m, the FE simulations are carried out. When the tensile load is added to the maximum value of 10 kN, the maximum principal stress distributions on the faying surface of the upper plate are shown in Figure 14. When the friction coefficient increases from 0.2 to 0.4, the change in the larger stress area is not obvious, only slightly expanding. As it increases continually to 0.6, the position of larger stress area changes to the side of bearing load (circled scope in Figure 14(c)). In addition, viewed from the maximum stress values (Figure 14(d)), there is little change under three kinds of friction coefficients. And the effect of friction coefficient on local stress fields is similar to clamping force.

Effect of friction coefficient (f) on local stress field: (a) f = 0.2, (b) f = 0.4, (c) f = 0.6, and (d) stress variation.
Joint lap geometry
The diameters of the bolts and holes are about 8 mm, the lap geometry of bolted joint is 40 × 40 mm (L × W) in a previous analysis, and it is about five times of the hole diameter in length (L) and width (W) direction. The ratio relation is also chosen in a lot of test about lap joints.19–21 When the length increases to 64 mm and the width reduces to 32 mm, the FE simulation (I = 1%, T = 3.5 N m) is carried out to examine the effect of lap geometry on local stress field in the interference fit bolted joints.
Figure 15 presents the stress fields on the upper plate faying surfaces when the tensile load reaches 10 kN. Viewed from the stress distributions, with the change in lap geometry, the position of larger stress area is not changed. But the maximum stress value has increased apparently from 246 to 408 MPa and produces stress concentration on the hole edge in the transverse direction (circled in Figure 15(b)), which is easy to induce the fatigue crack. So the lap geometry has obvious impact on the maximum stress value and fatigue life of the connected structure.
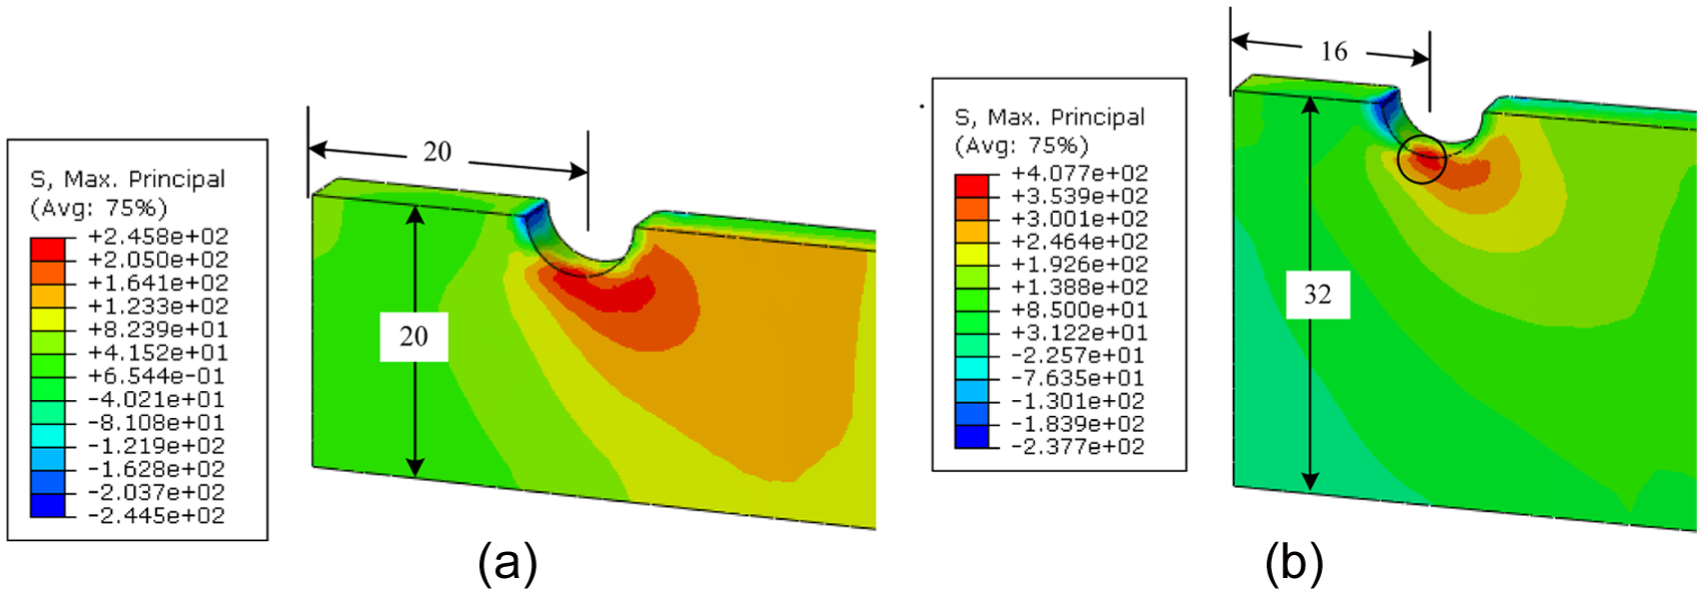
Effect of lap joint geometry on local stress field: (a) L = 40 mm, W = 40 mm and (b) L = 32 mm, W = 64 mm.
Load amplitude
The other parameters remain the same; as the amplitude of tensile load increases to 15 and 20 kN, respectively, the stress distribution on the faying surface of the upper plate is shown in Figure 16. The larger stress zone is located around the hole in the transverse direction, which is not influenced by the tensile load amplitude. But the maximum stress value increases significantly from 246 to 427 MPa when the load amplitude increases from 10 to 15 kN. As the load amplitude increases continually to 20 kN, the maximum stress value increases slowly from 427 to 478 MPa, as shown in Figure 16(d). The reason for maximum stress change maybe that at the load amplitude of 10 kN, the hole is in the elastic state, the load amplitude increases to 15 kN, and plastic deformation occurred in the hole. When the load amplitude increases continually to 20 kN, plastic deformation state occurred in the hole, so the increase in the maximum stress value is not obvious.

Effect of load amplitude on local stress field: (a) 10 kN, (b) 15 kN, (c) 20 kN, and (d) stress variation.
Conclusion
In order to simulate the entire process covering interference fit bolt installation and tensile loading stage in the single-lap joints, a 3D FE model has been developed and validated experimentally. The squeeze force history presents the character that it increases at first and then decreases. When the single-lap bolted joints with interference fit are loaded in tension, the bolted joint presents obvious secondary bending, and the stress concentration occurs around the hole on the faying surface of the lap joint.
The effect of the parameters on the stress field of the upper plate faying surface near the hole has been analyzed with a numerical approach. And the following conclusions can be drawn: with an increase in the interference fit size, the change in the maximum stress values on the upper plate faying surface is not obvious, and the occurred position moves away from the hole edge gradually. As the clamping force or friction coefficient increases, the position of larger stress area is changed to the side of bearing load from the transverse direction. The lap geometry of the bolted joint as well as tensile load amplitude has apparent impact on the maximum stress value, but have no effect on the position of larger stress area.
Footnotes
Academic Editor: Nao-Aki Noda
Declaration of conflicting interests
The author(s) declared no potential conflicts of interest with respect to the research, authorship, and/or publication of this article.
Funding
The author(s) disclosed receipt of the following financial support for the research, authorship, and/or publication of this article: The study described in this article was supported by the National Natural Science Foundation of China (grant no. 51275463).