
Abstract
The interference fit is an effective process technique to improve the fatigue life of aircraft structures. In this article, the experiments including the interference fit bolt installation and tensile loading in bolted joint were carried out. A three-dimensional finite element model was established to simulate the experimental process, and the finite element model was validated by comparing the simulated data with the experimental data of the squeeze forces and the strains. By finite element simulation and analysis, it can be concluded that the location of maximum value of the maximum principal stress on the upper plate faying surface is going far away from the hole edge with the increase in interference fit size. Furthermore, by analyzing the hoop stress variations along a prescribed path, the maximum value of the hoop tensile stress is smallest at the interference fit size of 1.5%.
Introduction
The bolted joint is one of the most important mechanical connection methods in aircraft assembly. At the junction of the main load-bearing components in the aircraft, such as wing beams, fuselage strengthen frames, and other important structural connected parts, interference fit bolted joints are widely used to improve the structural fatigue performance. 1 Because of the high strength, light weight, controlled preload, high fatigue life, and other characteristics, titanium (Ti) alloy bolts are used with as many as 40,000 in a B747 and 5500 with interference fit in a A320’s wing.2,3 In addition, interference fit bolted joints are often adopted as an important solution in aircraft repair. 4 As the interference fit fastener, Ti-alloy bolts can achieve lighter weight and longer fatigue life for aircraft structures. Residual stress around the hole, induced by the interference fit bolt insertion, plays a key role in the components’ fatigue life. However, to better understand the anti-fatigue behavior, it is necessary to conduct a comprehensive analysis of the stress and strain around the hole for the whole process of interference fit bolt inserting, clamping, and cyclic tensile loading.
Some researchers5–7 simplified the interference fit assembly as a plane strain or plane stress problem to calculate the stress distribution around the hole by using the theory of elastic and plastic mechanics. However, the above stress analysis was limited to idealized assumptions and did not consider the process of the interference fit installation. Jiang et al.8,9 have developed a two-dimensional axis-symmetric finite element (FE) model to simulate the interference fit bolt insertion process, and then analyzed the deformation and residual stress distribution around the hole. For interference fit fastened structure subjected to an external load, the studies10–16 were sufficient, but they only considered the stress analysis in the loading stage and lacked the simulation in the fastener installation stage. Usually, an even-distributed residual compressive stress was directly given at the beginning of loading in those studies. Recently, several literatures about interference fit riveting17–20 studied the hoop stress or maximum principal stress around the holes in single lap joints from the riveting process to the tensile loading stage by FE simulation, and the simulated results of riveting force and residual strain were verified by experiment. Chakherlou and colleagues21–23 simulated the entire process covering the interference fit pin or bolt insertion, bolt clamping, and cyclic loading by the FE method, which is used to explain the crack initiation phenomenon of the fatigue test. This article studies the influence of the interference fit on local stress in a single shear bolted lap joint with an interference fit in the upper and lower plates and validates the FE model by the experimental results.
In this article, first, the specimens of single lap joints for different interference fit sizes were designed, Ti-alloy hi-lock bolts were chosen, and the test of the entire loading sequence for quasi-static hi-lock bolt insertion, bolt clamping, and tensile loading was carried out. The squeeze forces in bolt insertion, the clamping torque on nut, and the strains on upper plate in the tensile loading stage were measured and recorded. Then, by using FE software ABAQUS 6.10-1, 24 a three-dimensional FE model was established to simulate the above experimental processes. The simulated results were validated by the experimental results. Finally, the hole vicinity stress distribution after interference fit bolt installation was analyzed by FE simulation. Moreover, the maximum principal stress and the hoop (circumferential) stress variation on the upper plate faying surface around the hole were studied when the joints were subjected to external load.
Experiment
Specimen information
A total of four joint specimens were designed and manufactured. Each lap joint consists of four 7050-T7451 aluminum (Al) alloy plates that are the upper plate, lower plate, and two backing plates whose thicknesses are 5 mm. The dimension of the upper and lower plates was 140 × 60 × 5 mm3, and the distance between the plate free edge and hole center was 20 mm. The specimen configuration is shown in Figure 1. To ensure the hole on the upper plate and lower one matched and was coaxial at the hi-lock bolt insertion, the two plates were pre-fastened by using four common screws M4. The tightening torque is T0 = 0.5 N m at each common screw (the total torque value is 2 N m). By the empirical formula

Specimen for interference fit bolt insertion (unit: mm).
In this article, the interference fit size was defined as

where
Ti-alloy (Ti-6Al-4V) hi-lock bolt M8 was chosen in the experiment and the four bolts with the same shank diameter of 7.97 mm were especially selected. The holes for the bolt insertion were milled by computerized numerical control (CNC) machining center. The diameters of the holes and interference fit size are listed in Table 1.
Interference fit sizes.

In the experimental test, strain gauges were employed to capture the strain variation during tensile loading. The test equipment was made by Zhejiang Measurement and Instrument Company and its type was B×120-1AA with the sensitivity factor of 1% and transverse effect factor of 0.5%. After the installation of the hi-lock bolt and nut, strain gauges 1–5 were mounted on the top surface and 6 on the bottom of the upper plate. All the gauges were positioned in the joint longitudinal direction as shown in Figure 2. The distance between the gauge centerline and the hole center was 10 mm, and the identified error was less than 0.5 mm. Strain gauges 2 and 4 were used to measure the hole vicinity hoop strains, and gauges 1 and 3 were used to measure the radial strains. The difference in the value between gauges 5 and 6 was used to evaluate the secondary bending strain in the tensile loading stage.

Strain gauge mounted on joint specimen (unit: mm).
Experimental test
As shown in Figure 3, the interference fit insertion of the hi-lock bolt was carried out on the Material Testing Machine. A supporting fixture with a central hole was placed on the base seat of the machine. In order to ensure the static or quasi-static insertion for the bolt, the squeeze speed is set to 2 mm/min. The data collecting device can measure and record the squeeze force in the insertion process with the pressure sensor.

Interference fit hi-lock bolt insertion test.
After the interference fit bolt insertion, the spring steel washer (outer diameter of 13 mm, inner diameter of 9 mm) and M8×1 common steel nut were applied for clamping. The tightening torque on the nut of every specimen was T = 3.5 N m. By
The tensile test of the bolted specimen was carried out in the multi-function testing machine, as shown in Figure 4. The testing machine (made by the Institute of Applied Mechanics, Zhejiang University) consists of the reaction frame, hydraulic power devices (YZB50-2 × 2 pump and YCD-5 jack), and force sensor (RCT-21 kN produced by Showa, and measuring error ≤0.3%). The specimen was connected with the frame by two M14 common screws and two U-shape connectors. The strain gauges on specimen connected with a dynamic strain indicator and a PC (not shown in Figure 4). In the tensile test, each specimen underwent three cycles of tensile loading. The remote maximum tensile load was 10 kN, and one cycle time was 1 min.

Tensile test and specimen in test machine.
FE simulations
Material properties
To obtain the exact elastic and plastic material properties of the lap plates and hi-lock bolt, compressive tests were performed on Al-alloy cylinder and Ti-alloy cylinder. Three tests were performed for each material, and the results of three tests were very similar; then the middle test was chosen to fit the curve. Nominal stress–strain data were directly obtained by a force–displacement curve in the test, but true stress–strain values are required in FE software ABAQUS. Using the formula

True stress–plastic strain curves.
FE model
The FE model was developed in the software ABAQUS, as shown in Figure 6. Due to the bolted joint being a symmetrical structure, the FE model takes only half of the specimen, and therefore boundary conditions were imposed in the symmetrical plane. To simplify the model, the bolt threaded section was replaced with a simple cylinder, and nut and washer were regarded as one part. The details, an arc of 2.5 mm radius and 25° at the bolt transition region (also called the import part) and a chamfer C0.6 mm at the hole entrance of the lap joint, are shown in Figure 6(c).

Three-dimensional FE model (including boundary conditions and load): (a) global model, (b) boundary conditions in insertion step, and (c) details.
The model was meshed with the hexahedral reduced elements C3D8R, which has higher computing speed and greater accuracy than the tetrahedral elements C3D4 in ABAQUS. The mesh in the hole vicinity was refined, and the mesh at the ends of the joint was coarsen.
Complicated contact friction was produced between the bolt shank and the hole wall in hi-lock bolt insertion, and a coefficient of friction of 0.1 was specified. The coefficient of friction between Al-alloy plates generally changed from 0.2 to 0.5 in fatigue test of fastened joint.13,14,16 In this test, the specimen only experienced several times of cyclic loading, so the friction coefficient of 0.2 was chosen between the upper plate and lower one in FE model.
Load and boundary conditions
Corresponding to the experimental process, the FE simulating process has three analytical steps. The first step is the interference fit bolt insertion process, which is defined as the static analysis. A reference point (RP)-1 was defined, and the coupling constraint was established on the bolt top surface. The bolt was uniformly pressed into the hole by applying a displacement condition Uz on RP-1 (using a default time of 1 s); at the same time, the squeeze force was recorded through RP-1. Other boundary conditions are Uy = 0 at the symmetry plane of the bolt and plates, Ux = 0 at both ends of the surface, and Uz = 0 (
The second step is applying the clamping force and is also defined as the static analysis. The washer and nut as a part are applied as a distance condition to obtain q = 30 MPa average pressure on the washer surface in contact with the lower plate (tightening torque of 3.5 N m). In the FE model, the initial distance is 0.3 mm between the washer and lower plate. When the interference fit size is 1%, the distance is Uz = 0.335 mm. The bottom of the bolt is fully constrained. The interference fit bolt insertion created the protruded deformation around the hole on the exit plane,5,9,23 and the deformation on the exit plane of the lower plate increased with the increase in interference fit size, so the distance slightly decreased with the increase in interference fit size.
The third step is defined as an implicitly dynamic analysis. In this step, the bolted joint is subjected to tensile loading. One end of the joint is fixed, and a cyclic force is applied at the other end, which is F(t) = (1/3 × t) kN (t = 0–30 s) and F(t) = 1/3 × (60−t) kN (t = 30–60 s), as shown in Figure 6(a).
In order to ensure the nut and bolt composing a whole part after the nut installation and before the tensile loading stage, a constraint named “Tie” is imposed on them. However, if the Tie-constraint is established and effective at first step, it cannot produce effectively at the third step. The technique “Transferring results between ABAQUS analysis” is used. First, an old job was generated to conduct the first and second steps in the FE model. Second, the Tie-constraint was established, the FE model was updated, and the result of the old job was imported. Finally, a new job was generated to finish the last step.
Results and discussion
Comparison of experimental results with simulation results for squeeze force
In the interference fit bolt insertion, the squeeze force (Fsq) generally consisted of two components, which are the deforming force of the bolt import part making the hole wall deformed and the frictional force between the hole wall and the bolt shank. The squeeze force determines the hole deformation and the hole vicinity stress distribution to a certain extent.
Figure 7 shows the history curves of the experimental and simulated squeeze forces for the hi-lock bolt insertion as the interference fit sizes is 1.5%. It can be found that the squeeze forces do not increase linearly as the plate thickness increases and experience two cycles of increase and decrease. At first, the squeeze force increases nonlinearly as the hi-lock bolt is pressed into the hole. When the bolt import part approaches the hole exit of the upper plate, because of the protruded deformation,8,9,23 the deforming force component decreases gradually. Then, as the bolt is continually pressed into the lower plate hole, another cycle of the squeeze force variation occurs. Finally, at the end of the insertion, all that remains is the frictional resistance force.

Squeeze force history from experimental and FE results (I = 1.5%).
The maximum squeeze force of experimental tests and FE simulations under four different interference fit sizes are presented in Table 2. The relative error between the experimental and simulation results is calculated, and the maximum error is 8%. The errors could be caused by a number of reasons. In the FE simulation, the friction conditions are based on idealized assumptions, and the bolt is completely vertical to the surface of plats when pressed into the holes. In the experimental test, the friction coefficient of the entire hole wall cannot be completely consistent, the hole may have form and position errors, and the hi-lock bolt may produce tiny deflections in the pressing process. From the comparison of the squeeze force history and maximum value, the test results are basically consistent with the simulation results, so the FE simulation results are confident in the bolt insertion stage.
Maximum squeeze force peak from experimental and FE results.
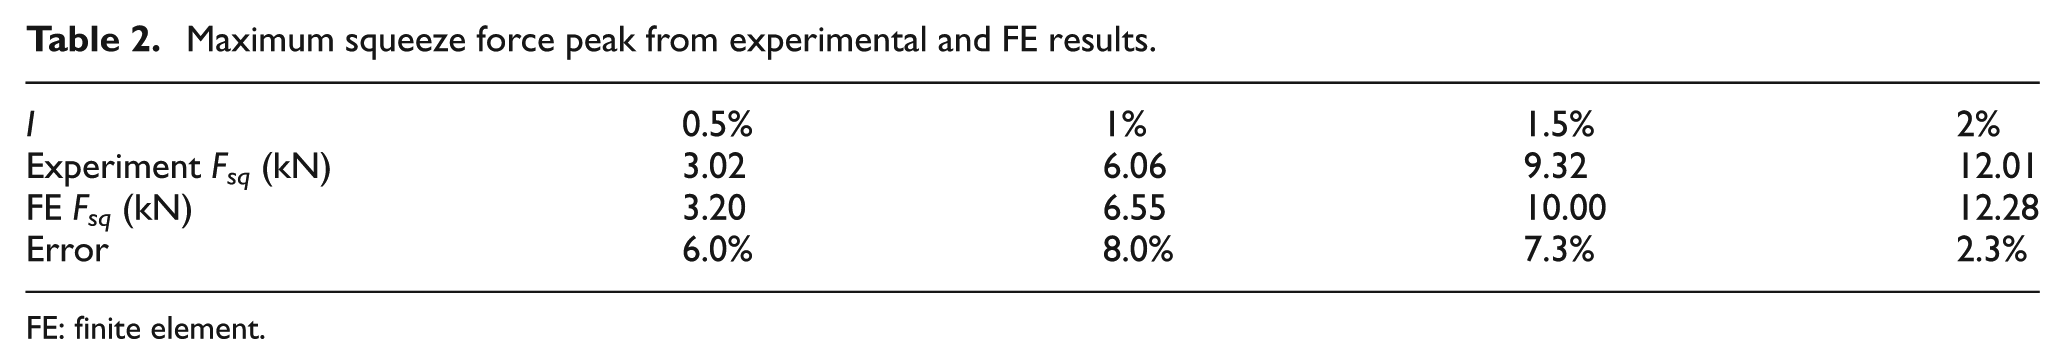
FE: finite element.
It is important to understand how sensitive the squeeze force is to the friction coefficient of the contact surface between the bolt shank and the wall of the hole, so additional FE simulations under three different friction coefficients were conducted. As shown in Figure 8, the effect of the friction coefficient has a direct effect on squeeze force, and the squeeze force increases rapidly as the friction coefficient increases. As seen in Figures 7 and 8, the simulated squeeze force with the friction coefficient of 0.1 is most similar to the test results, so 0.1 is adopted as the friction coefficient in the FE model.

Effect of friction coefficient on squeeze force (I = 1.5%).
Comparison of experimental results with simulation results for strains
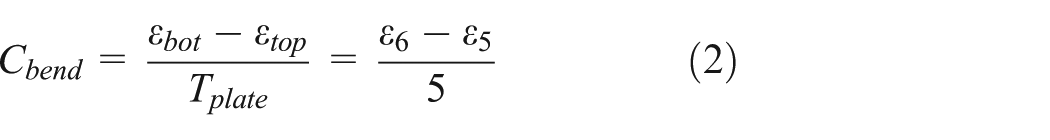
As expected, the load path eccentricity caused secondary bending when the single lap bolted joints are in tension, which influenced the fretting fatigue seriously in the single lap joint. Figure 9 shows the secondary bending and strain distribution from the FE prediction when the tensile load is 10 kN and the interference fit size is 1.5%. G5 and G6 were located near the joint overlap end at the upper plate top surface and bottom surface, and the locations usually generate the maximum bending in the single shear lap joint. In this article, strains in G5 and G6 are used to estimate the secondary bending. The bending level is presented by the curvature determined by subtracting the strains measured with G5 and G6 and then dividing the plate thickness

Secondary bending from FE prediction (I = 1.5%, tensile force is 10 kN).
When the interference fit size is 1.5%, Figure 10 shows the strain variations during the tensile loading stage obtained from both the experimental and FE simulation results. Because the strains in G1–G6 were set to 0 before the tensile test, the experimental strain data in Figure 10 are the actual measured value, and the simulated strain data are the differences of strain during and before the tension. It can also be seen that the strain changes nonlinearly with the increase in the tensile load. G2 and G3 were mounted on the upper plate top surface to measure the hoop strain and radial strain variation around the fastener hole, and the strain is compressive because of the secondary bending as shown in Figure 10(a) and (b). G5 and G6 were used to measure the longitudinal strain variation and to show the secondary bending, and the strains are compressive and tensile, respectively, as shown in Figure 10(c) and (d).

Strain variation history at tensile loading stage (I = 1.5%): (a) G2, (b) G3, (c) G5, and (d) G6.
When the tensile load reached the maximum value of 10 kN, Tables 3 and 4 listed the maximum strains of G2, G3, G5, and G6 from the experimental and simulated results under different interference fit sizes. It can be seen from Table 3 that the experimental secondary bending strain curvature of the upper plate middle plane is about 540 e−6/mm, and the simulated data are approximately 480 e−6/mm. The simulated results were slightly smaller than the experimental results. It was found that the bending strains were little related to the interference fit sizes, which were closely related to the joint overlap length, the plate thickness, and width that have been presented in other studies.13,25 In Table 4, by comparison of the experimental and simulation results, the relative errors for the radial strain of G3 were less than 14%, but the maximum error for the hoop strain of G2 was closely reached at 30%. The similar conclusions were also reached in some of the relevant literatures.17,18 The reason may be that the bending deformation of the bolt head is very complex and produced errors when the tensile loading simulation was conducted, which affects the strain value in the direction of G2 (and G4). Furthermore, as the interference fit size increased from 0.5% to 1.5%, the strain values also increased, but the strain values decreased as the size continually increased to 2%, which is related to the elastic–plastic deformation states of the holes in bolt insertion stage under different interference fit sizes.
Secondary bending curvature.

FE: finite element.
Strain peak of G2 and G3.

FE: finite element.
The discrepancy between the experimental and simulation results could be explained as follows: (1) there were inherent errors in the FE model from the bolt insertion to bolt clamping stage. (2) Differences existed in how the strain values were obtained. The strain was determined from a point/node in the FE simulation while it was averaged over the gauge area in the experiments. (3) Errors were associated with the strain gauge. For example, gauge reliability and gauge mount conditions. It could be drawn from these strain comparisons that the FE simulation in the tensile loading stage basically reflected the actual experimental situation, and the local stress and strain on the hole wall and the faying surface between the upper and lower plates could be analyzed by using the current FE results with reasonable accuracy.
Stress distributions
In ABAQUS, the minimum principal stress is used for viewing the residual compressive stress in the entity, and the maximum principal stress is used to examine the tensile stress. Figures 11 and 12, respectively, show the full-field contours of the minimum principal stress after the hi-lock bolt insertion and the maximum principal stress when the tensile force was the maximum of 10 kN (bolt, washer, and nut hidden).

Stress distribution after interference fit bolt insertion (bolt and nut are not shown): (a) I = 0.5%, (b) I = 1%, (c) I = 1.5%, and (d) I = 2%.

Stress distribution on lap joint when tensile loading was 10 kN: (a) I = 0.5%, (b) I = 1%, (c) I = 1.5%, and (d) I = 2%.
It can be observed from Figure 11 that the residual stress was compressive on or around the fastener hole after the bolt insertion. With the increase in interference fit size, the maximum value of compressive stress also increased. Compressive residual stress can effectively resist the fatigue crack initiation and propagation, so with the increase in interference fit size, the fatigue life may be improved more. On the fastener hole wall, the stress distribution was interesting for different interference fit sizes. When the interference fit size was 0.5%, the compressive stress was distributed uniformly. For the interference fit size of 1%, a bigger compressive stress (370 MPa) occurred at the hole entrance on the upper and lower plates. As the interference fit sizes increased to 1.5% and 2%, the bigger stress (420 and 470 MPa) positions moved to the middle and exit positions of hole (shown with arrows in Figure 11).
The maximum principal stress is one of the most important components in the study of crack nucleation and structural failure when the joint was in tension. It can be seen from Figure 12 that as the interference fit size was 0.5%, the tensile maximum principal stress value was 347 MPa. When the interference fit sizes increased to 1%, 1.5%, and 2%, the maximum tensile stress decreased to 276, 275, and 277 MPa, which was far below the Al-alloy 7050-T7451 static tensile strength (525 MPa). On the hole wall, the stress concentration region appeared at the faying position of the plates (shown with circles in Figure 12), especially I = 0.5% and I = 1%. When the interference fit sizes were 1.5% and 2%, another region of stress concentration occurred at the upper plate bottom contacted with washer and nut (shown with arrows in Figure 12).
Usually, crack nucleation occurs the first time on the upper plate faying surface around the fastener hole during fatigue tests.17,18Figure 13 shows the maximum principal stress distribution on the upper plate faying surface of the bolted joint. With the increase in interference fit size, the maximum stress values decreased. When the interference fit sizes were 0.5% and 1%, the position of the maximum stress was close to the hole edge. As the interference fit sizes increased to 1.5% and 2%, the positions were about 2.5 and 3.7 mm away from the hole edge, and the direction of maximum stress and the transverse direction formed a 45° angle.
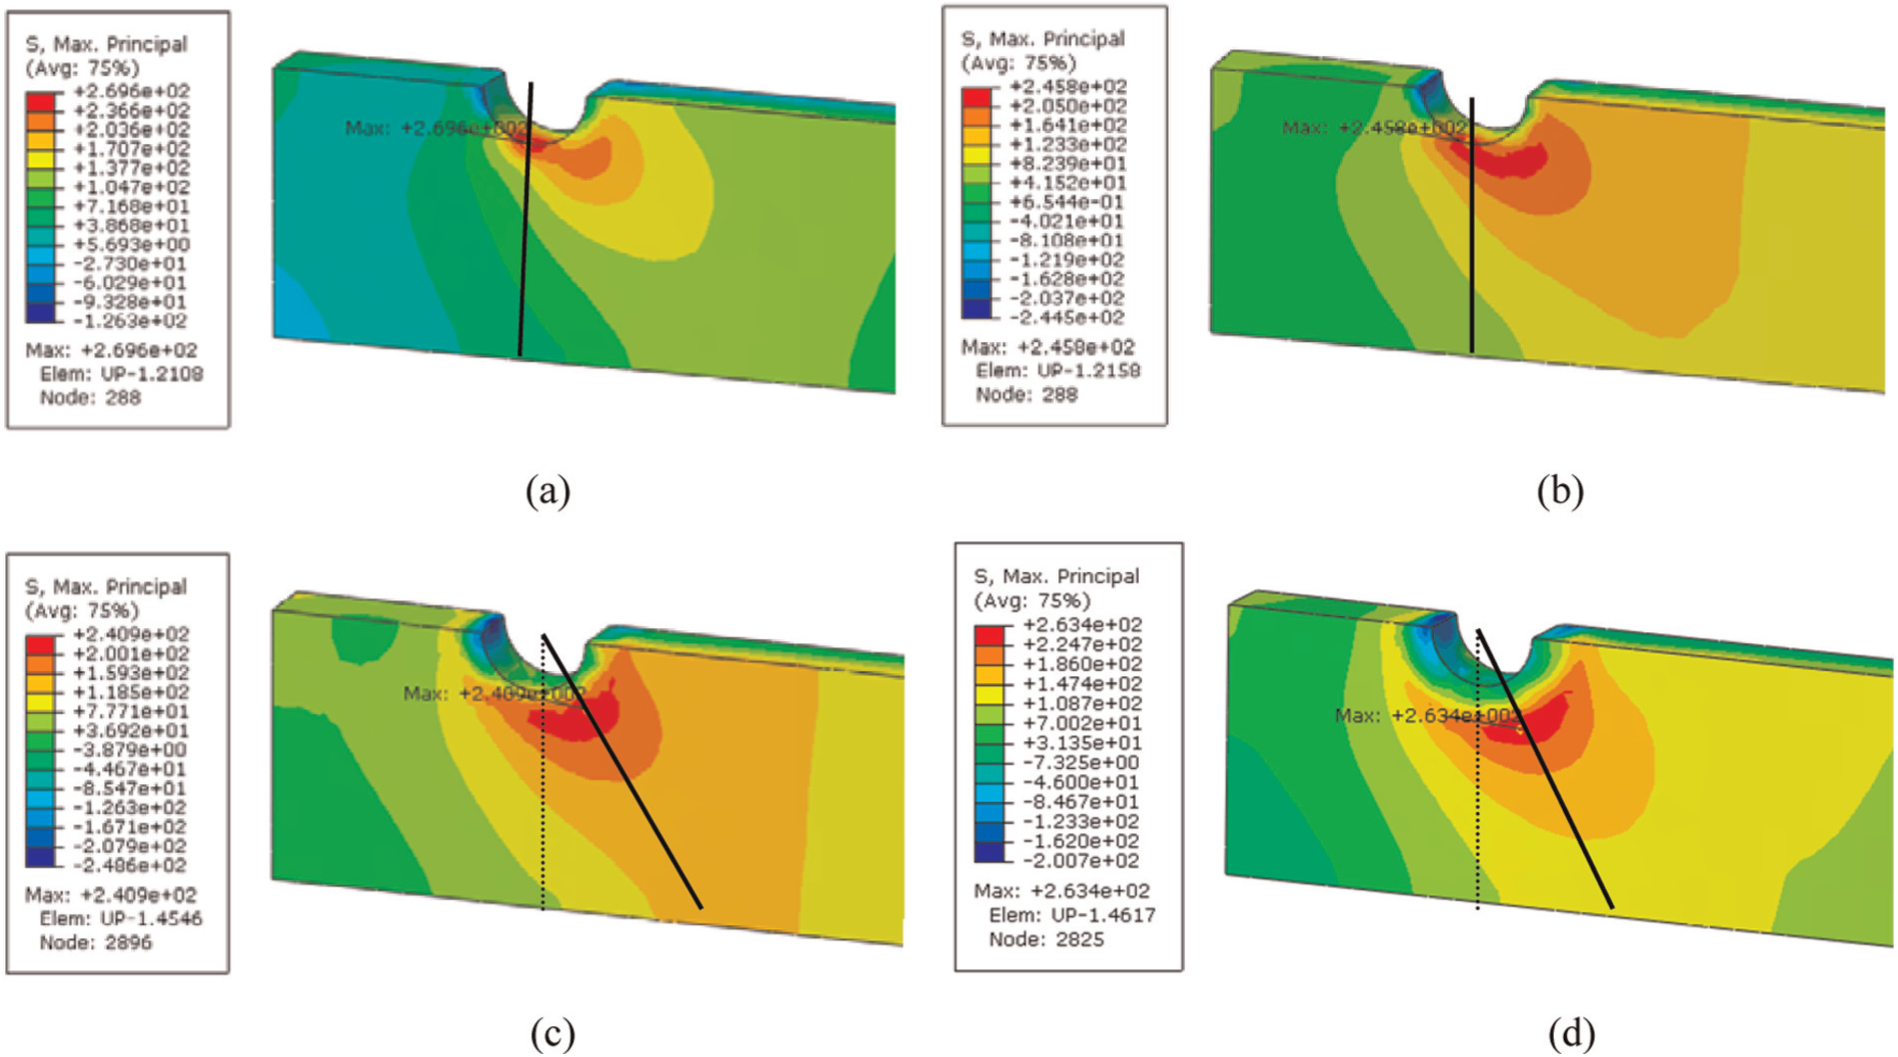
Stress distribution on faying surface of upper plate: (a) I = 0.5%, (b) I = 1%, (c) I = 1.5%, and (d) I = 2%.
Hoop stress variation
Net-section failure is a main mode of fatigue damage in the fastened joint. Hoop stress around the fastener hole along the transverse direction would be a major component resulting in fatigue crack nucleation and growth. The hoop stress or strain on the upper plate faying surface is difficult to measure by the traditional test method, so FE simulation is a good way for hoop stress evaluation and analysis. Figure 14 shows the simulated hoop stress variation along the transverse path on the upper plate faying surface under two different tensile loads 0 and 10 kN.

Hoop stress variation along transverse path on faying surface of upper plate: (a) when tensile load was 0 kN and (b) when tensile load was 10 kN.
Figure 13(a) shows the hoop stress variation at the tensile beginning (also after the bolt insertion and bolt clamping). It can be seen that the tensile stress was produced on the hole edge and hole vicinity at a low level of interference (0.5% and 1%). When interference fit sizes were bigger (1.5% and 2%), residual compressive stress was produced around the hole (within 1 and 2 mm). Furthermore, the maximum hoop stresses were all tensile and increased with the increase in interference fit size, but the position of the maximum value was gradually further away from the hole edge. What is worth mentioning, the bolt clamping force (tightening torque) is the same under four interference fit sizes, and the difference in the hoop stress variation at the tensile beginning for interference fit sizes is mainly caused by the interference fit insertion.
Figure 14(b) shows the hoop stress variations when the tensile load was 10 kN. It indicates that the residual hoop stress in the interference fit installation directly influenced the stress in the tensile loading stage. With the increase in interference fit sizes, the hoop stress decreased on the hole edge, and it implies that the danger of fatigue cracks initiating on the hole edge was reduced. The position of the maximum tensile stress was basically the same as the position before tensile loading, and the maximum value decreased gradually with the increase in interference fit size. The maximum hoop tensile stress was smallest when the interference fit size is 1.5%, which increases as the interference fit size increases to 2%.
The above results show that the stress distribution on the hole wall and upper plate faying surface depends on the fit interference size and it does not give rise to a more interesting stress distribution when interference fit size is more than 1.5%. In another research of the Jiang et al., 9 it showed that the protuberance at the hole exit surface is increased rapidly when the interference fit size goes over 1.5%, and the protuberance can harm the fretting strength seriously. Therefore, for Ti-alloy (Ti-6Al-4V) hi-lock bolt, the optimal interference fit size beneficial to the fatigue crack nucleation is 1.5% and can be chosen as an optimal value in aircraft interference assembly.
Conclusion
Based on the analysis, the following conclusions can be drawn:
In the interference fit hi-lock bolt insertion, because of the protruded deformation at the hole exit plane, the squeeze force history generates the cycle of first increases and then decreases. By comparing the experimental and simulation results of the squeeze force, the FE model in the insertion step was validated.
In the tensile stage of the single shear bolted lap joint, strain values were presented as compressive on the top surface and as tensile on the bottom surface of the upper plate, which showed the occurrences of secondary bending. The strains (G5 and G6) near the overlap end were independent on the interference fit size, and the strains (G2 and G3) around the hole were related to the interference fit size. By comparison of the experimental and simulation results of the strain, it indicates that the FE simulation can basically reflect the actual tensile test.
After the interference fit bolt insertion, there is mainly a compressive stress in the hole vicinity, and with the increase in interference fit size, the bigger compressive stress values moved from the hole entrance to the exit. When the bolted joint was loaded with tension, the stress concentration occurred around the hole on the faying position in the transverse direction. The maximum tensile values of the maximum principal stress on the upper plate faying surface decreased and the position was gradually further away from the hole edge with the increase in interference fit size.
By analyzing the hoop stress component on the upper plate faying surface in the specified path, the hoop stress variation in the interference fit installation affected the stress variation trend in the tensile loading directly. Furthermore, when the interference fit size was 1.5%, the maximum value of the hoop tensile stress was the smallest, so the interference fit size of 1.5% can be chosen as an optimal value in aircraft interference assembly.
Footnotes
Academic Editor: Elsa de Sá Caetano
Declaration of conflicting interests
The authors declare that there is no conflict of interests regarding the publication of this article.
Funding
This work was supported by the National Natural Science Foundation of China (grant no. 51275463).