
Abstract
This article presents a study about the lateral force which produces the failure by deformation between asperities with the sine profile. This study begins with obtaining this force with experimental tests and numerical simulations by the finite element method, which shows good correspondence. The formulation of an analytical procedure to calculate the lateral force is also presented. This formulation is based on the theory of Hertz, which considers lateral contact between asperities, which causes deformation and eventually the failure. The results obtained by this method are compared to the results from tests and simulations using materials with different values of elasto-plasticity. The analysis of results shows the differences between analytical formulation and experimental data, according to which an empirical equation is formulated, whose results improve the approximation to the experimental data. The simplicity of the empirical equation formulated and adequate representation by the results of this, in tests and simulations, make it a numerical model useful for studies of surface wear.
Introduction
A large number of mechanical components, in the industry, transmit forces through contact. This infers that surface characteristics of mechanical components have wide application and importance in mechanical design. Because of this, it is related to multiple effects of tribological phenomena present in contact regions of components.
For studies of friction and wear, the surface topography plays a very important role. The size and number of corrugations and roughness asperities composing contact surfaces determine charge distribution on the surfaces. This has a direct influence on response to friction, wear, and sliding temperature, present in the contact pairs.
Historically, surface quality of mechanical elements has been determined by parameters such as roughness average and standard deviation, which are the characteristics of roughness in linear measurements. With this information, we have proposed models of geometric representation for tribological studies. One of the first models to represent surface topography was made by Greenwood, 1 which considered asperities with spherical tips with same radius and random heights within a Gaussian distribution. The approach of asperities with spherical tips has since been commonly used, as shown in many works, such as Sellgren and Olofsson, 2 Kligerman, 3 Kogut and Etsion,4,5 Adams and Müftü, 6 Sahoo and Ali, 7 and Sepehri and Farhang. 8 Recurrent use in scientific research on model of spherical roughness is due to model’s simplicity, whose expressions are based on contact theory of Hertz; however, it is a model that does not consider the medium length, geometric parameter, as the element affecting the strength and stiffness of asperities. Furthermore, Põdra and Andersson 9 considered that a surface can be described by the rolling curve section or Abbott curve. This model replaces the surface topography by a single two-dimensional roughness. Petre and Tudor 10 considered a model with a sharp tip roughness with various opening angles. Jamari and Schipper 11 and Jamari et al. 12 presented a process wherein the shape of the roughness is determined by transforming it by one with a paraboloid shape. Another way to represent the roughness is by means of the Bezier curves applied over the surface measurements, as shown in the works of Bandeira et al. 13 and Bedolla et al. 14
In recent studies, such as Persson, 15 Goedecke and Mock, 16 Müser, 17 and Wriggers and Nettingsmeier, 18 it has been proposed that periodic functions, such as sine or exponential, have better correspondence with surface topography, whose replication models consider both amplitude and length of roughness. These models replicate surfaces at multiple scales, in a continuous way and proportional to a fractal parameter with a Gaussian distribution of asperities. For example, Buczkowski et al. 19 used fractal theory in order to study the normal contact stiffness of rough surfaces where the asperities’ geometry was constructed with the Weierstrass–Mandelbrot function.
Relative to study of contact between asperities, with the sine profile, most studies have focused on obtaining actual areas and pressures considering elastic surface contact primarily with initial contact at the top of the asperities, examples are works in Persson, 20 Persson and Tosatti, 21 Ciavarella et al., 22 and Nyqvist et al. 23
Complementing the idea of initial contact at the top, in this article, we consider lateral contact as another probable contact form when a pair of asperities coincides; so, it is a primordial condition of study.
Therefore, in this article, Hertz theory for general profiles is used on asperities with the sine profile, to define a method in order to determine the failure caused by deformation in contact between asperities. These asperities are analyzed in terms of lateral contact, considering the probability of existence of different overlaps at the beginning of the contact.
In the first part of the work, the general conditions of the numerical simulations by the finite element method are shown and then the description of experimental tests is shown. With the results from simulations and tests, a comparative study is done. Next, the analytical method is described, and later, the formulation of an empirical equation is established. Finally, the analysis of results is presented.
Tests and simulations of deformation in asperities
To obtain the lateral force which produces failure by deformation, a series of tests and finite element simulations were performed, in which the deformation and material failure of asperities are studied.
For this study, the asperities are considered of equal size, whose amplitude and length are 4 and 12 µm, respectively, with the same orientation and the same material. These were subjected to the lateral contact in different positions, to verify the forces and deformations in order to understand the possible failure pattern and to obtain the variation in magnitude of forces and deformations that occur with respect to the top of the asperity. The asperity’s slope depends on the manufacturing process performed on the surfaces, and Váradi et al. 24 obtained values from 2.75° (grinding) to 10.55° (spark eroded) in metals whose amplitude = 4 µm and mean lengths = 83.275 and 21.47 µm, respectively. In this work, the value of 18.41° is used (length = 12 µm and amplitude = 4 µm) for the purpose of facilitating to obtain the results in both simulations and tests under the assumption of the continuous medium that allows to set and parameterize the response of the lateral contact for any desired slope.
Simulations by finite elements
To perform simulations by finite elements, the commercial software Abaqus was used, Dassault Systèmes; 25 by means of this software, we can define the mesh on sinusoidal geometry; set the master-slave contact conditions; configure the parameters of materials, elastic and plastic; and obtain contact response in terms of reactive forces, contact pressures, stresses, and strains of the asperities.
Both the experimental part and the numerical part used the same materials, whose characteristic values are given in Table 1. The friction coefficient used was µ = 0.3.
Materials used in contact between asperities.

Various lateral positions of contact are considered, in order to verify the variation of load required to deform and detach material, and these are located near to the top, which is the origin of the coordinate system according to Figure 1. Such positions are as follows: (0.4, −0.044, 0), (0.8, −0.173, 0), (1.2, −0.382, 0), (1.6, −0.662, 0), (2, −1, 0), and (2.5, −1.482, 0).
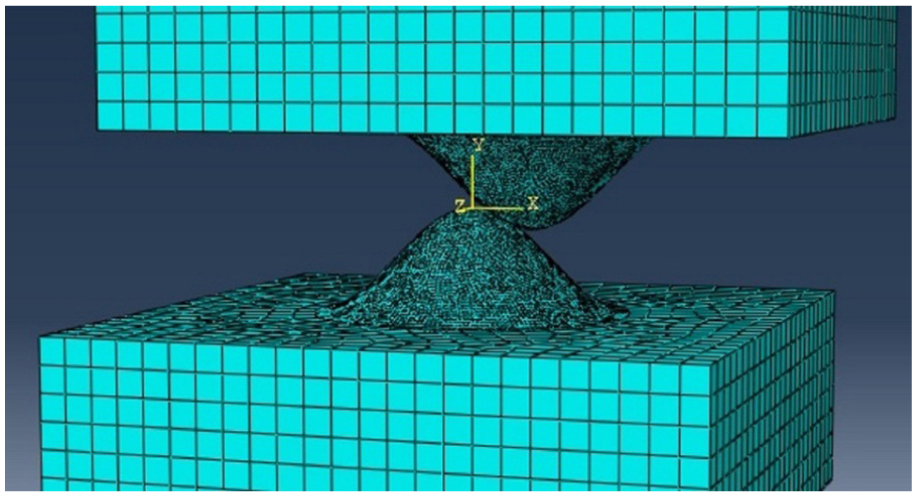
Discretization of a three-dimensional asperity with the sine profile.
It is generally known that the finite element method is used for ease of introducing domains of complex calculation in two or three dimensions, and for reasons of accuracy, the meshes with the greatest possible number of elements are used. This study uses a discretized three-dimensional (3D) model, with 35172 hexahedral elements and 46805 nodes, as shown in Figure 1, with the highest density of nodes in the vicinity of the sine profile in order to obtain a better approximation to the failure pattern.
Here, C3D8 elements which consist of hexahedral elements with eight nodes with a linear behavior were used; although being less accurate than the elements with a quadratic behavior, these support a high deformation with lower risks of no convergence. Using the peak stress component 26 the criterion of convergence, which is shown in equation (1), is applied.

where n represents the serial number of model, the nth model has finer mesh than (n − 1)th one, and when the relative error of two peak contact stresses depresses <5%, it concludes that the stress solution is converging.
The calculation of stresses and displacements in Abaqus is performed using a Lagrangian formulation. In the contact zone, the basic coulomb friction, with isotropic friction and penalty formulation, is employed. Using the Gaussian quadrature, Abaqus evaluates the response of the material at each point of integration in each element.
Lateral force obtained by tests
Due to technological limitations in the manufacturing and the experimental set of microscopic elements, assays are performed with pieces with dimensions in millimeter and loads in Newton, while the simulations were performed with dimensions in micrometer; thus, for comparison, the Pi-Buckingham theorem was used, 27 where the use of dimensionless monomials for interpreting data in the micrometer scale, on which lies the phenomenon of surface wear, is made to establish the scaling coefficients. In the case of longitudinal dimensions

where xm is the transverse coordinate in the test model (in mm) and x is the coordinate of the model in the scale of interest (in µm). Relative to material properties

The elastic moduli of model testing and model at the scale of interest (

Thus, the assay values of Newton correspond to micronewton in the simulations.
To perform the test, a universal testing machine (SHIMADZU AG-IC 100 kN) was used; this has a load capacity of 100 kN. For this purpose, a device is designed for mounting on flat jaws of the machine, considering a tensile test. The device consists of three parts (Figure 2): first, a holder to mount a stationary asperity, which contains a mobile base driven by a screw to carry the contact between asperities with the desired overlap in the direction of asperity amplitude; second, another support for a mobile asperity; and third, a guide, being of flat walls, to eliminate side clearance of the jaws. The three parts were made with steel 4140. The asperities are mounted by means of a threaded joint. The guide, being of flat walls, presents a difficult in centering between the supports of both asperities, compared with a cylindrical guide, since it must control two dimensions rather than one; however, there is greater ease of sliding and is easier to create a cavity for the mobile base and, therefore, calibrate the overlaps between the asperities on a guide of flat walls. Furthermore, the fastenings of the supports against the jaws are made with flat walls because these ensure greater clamping surface, compared to the cylindrical jaws of the machine (4800 mm2 instead of 3770 mm2).

Device for testing contact between sine asperities: (A) support for stationary asperity, (B) support for mobile asperity, and (C) guide.
Comparison between numerical and experimental results
Here, the correspondence between the simulations and experiments in the deformation process due to the lateral force is shown. Regarding simulation model, Figure 3 shows how the transport of material is increased as the overlap is increased in the contact between aluminum asperities. Similarly, this occurs in steel and nylamid asperities. From the tests, it was found that due to the effect of plastic deformation of the material, there is a transferred material toward the opposite end to the beginning of contact, causing a fold, which increases as the overlap increases, particularly in asperities made with aluminum and steel (Figure 4). From the samples, only the aluminum from overlapping coordinate (1.6, −0.662) showed material fracture at the opposite end to the contact point, taking as terminal point, the base of the fold. Figure 5 shows an asperity after suffering deformation and fracture, and its shape is similar to the initial sine profile but with smaller amplitude, which could give the idea for subsequent contact processes that could model the asperity by the same way with the corresponding reduction in amplitude.

Plastic deformation when two aluminum asperities in contact are subjected to a lateral force starting from the coordinates of overlap: (a) (0.8, −0.173, 0) µm, (b) (1.6, −0.662, 0) µm, and (c) (2.5, −1.482, 0) µm.

Asperities deformation in lateral contact: (a) aluminum with overlap in (0.8, −0.173, 0) and (b) steel with overlap in (1.6, −0.662, 0).

Fractured asperity made of aluminum whose initial contact position was (1.6, −0.662, 0).
Regarding lateral forces (see Figure 6), higher values were obtained in the asperities of the tests, especially when there is a greater overlap in the contact; the most notable difference was in the asperities of nylamid valued at approximately 7%. This difference is thought to be due to the frictional force generated between the walls of the guide and the asperity support, which as mentioned is constructed to preclude separation of the asperities due to side clearance of the jaws.

Lateral forces which cause the failure by deformation.
Analytical method for computing the lateral force
To find fault condition in lateral contact between asperities, the process of elastic–plastic deformation for a lateral force, FL, is considered (see Figure 7). The process begins with the first contact at point where the initial elastic deformation starts. The contact plane has a variable inclination angle ϕ. With increasing load, the contact area will increase up to a value at which plastic deformation starts. In this condition, when there is a further increase in load, a maximum apparent area is reached and the contact angle will vary, tending to the horizontal plane. Simultaneously, sliding between contacting surfaces occurs, which gradually reduces the contact area until separation between asperities occurs.
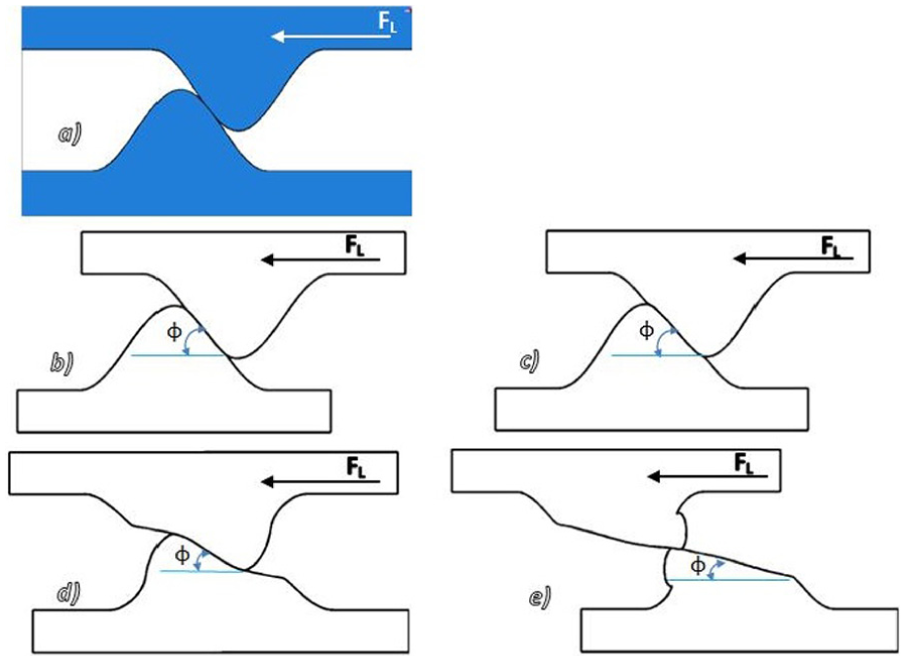
Deformation process between a pair of asperities with the sine profile: (a) start of contact, (b) elastic–plastic deformation in the initial stage, (c) deformation with a maximum contact area, (d) deformation with reduced area and reduced inclination of contact plane, and (e) previous stage to separation of asperities.
Under these considerations, it is proposed that lateral force causing failure of asperities in contact depends on (a) normal force required to reach a maximum apparent contact area and (b) adhesion–friction, which limits slippage. Subsequently, the maximum value of apparent contact area will be corrected according to deflection caused by load FL. This condition avoids that the maximum value is reached.
To obtain required value of normal force, geometric relationships that condition the slope and the contact area, along with the material properties, are determined.
Relative to the reference frame (Figure 8), the top of the asperity is defined as the origin of the coordinate system. The relationship between transverse and longitudinal coordinates is given by equation (2)

where 2Δ represents asperity amplitude; f is the circular frequency, calculated as f = 2π/λ; y is the vertical coordinate on the sine profile; x is the transverse coordinate in that profile; and λ is the length of asperity.
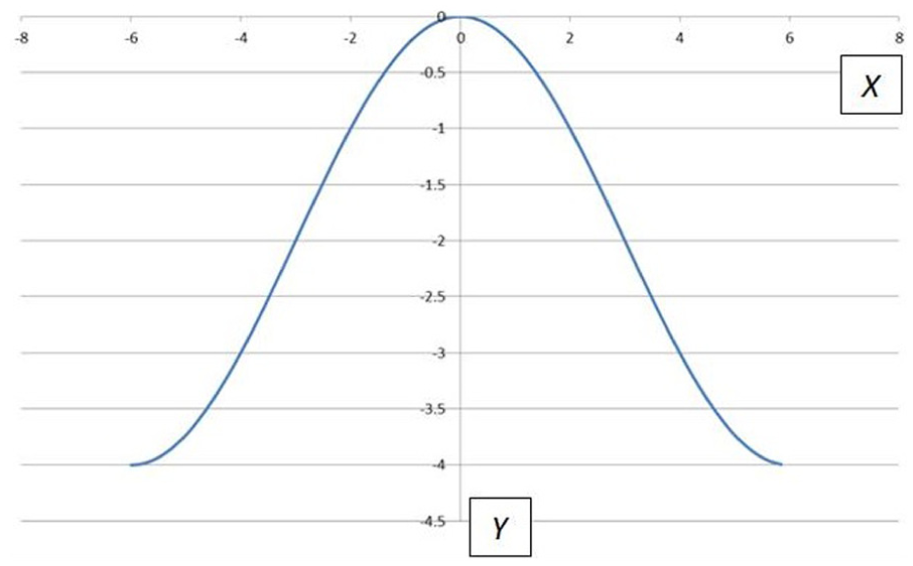
Coordinate system for location of lateral contact positions on the sine asperity.
The angle, θ (Figure 9(a)), of contact’s normal direction with respect to the horizontal line is calculated by equation (3)

where x is the transverse coordinate on the sine profile, in which, the initial contact is presented. The derivation of equation (3) is described in Appendix 1.

Lateral contact between asperities: (a) contact forces and (b) lateral view with elliptical contact area.
The instantaneous condition of equilibrium can relate to normal contact force, FN, and friction coefficient,

To determine the stress–strain relations in asperities, Hertz’s theory of general profiles, applied to the sine asperities, is used, 28 where it is assumed that shape of contact area is elliptical, with the major and minor semi-axes a and b, respectively (Figure 9(b)).
The contact ellipse in elastic condition is related to the main radii by equation (5)

While in plastic condition, it is assumed

The main radius defined by circular cross section is obtained by means of equation (7)

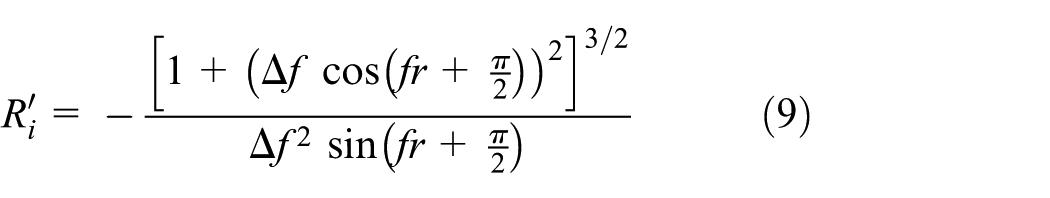
Meanwhile, the main radius on the sine profile is obtained by equation (8)

By developing equation (8) gives
With Hertz’s theory of elastic contact for general profiles, we find that larger radius of contact (a), deformation (δ), and maximum pressure (
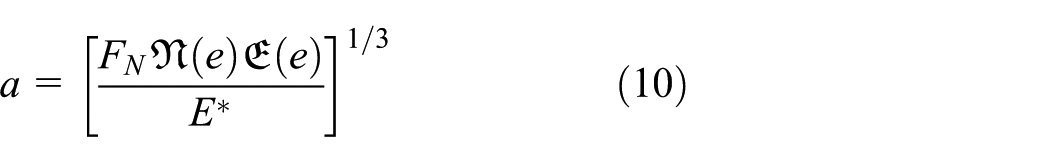
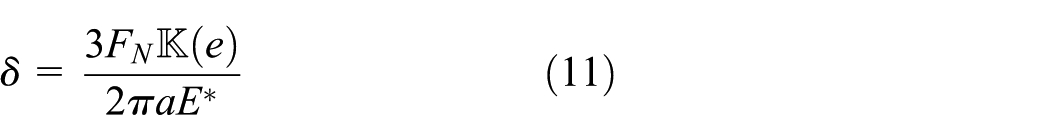


Meanwhile

Equivalent stiffness modulus is calculated by equation (15)

where
The stresses, along the normal from surface of contact, according to Howard and Victor 29 can be calculated as


where


The terms
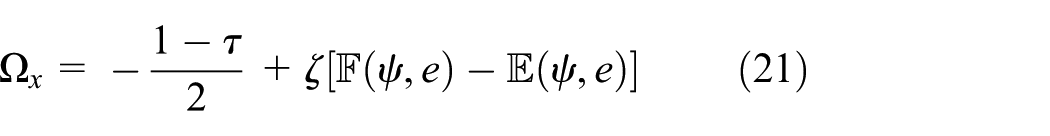

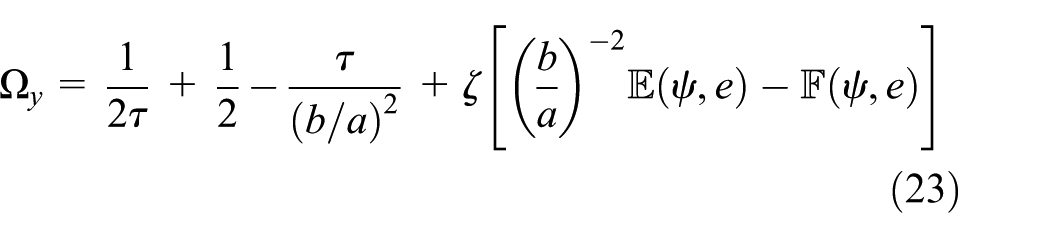

where

The z coordinate is the distance from contact zone to the depth of interest in normal line of contact:
If two bodies, with materials having identical elastic properties, support a concentrated contact under both normal and tangential forces, then the shape and size of the common contact are established by the profiles of the two contact surfaces and the normal load and are independent of the tangential force.
28
(p. 203)
To find the elliptical dimensions in which elastic limit is reached, Von Misses stress is calculated from stresses of the elliptical area, and it is set equal to the yield limit of material (Sy). In the contact zone, z = 0, so that when introducing the elements of equations (16)–(24) in calculating Von Misses stress, we obtain

where
From equation (10), it is possible to calculate normal force, FNY, which reaches that condition
With the value of force FNY, the value of maximum pressure reached is obtained using equation (12). This pressure value must be achieved for any dimension of contact area to obtain the elastic–plastic deformation condition, which can be applied to the dimensions of zone with maximum apparent area.
According to Figure 10, the dimension of the major axis of apparent maximum elliptical area is given by the hypotenuse of the triangle inscribed within profile asperity whose vertical cathetus,

Definition of the maximum apparent area in contact.
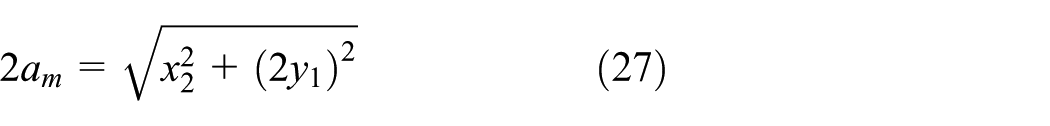
So, the apparent maximum dimension of the major axis,
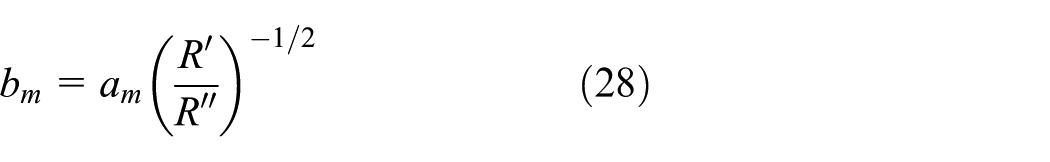
And the maximum possible dimension of the minor axis,
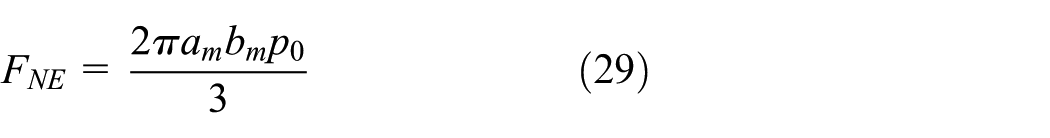
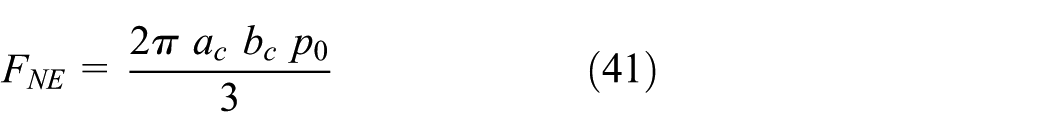
Then, the normal force at the beginning of elastic–plastic condition, FNE, when the maximum pressure p0 is applied, considering
If we consider the plastic deformation from yield (Sy) up to the maximum stress of material (Sm), a plastic module (EPn) for each material in contact can be determined

where
And the equivalent plastic modulus (EP*) for two asperities in contact with different materials is

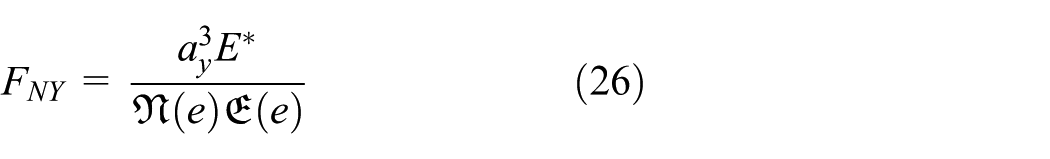
Thus, it is possible to calculate the plastic force necessary to achieve the maximum possible area, by means of equation (26)

Therefore, the normal force needed to achieve the maximum possible area, considering elastic–plastic deformation, is given by adding the results of equations (29) and (32)

Next, the normal force, which is obtained from equation (33), must be corrected due to elastic deflection of the asperity (Figure 11), which precludes that maximum dimensions are reached, so that the apparent maximum area and the deformation should be recalculated.

Reduction in the maximum contact area due to the bending caused by lateral force.
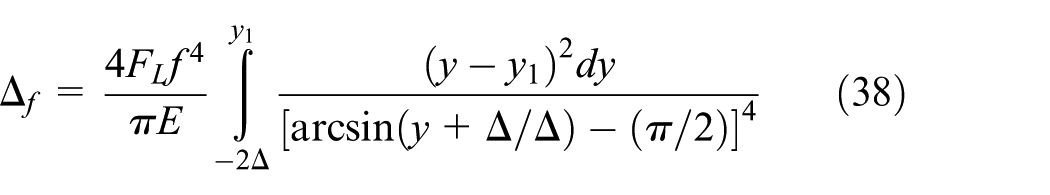
To characterize the deformation of asperities, the strain energy is used. According to Popov, 30 the phenomenon of bending is determined by

where E is Young’s modulus;

where y represents all vertical coordinates of the cross sections from bottom of the asperity to the point of application of force, and
The strain energy is equal to the external work of the force, and in the case of transverse deflection at load position,
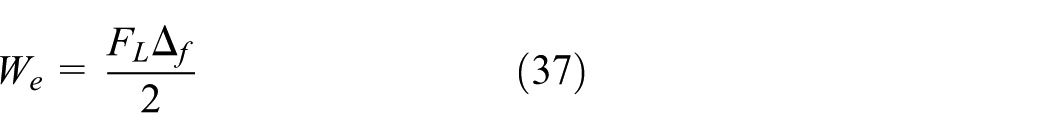
where
The expression of strain energy equals the work done by external load in the deflection of asperity
The angle of inclination due to this bending will then be

With this angle, the area reduction (

Then, with the corrected dimensions,

Finally, using equations (33) and (4), the corrected forces, normal and lateral, are obtained, respectively. Later, in section “Analysis of results,” the results obtained by this analytical method are compared with those found in simulations and tests.
Empirical equation for computing the lateral force
Using data obtained from the tests and simulations, it is possible to determine an empirical equation to obtain the value of lateral force, using the concept of dimensionless monomials. From the results, we find that lateral force, FL, which causes the failure by deformation, depends on the geometrical characteristics of the amplitude (2Δ), circular frequency (f), and overlap in the contact (yt). In addition, it depends on the characteristics of the material such as yield stress (

By inspection, the five independent dimensionless monomials (eight terms minus three basic dimensions) can be established as follows


whereby the function (FL) is presented as
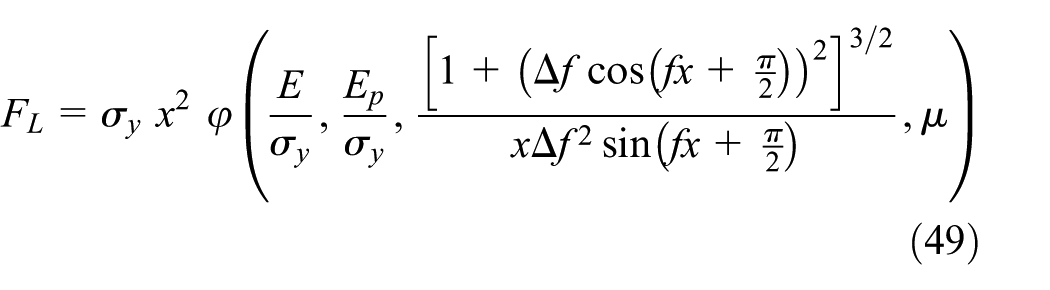
From equation (48), the following empirical equation results

The structure and values, coefficient (2.18) and exponent (0.1), come from the study of the resulting curve in tests and simulations of contact between asperities. The angle θ is determined from the horizontal axis to the normal at contact area, which is obtained by equation (3), and µ is the friction coefficient between contact surfaces.
In the next section, the comparison of the results of the analytical method and the empirical equation with testing and simulations is performed.
Analysis of results
Using the analytical procedure presented above, there is a good approximation of the results of this procedure with respect to the tests and simulations, presenting a range of overlaps near the top where the results are superior, but from a certain overlap (−0.85 µm in aluminum asperities and −0.87 µm in steel asperities), the results are lower than those found in the simulations and tests (see Figure 12). The greatest differences were found in steel asperities, 9.4% between the analytical method and the simulations in the overlap of −0.66 µm and 4.2% between this method and the tests in the overlap of −1 µm.
Lateral forces, which cause the failure by deformation, obtained by simulations, tests, and analytical method of the asperities of steel, aluminum, and nylamid for different overlaps.
Therefore, it is considered that the proposed method in this article constitutes a viable tool for obtaining the boundary loading conditions that produce the failure by deformation in lateral contact with the sine asperities. However, the extent of the procedure motivates to find other expressions to obtain similar results but simpler in execution. Then, an equation is proposed, derived from the curves of tests and simulations.
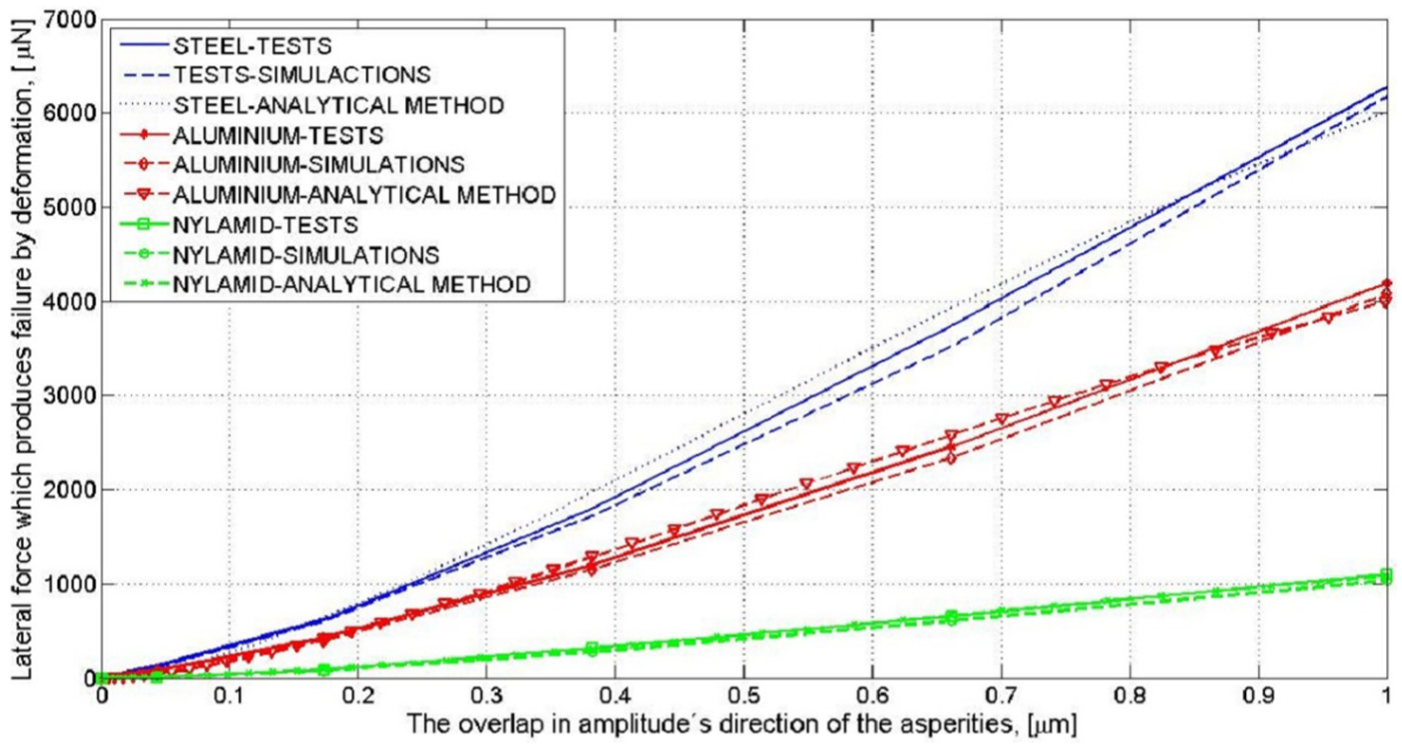
Figure 13 shows the results of tests, simulations, and equation (50), concerning lateral contact between asperities of steel, aluminum, and nylamid. This figure shows a great similarity between the results obtained from empirical equation with tests and simulations. In the steel asperities, the maximum difference was obtained between tests and equation with a value of 4.1% in the overlap of −0.81 µm, and in the case of aluminum, the difference was 4.2% between equation and simulations, in the overlap of −0.67 µm, and in the case of nylamid asperities, the difference was 3% from that obtained with equation with respect to tests in the overlap of −0.72 µm. Therefore, in the case of the analytical procedure, although approximates the curves of tests and simulations, it have values with a high variation, showing a fluctuating nature according to the overlap coordinates, where some values are above and others below from those found in tests and simulations.

Lateral forces, which cause the failure by deformation, obtained by simulations, tests, and empirical equation of the asperities of steel, aluminum, and nylamid for different overlaps.
Thus, the empirical equation found reliably determines the value of lateral force that causes failure by elastic–plastic deformation when lateral contact between asperities occurs. This expression must be supplemented by a procedure or equation that determines the repeat cycles of loads when a value of lateral force is less than the value that causes failure.
Since the value of lateral force depends on the overlap at the initial contact, it is required to determine, with a probability function or analytical, the coordinates of said overlap and the influence of contact pressure on it.
Conclusion
In this work, an empirical equation to complement an analytical procedure for calculating the lateral force required to cause failure by deformation on a couple of sine asperities was obtained. The results from tests and simulations of asperities, made of steel, aluminum, and nylamid, allowed to evaluate both the procedure and the empirical equation, but for greater simplicity in use, the empirical equation is established as a useful tool for studies of wear deformation, which showed a maximum difference of 4.2% with respect to the results of simulations of aluminum asperities. Among the studied asperities, there is no proportional behavior of lateral force with respect to the overlap at contact; the asperities of steel were the most rigid, while the asperities of nylamid were less rigid. The variation in the overlap is a condition that can be estimated probabilistically but is also influenced by contact pressure at the surface, so a future work that would complement this is one aimed at studying the increase in overlap due to deformation by forces in the direction of amplitude derived from the contact pressure. However, the value of lateral force, calculated as provided herein, may be used as a reference for the study of fatigue in asperities when loads resulting from vibration or body forces are less than said lateral force.
Footnotes
Appendix 1
Academic Editor: Yongming Liu
Declaration of conflicting interests
The author(s) declared no potential conflicts of interest with respect to the research, authorship, and/or publication of this article.
Funding
The author(s) disclosed receipt of the following financial support for the research, authorship, and/or publication of this article: This work was funded by the National Council of Science and Technology of Mexico (CONACYT CB102025 research project), the National Center for Research and Technological Development, the Apizaco Institute of Technology, and the Technological University of Puebla.