
Abstract
Tire dynamics model is the basis of vehicle dynamic performance research, however, due to the limitation of safety and environmental conditions, the six-component physical test can not fully characterize the dynamic mechanical response characteristics of tire under special conditions such as low service inflation pressure, high load, and large range of operation temperature. To accurately describe the dynamic response of the tire under special operating conditions with the magic formula (MF) tire model, this paper combines the nonlinear finite element analysis and the experimental test. The finite element model of the tire is verified by the dynamic characteristic experiments, and the tire dynamics simulation under special operating conditions are also conducted based on the verification results. The MF tire model is modified and the parameter identification is performed for the prediction results to extend the operating conditions of the tire dynamic model. The results of the comparison show that the method proposed in this paper can realize the condition expansion of MF tire model under special conditions.
Introduction
With the development of simulation technologies in the automobile industry, virtual simulation of vehicle performance has become an essential approach to save energy, reduce cost, and shorten the development cycle. 1 The virtual sample delivery technology of the tire dynamic model is the basic link of dynamic vehicle performance simulation.2,3 Generally, tire manufacturers conduct the tire dynamics test and the MF-tire modeling through the MTS Flat-Trac test machine made in United States. However, the MTS Flat-Trac test machine is characterized by high test cost, long test cycle, and considerable tire waste. Besides, the physical test cannot fully characterize the dynamic characteristics of the tire under special conditions such as low pressure, high load, and high and low temperature due to the limitation of operation safety and environmental conditions of the testing machine.
To solve this problem, Kristian et al. 4 developed the corner module test rig to examine the influence of air pressure change on the longitudinal slip characteristics of the tire and expand the pressure model of MF tire, providing a solution for the optimal pressure under the objectives of minimum rolling resistance and maximum traction force. Simultaneously, it verifies that the environmental temperature significantly affects the mechanical properties of the tire. Based on the trailer test method, Besselink et al. 5 extended the MF tire model and identified the parameters, obtaining the fitting error of the mechanical data of the tire before and after the pressure change. The fitting results demonstrate that the error decreases by 60% after the air pressure is considered.
Meanwhile, many researchers have adopted the finite element analysis technology to overcome difficulties in the simulation and prediction of mechanical properties of the tire in recent years.6–10 Kao and Muthukrishnan 11 used an explicit FE program to analyze the transient response of tire dynamics, and the results proved the effectiveness of the method. Ali et al. 12 investigated the rolling resistance and steering characteristics of a heavy truck tire with finite element analysis, and the findings showed that the finite element model can qualitatively simulate the mechanical properties of a real heavy truck radial tire. Du et al.13,14 analyzed the camber and cornering characteristics of a safety tire by the combination of experiment and finite element simulation. Taheri et al. 15 studied the dynamic response of the tire by finite element model, and the model was validated by comparing the finite element results and experimental results that eliminate numerical noise after filtering.
However, the simplified tire model with the longitudinal main tread groove is mostly used for simulation calculation and verification owing to the limitations of large calculation resources and complex tread pattern modeling.16–19 Generally, the tread pattern, structure, and formula of the tire are the core factors influencing the mechanical properties of the tire. As demonstrated by Jiang et al., 8 simplification of the complex tread pattern structure entails a great risk for the accuracy of tire dynamic performance simulations.
During the development of supporting products of tire manufacturers, the key to solving the problem of vehicle performance matching is to develop a tire dynamic model with a wide range of operating conditions and high identification accuracy. To accurately use the MF tire model to describe the mechanical response of the tire under special conditions, the nonlinear finite element analysis and the experimental test are combined in this paper to simulate and verify the dynamic mechanical characteristics of the tire under laboratory conditions. Based on the simulation results, the simulation prediction of dynamic mechanical properties under special conditions is performed. Considering the great influence of tire temperature on the dynamic response, this paper also attempts to extend the temperature condition of the MF tire model. Finally, the parameters of simulation prediction results are identified using MATLAB, contributing to expanding the operation range of the tire dynamic model.
Finite element model of the tire
Finite element structural model
In this paper, the 205/55R16 tire is taken as the research object, and the finite element model of the complex tread pattern is established by nonlinear finite element analysis software ABAQUS,11,18–20 and the modeling process is illustrated in Figure 1.

The modeling process of the FE tire model with complex tread pattern.
Firstly, a two-dimensional axisymmetric model is established based on the measured tire profile and material structure distribution. The axisymmetric elements CGAX3 and CGAX4 are adopted as the rubber solid triangle and the quadrilateral element in the two-dimensional model, respectively. The skeleton material element with the same node as the rubber solid element is established by skin command, and the linear, axisymmetric, and two-node SFMGAX1 plane element type is selected for the model. The skeleton material is embedded into the rubber solid element to simulate the performance of the tire cord rubber composite material. To avoid excessive element stiffness and improve the calculation speed, the binding surface is used to reduce the number of triangular elements and quadrilateral elements with smaller aspect ratios when constructing the two-dimensional carcass model.
Secondly, the tread pattern of the solid tire is rubbed and measured, the three-dimensional solid model of the tread pattern is established in CATIA, and the pattern entity is divided by the preprocessing software Hypermesh. Finally, the 3D tire model is established by rotating 180 times circumferentially with the command of symmetric model generation, and the tread pattern is bound with the tie command and assembled into a whole model. Therefore, the tire model with a complex tread pattern includes 282,672 nodes, 219,996 rubber solid elements, and 85,320 rebar elements.
Material parameters definition
The stability of material parameters has a decisive influence on the convergence of the analysis during the rolling of tire rubber with sideslip and longitudinal slip. In this paper, the Neo-Hookean hyperelastic constitutive model is used to characterize the rubber material model, as expressed in equation (1). The main advantages of this model include simple material parameters and an unconditionally stable analysis process. Moreover, this model is suitable for tensile deformation below 40% and shear deformation below 90%, fully meeting the deformation behavior under large sideslip angle and load conditions.

Where σ is tension stress, in MPa,
In this paper, the uniaxial tensile test on the peeling rubber material of each layer of the tire is conducted on the US INSTRON 5965 electronic universal tensile machine. Firstly, the Mullins effect is eliminated by 20 times of cyclic pre-stretching in the range of 0%–20% strain at the speed of 10 mm/min. Then, the sample is re-clamped. Finally, it is stretched to 10%–30% strain at 10 mm/min, and the parameter identification of the test data is performed according to equation (1). The Neo-Hookean parameter identification curves of major rubber materials are presented in Figure 2.
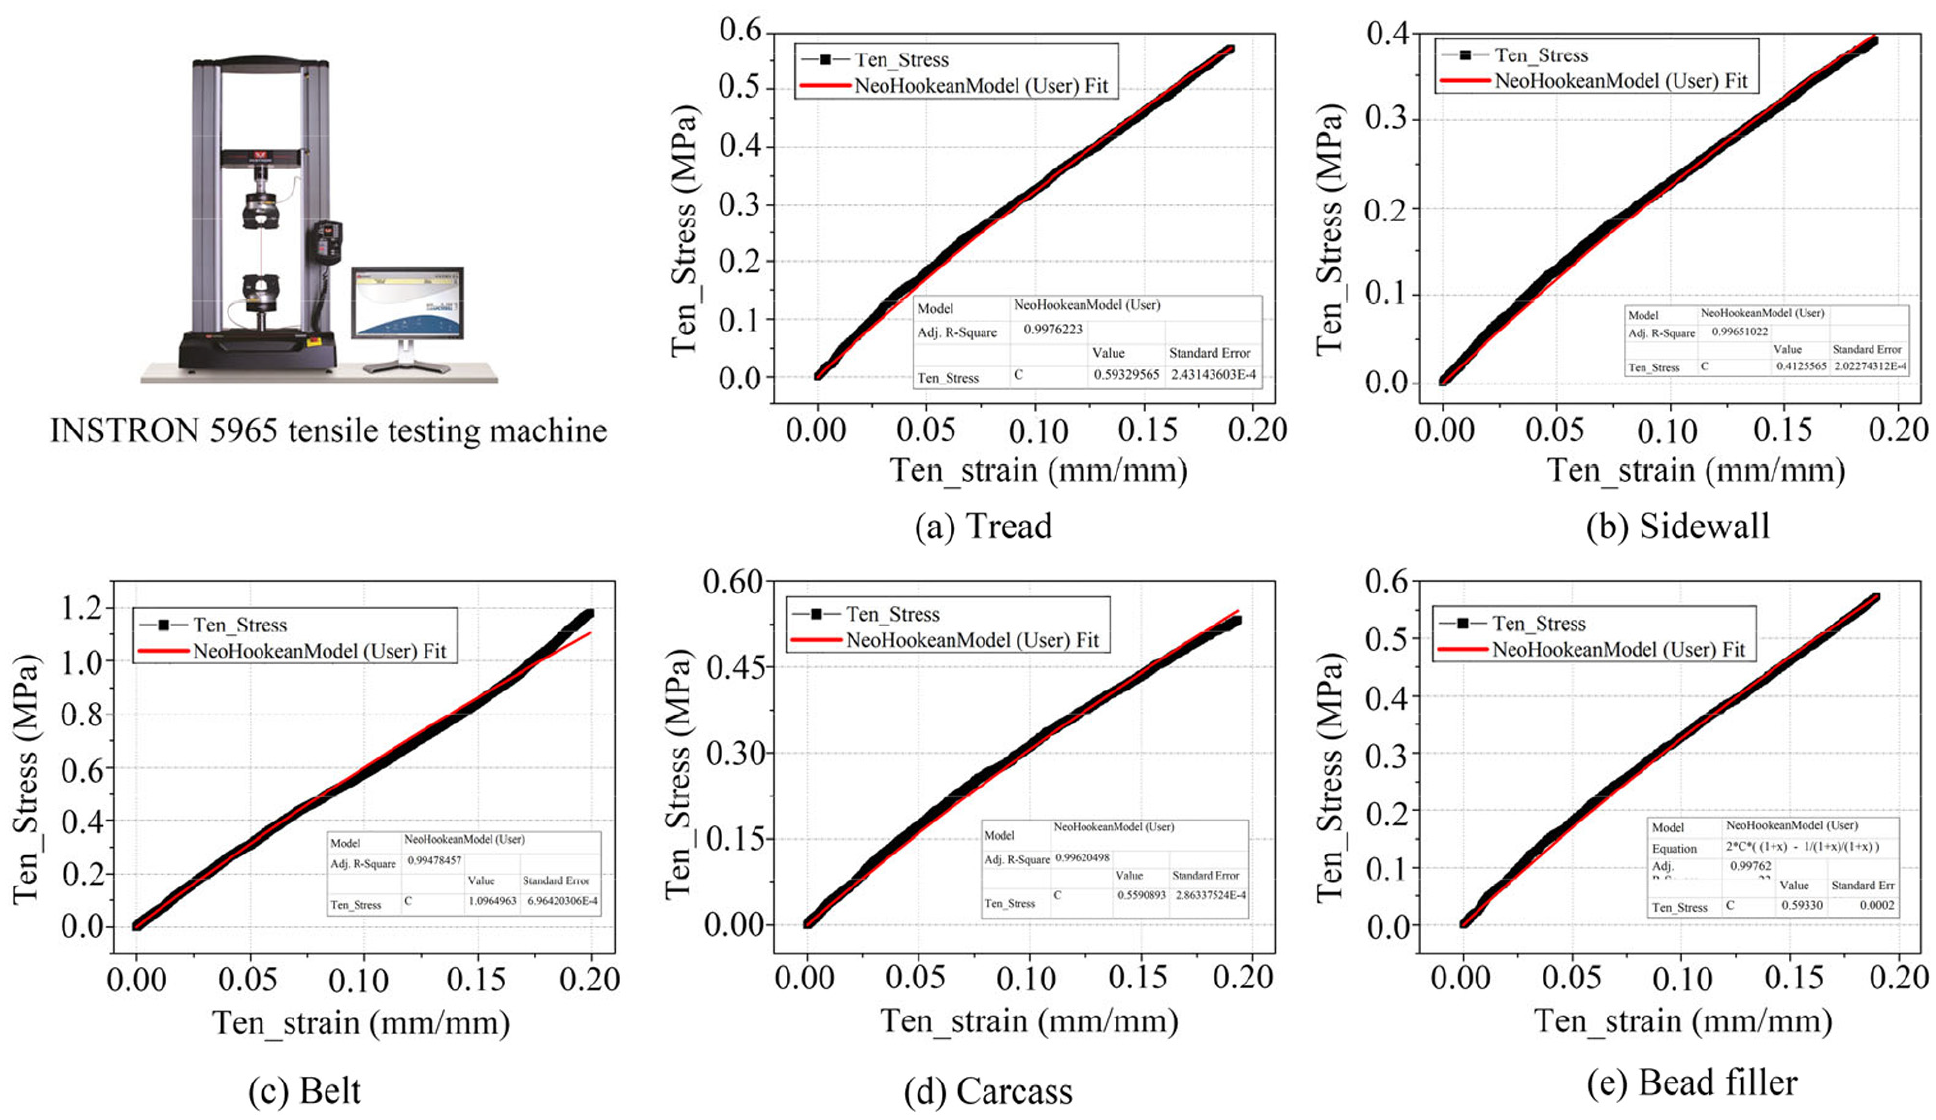
Neo-Hookean parameter identification curve of tire major rubber materials.
The dynamic mechanical test of rubber material can truly reflect the changes in temperature rise and mechanical properties of the rubber material under the periodic stress-strain cycle during the tire rolling. 21 In the ABAQUS finite element software, the viscoelastic constitutive model uses the Prony order number to expresses the time dependence of rubber material under the small strain. However, the constitutive model expressed by the high-order Prony series will significantly increase the calculation cost and has poor convergence during the simulation of large deflection angle and large slip. Therefore, the low order linear relation is usually adopted to input the simulation model, and the normalized expression of the shear relaxation function is as follows
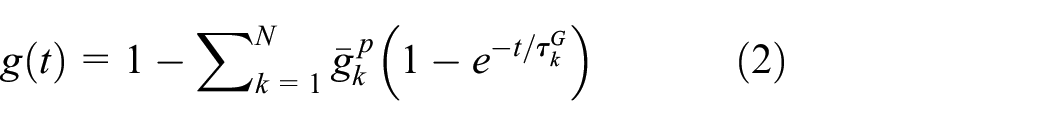
where
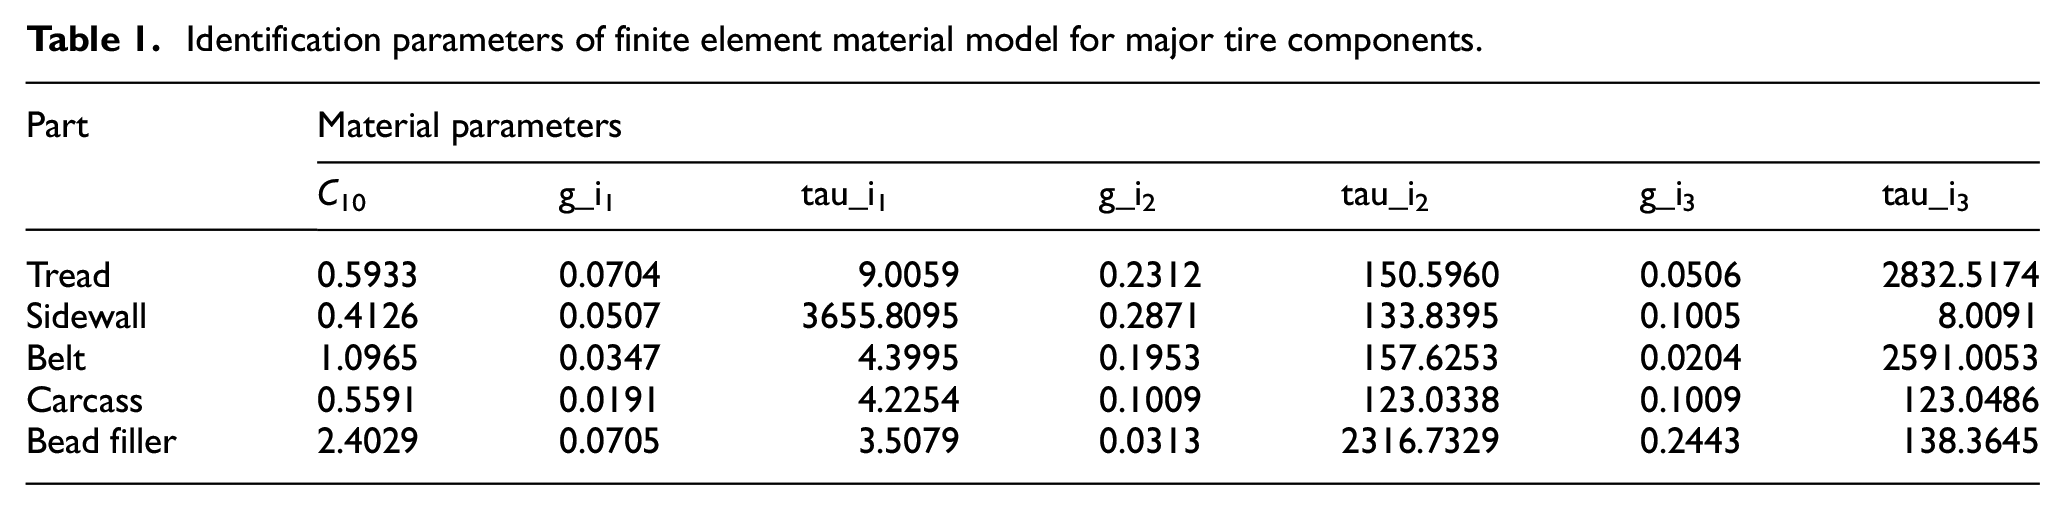
In this paper, the shear module of the German Gabo dynamic thermal mechanical analyzer (DMA) is used for the test. First, the shear strain of the sample is set to 15%, and the relaxation time is set to 9000 s. Afterward, the test data are normalized, and the first three Prony series are characterized by equation (2). The parameter identification curves of major rubber materials are exhibited in Figure 3 and the parameters of finite element material model for major tire components are shown in Table 1.
Identification parameters of finite element material model for major tire components.

Parameter identification curve of Prony series of major rubber materials.
Boundary condition
The finite element model of tire dynamic characteristics analysis is constructed by steady-state transmission model of ABAQUS/Standard, which is imported into ABAQUS/Explicit through import command. The rim and pavement adopt rigid surfaces to establish contact pairs with the tire respectively. The contact friction coefficient between the rim and the cushion is 1.0. In the vertical direction, the contact properties between the tire and the pavement is set as hard contact, while the change of contact friction coefficient between pavement and tread with sliding speed is expressed by modified Savkoor model in the rolling direction.22,23
When setting the dynamic simulation analysis step, the tire is inflated and loaded first. Because the calculation process of stable rolling is easy to fail due to oscillation,24,25 it is necessary to carry out initial rolling calculation before stable rolling calculation to eliminate the radial mechanical response oscillation caused by the mismatch between wheel center angular velocity and tread linear velocity during initial rolling. Moreover, the numerical oscillation in the process of explicit dynamic rolling analysis process is also controlled by subroutine to improve the efficiency of calculation.
Analysis and verification of tire dynamic characteristics
The simulation results of tire finite element model need to be verified experimentally to extend the operating conditions of the dynamic characteristics of the tire. In this paper, the US MTS Flat Tract CT III test machine is used to perform the longitudinal slip and sideslip test of the tire, as exhibited in Figure 4, and the test data are compared with the simulation analysis results. The test and simulation analysis conditions are provided in Table 2.
Tire dynamics test and simulation analysis conditions.

4000 N is taken as the reference vertical load in the table (100% load).

MTS Flat Tract CT III test machine.
Analysis and verification of mechanical characteristics of pure longitudinal slip
The longitudinal slip characteristics have a decisive influence on vehicle traction and braking performance, and is one of the key evaluation items during the vehicle braking test. The comparison between simulation results and experimental results of mechanical characteristics of longitudinal slip under different radial loads is illustrated in Figure 5.
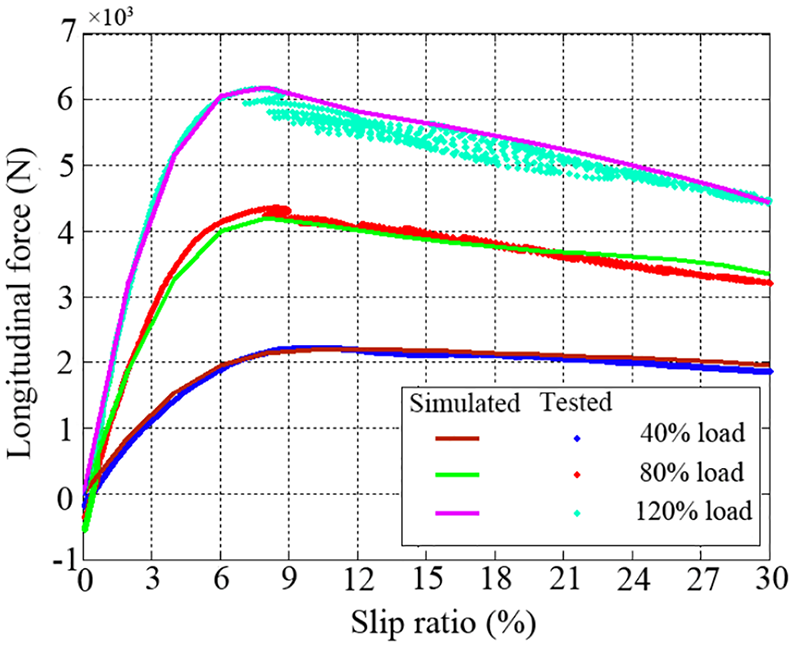
Comparison of test and simulation under pure longitudinal slip condition.
It can be observed in Figure 5 that the simulation and test results can accurately predict the changing trend of the longitudinal force with the slip ratio, and the inflection point of the peak value of the longitudinal force is similar to the experimental value. However, the actual tire test process is accompanied by temperature rise. Since the finite element model is an isothermal model, a significant difference in the curve after the peak value is caused. Meanwhile, the test data fluctuate obviously when the test load is large, indicating that the stability of test data becomes worse with the increase of load.
Analysis and verification of mechanical properties of pure sideslip
The mechanical characteristics of tire sideslip have a crucial influence on the directional control and operation stability of the vehicle. 17 The simulation results of lateral mechanical properties under different radial loads are compared with the experimental results, as exhibited in Figure 6.

Test and simulation comparison of pure sideslip condition.
As revealed in the figure, the simulation and test results can accurately predict the changing trend of the lateral force with the sideslip angle and the inflection point of the peak value. Nevertheless, the difference of the sideslip stiffness would be induced by the inconsistency between the tire preheating temperature and the temperature input of the finite element simulation model in the initial test process.
Extension of operating conditions of MF tire model
Based on the MF tire dynamic model theory, the special operating conditions that the MTS Flat Tract test machine cannot test or entails safety risk are simulated and predicted in this section to expand the MF tire model. Simultaneously, the temperature is added to the MF tire model to extend the dynamic response of the tire at different service temperatures.
Modification of the MF tire model
The MF tire model, as one of the most used tire models in vehicle control and stability dynamics simulation, can well establish the relationship between tire mechanical characteristics and slip rate, sideslip angle, roll angle, radial load, inflation pressure, and tread-road contact characteristics, providing a foundation for accurately predicting vehicle control and stability behavior and reducing the difficulty of simulation calculation. 3 However, the accuracy of the model depends on the wide range of test and simulation conditions, that is, the larger the range of load, air pressure, speed, and inclination angle, the higher the prediction accuracy of the model. The MF tire model2,3,5 can be expressed as follows
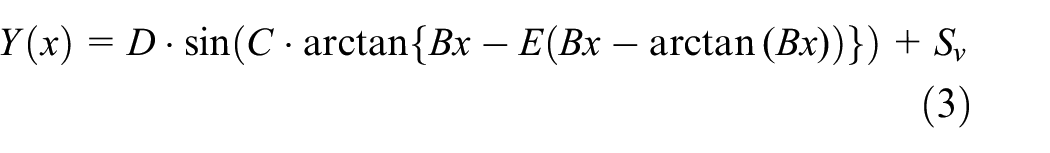
where D is the peak value, C is the shape factor, B is the stiffness factor, E is the curvature factor, x = X + Sh, X is the input variables, including slip ratio, sideslip angle, etc., Sh is the horizontal shift and Sv is the vertical shift.
When the temperature difference of the tire itself is large, the data curve is similar to the influence of inflation pressure on the MF tire model. Therefore, this paper attempts to extend the influencing factors of temperature and identify the parameters based on the finite element method. The temperature model of pure longitudinal slip conditions is modified as follows


where ttx1 is the variation of slip stiffness with temperature, ttx2 is the variation of slip stiffness with temperature squared, ttx3 is the variation of μx with temperature, and ttx4 is the variation of μx with temperature squared.

where ti is the temperature variable and t0 is the reference temperature.
The temperature model under pure sideslip conditions is modified as follows
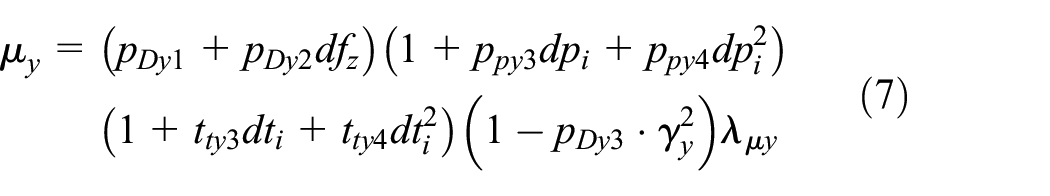

where tty1 is the variation of maximum cornering stiffness with temperature, tty2 is the variation of Ky with temperature when the load is maximum, tty3 is the variation of μy with temperature, and tty4 is the variation of μy with temperature squared.
Tire mechanical properties under different inflation pressure conditions
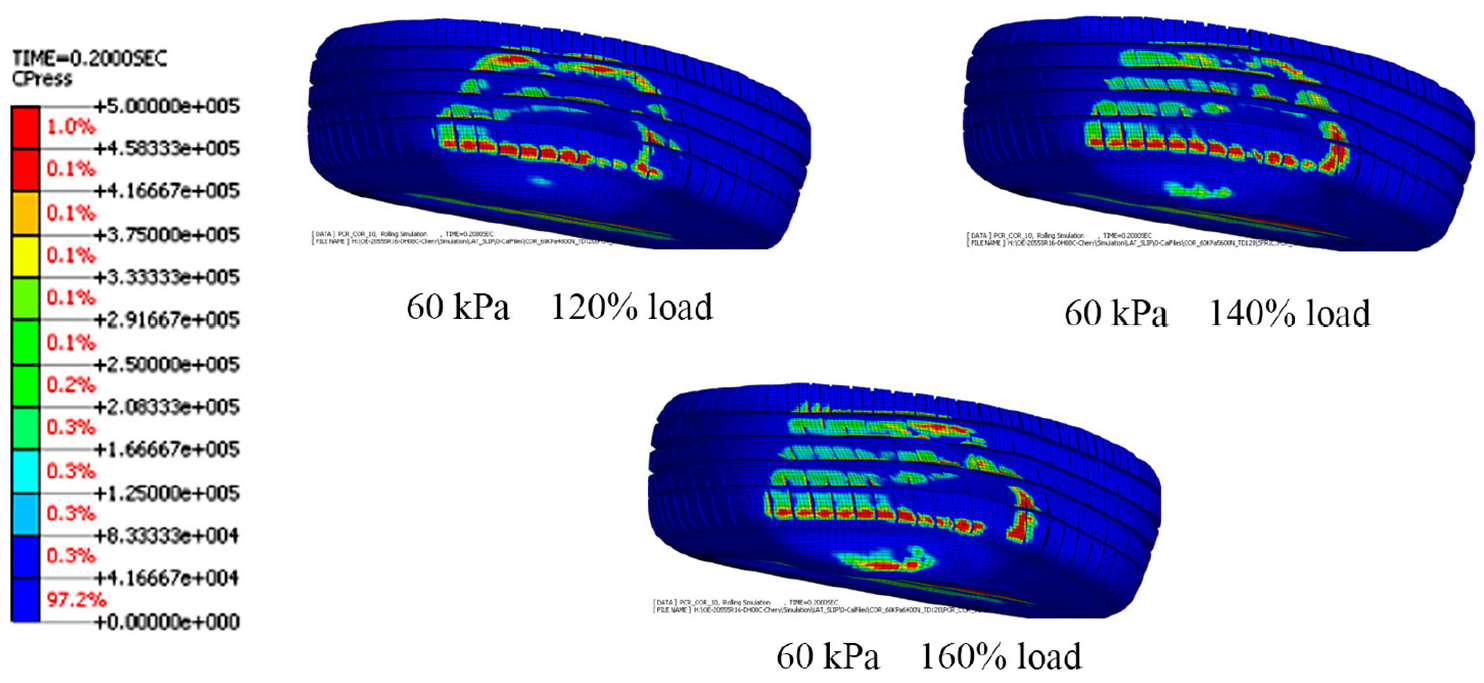
Under the same load (120% load) and different inflation pressures (60, 140, 220 kPa), with the decrease in air pressure, the effective ground contact impression area of the tire gradually increases, and the centralized distribution of the ground contact pressure becomes more dispersed, as illustrated in Figure 7. Consequently, great changes in the mechanical properties of ground contact would be caused.

Ground contact characteristic response under low pressure free rolling.
With the decrease of air pressure, the longitudinal sideslip stiffness first increases and then does not change significantly, as shown in Figure 8(a). Regarding the lateral mechanical properties, the sideslip stiffness decreases as air pressure decreases; however, it does not change much at higher air pressure; this result is consistent with the trend obtained in references.4,5 Simultaneously, with the decrease of air pressure, the inflection point of peak lateral force and the corresponding sideslip angle are larger when the slip is steady, as exhibited in Figure 8(b).
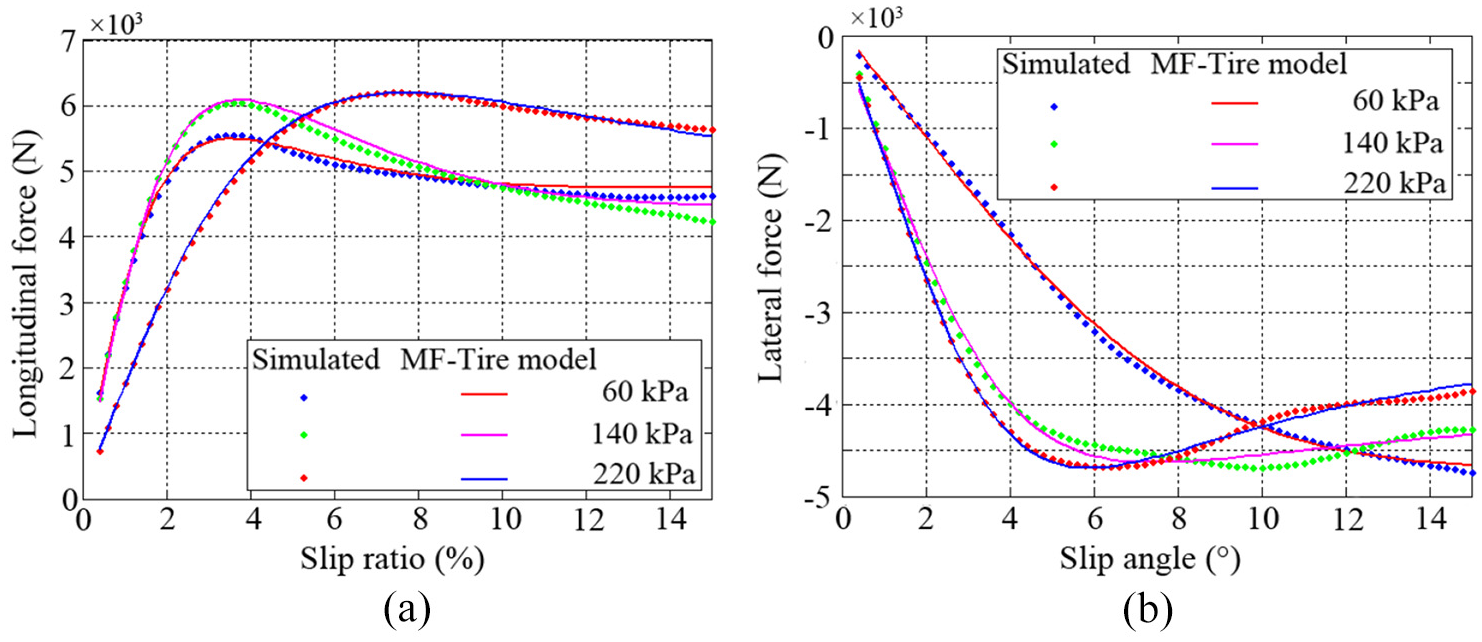
Identification of longitudinal and lateral characteristics under the low-pressure conditions (a) longitudinal and (b) lateral.
Tire mechanical properties under low pressure and high load
There is a higher risk of steel strip derailment or fracture when it is tested on the six-component test stand under low air pressure and high load conditions. The damage to the test stand under such operating conditions can be effectively avoided using the finite element simulation method.
Under the low air pressure (60 kPa), the longitudinal mechanical response changes with load changes (120%, 140%, 160%). Specifically, the greater the load, the greater the longitudinal stiffness, the greater the force value to reach the steady slip state, and the smaller the longitudinal slip ratio corresponding to the inflection point of the longitudinal force peak, as exhibited in Figure 9(a). Meanwhile, the changing trend of lateral mechanical response is different from that under the high-pressure condition; the greater the load, the smaller the lateral stiffness; besides, the response curve overlaps when the sideslip angle is large, as illustrated in Figure 9(b).

Identification of longitudinal and lateral characteristics under low inflation pressure and high load conditions (a) longitudinal and (b) lateral.
Additionally, the ground contact response of the sideslip is extracted from the data file to investigate the overlap of force value curves of the sideslip response under the condition of more than 10° of sideslip, as presented in Figure 10. It can also be observed that sidewall ground contact occurs when the sideslip response is at the sideslip angle of 10°; the greater the load, the smaller the sideslip angle corresponding to the sidewall ground contact. After the sidewall touches the ground, the sideslip response of the crown shifts to the sidewall, weakening the sideslip response.
Tire grounding characteristics under low air pressure and high load conditions (slip angle = 10°).
Tire mechanical properties at different temperatures
The MTS Flat-Trac test machine runs under the condition of constant temperature and humidity, and the tire temperature is mainly regulated during the tire warming, making it difficult to ensure the tire temperature state during the switching of experimental conditions. Meanwhile, the limitation of the test stand on the ambient temperature and humidity also leads to an extremely limited range of ambient temperature regulation.
In the finite element simulation, the longitudinal and lateral mechanical response after the tire temperature change (−10°C, 40°C, 80°C) under the same air pressure (220 kPa), load (120%), road surface, and ambient temperature (25°C) is illustrated in Figure 11. At low temperature, the tire exhibits larger longitudinal and lateral stiffness; this is quite different from the results at a higher temperature; at a higher temperature, with the increase of temperature, the longitudinal stiffness, lateral stiffness, and peak friction decrease, the slip ratio corresponding to the longitudinal peak inflection point increases, and the sideslip angle corresponding to the lateral peak inflection point changes little.

Identification of longitudinal and lateral characteristics under different temperature conditions (a) longitudinal and (b) lateral.
Conclusions
In this paper, simulation analysis is conducted using the finite element model of the tire, and the results are compared with the test results obtained by the MTS test stand. The verification results demonstrate that the simulation prediction results are consistent with the experimental results. On this basis, the influence of the same load, different air pressure conditions, low pressure, high load conditions, and different tire temperature conditions on the longitudinal slip and sideslip response is further investigated to extend the operating conditions that cannot be realized by the physical test of the six-component test stand. Then, the extension of the operating conditions of the MF tire model is realized. The main conclusions are drawn as follows:
Under the operating condition of the same load and different inflation pressures, the peak friction of tire longitudinal slip response decreases with the decrease in air pressure, and the corresponding slip ratio also decreases, and the longitudinal slip stiffness first increases and then stabilizes. Besides, the inflection point of peak lateral force of the sideslip increases as air pressure decreases, and the corresponding change gradient of the sideslip stiffness gradually decreases.
Under the conditions of low pressure and high load condition, the changing trend of tire longitudinal slip response is consistent with the results obtained under the test conditions. However, the sideslip response curve deviates due to the ground contract of the sidewall. Specifically, the greater the load, the smaller the corresponding sideslip angle during sidewall ground contact, and the greater the weakening effect on the sideslip force.
As indicated in the mechanical response curve, with the increase in tire temperature, the overall stiffness decreases, and the peak friction force in transverse and longitudinal directions of the tread decreases. The MF tire model is extended under the temperature condition, as illustrated in the identification curve, the fitting curve is in good agreement with the simulation results while the difference between them becomes large when the slip rate and the sideslip angle are larger. Thus, it is necessary to further investigate the state parameters of large slip rate and large sideslip angle to improve the identification accuracy of the model in future research.
It can be concluded from the curves of parameter identification of longitudinal slip and side slip response under various conditions by using MF tire model that the method proposed in this paper can realize the condition expansion of MF tire model under special conditions.
Footnotes
Handling Editor: Chenhui Liang
Declaration of conflicting interests
The author(s) declared no potential conflicts of interest with respect to the research, authorship, and/or publication of this article.
Funding
The author(s) received no financial support for the research, authorship, and/or publication of this article.