
Abstract
Steady and unsteady natural convection heat transfer in a nanofluid-filled square enclosure cavity with various heat source configurations at the bottom were numerically studied using a characteristic-based split scheme finite element method. A wide range of Rayleigh numbers
Keywords
Introduction
Increasing the heat transfer rate while incurring acceptable pressure drop is an important objective in many industrial applications such as electronic device cooling, microfluidic components, and heat exchangers. Conventional heat transfer fluids such as water, oil, and ethylene glycol possess low thermal conductivity values, thus limiting their utilization in challenging conditions. Adding some solid nanoparticles with high thermal conductivity to the fluid is one of the ways to overcome this problem. The resulting fluid is a suspension of the solid nanoparticle in the base fluid, which is called a “nanofluid.” The thermal conductivities of nanofluids are believed to be greater than the base fluid due to the high thermal conductivity of the nanoparticles. Moreover, buoyancy-driven fluid flow and heat transfer have received much attention in engineering applications such as cooling systems for electronic devices and heat exchangers due to simplicity and reliability. 1 Along these lines, many numerical and experimental studies in differentially heated enclosures have been conducted.2–6 Sezai and Mohamad 3 investigated steady, natural convection from a discrete flush-mounted rectangular heat source on the bottom of a horizontal enclosure and showed that the rate of heat transfer was not sensitive to the vertical wall boundary condition but did depend on the Rayleigh number and the aspect ratio of the source. In addition, Cheikh et al. 6 studied influences of Rayleigh number and various thermal boundary conditions at the ceiling and vertical walls on the characteristics of natural convection in a square enclosure. They showed that different thermal boundary configurations and Rayleigh numbers significantly affect heat transfer rate and maximum temperature at the heated surface.
However, these studies only considered a relatively low thermal conductivity fluid, which limits the heat transfer enhancement. With the continuing miniaturization of electronic devices and the desire for heat transfer improvements, dispersed nanoparticle–fluid mixtures, referred to as nanofluids, have attracted attention in heat transfer applications because of their excellent thermal performance. Nanofluid has many advantages such as significantly enhanced heat transfer, possible size reduction of heat exchanging system, and minimal clogging. 7 Thus, nanofluids could be applied to some environments where higher heat flux is important, as conventional fluid is not capable of achieving the desired heat transfer. Xuan and Li 8 examined the transport properties of nanofluids and showed that thermal dispersion, which takes place due to the random movement of particles, played a major role in increasing the heat transfer rate between the fluid and the wall. Brownian motion of the particles, ballistic phonon transport through the particles as well as clustering of nanoparticles may also be a possible reason for this enhancement. 9 Das et al. 10 investigated the stability of Al2O3–water and Cu–water nanofluid and observed that the thermal conductivity of the nanofluid increased with temperature. Putra et al. 11 and Wen and Ding 12 conducted experiments on natural convection heat transfer with nanofluids and showed that the heat transfer rate decreases with an increase in nanoparticle concentration. It was also shown that the viscosity of the nanofluid increased rapidly with inclusion of nanoparticles at low shear rate.
Numerical studies on natural convection heat transfer of nanofluids within differentially heated enclosures have been performed.13–18 Khanafer et al. 13 first conducted a numerical investigation on the heat transfer enhancement due to adding nanoparticles in a differentially heated enclosure. They found that the suspended nanoparticles substantially increase the heat transfer rate at any given Grashof number. Recently, Oztop and Abu-Nada 17 conducted numerical simulations of natural convection heat transfer and fluid flow within a partially heated enclosure considering different types of nanofluids. Aminossadati and Ghasemi 18 presented a numerical study of natural convection cooling of a heat source embedded on the bottom wall of an enclosure filled with nanofluids and indicated that adding nanoparticles into pure water improved its cooling performance, especially at low Rayleigh numbers. In addition, they showed that the type of nanoparticles and the length and location of the heat source significantly affected the maximum temperature of heat source. While most studies assumed potential fluid flow and considered only steady state natural convection, viscosity may have an important effect in the development of boundary layer flow and unsteady fluid flow in the initial transient stage. Natural convection heat transfer in an inclined enclosure filled with a water–CuO nanofluid is investigated numerically by Ghasemi and Aminossadati 19 . They found that the heat transfer rate is maximized at a specific inclination angle depending on Rayleigh number and solid volume fraction. Nabavitabatabayi et al. 20 presented a numerical study on the heat transfer performance in an enclosure including nanofluids with a localized heat source. They observed that by adding nanoparticles to base liquid causes the maximum temperature decrease on account of the irregular motion of nanofluids and, more importantly, the higher energy transport rate inside the fluid. Abu-Nada et al. 21 investigated natural convection heat transfer enhancement in horizontal concentric annuli field by nanofluid. They found that for low Rayleigh numbers, nanoparticles with higher thermal conductivity cause more enhancement in heat transfer. Bararnia et al. 22 studied the natural convection in a nanofluid-filled portion cavity with a heated built in plate by lattice Boltzmann model (LBM). Hasan et al. 23 recently investigated unsteady behavior of natural convection characteristics in a differentially heated enclosure with sinusoidally corrugated side walls and demonstrated that the Rayleigh number and the geometrical parameters of the enclosure have great influence on the transient characteristics of natural convection. One can find more engineering applications of the natural convection in enclosures in the review of Baïri et al. 24
In this study, we adapted a characteristic-based split (CBS) scheme in finite element method (FEM) for studying transient and steady characteristics of natural convection in a square cavity filled with nanofluids that have many practical applications such as electronic device cooling, microfluidic components, and heat exchangers. We also investigated transient and steady heat flow with various setup such as heat source lengths
Problem description
The schematic diagrams of the two-dimensional square enclosure considered in this study are shown in Figure 1. In the problem, a heat source is located on the bottom wall of a square cavity, and two vertical walls are maintained at a relatively low temperature (Tc). On the top wall, an adiabatic boundary was assumed. Additionally, the following assumptions are proposed:
The length of the heater, B, can be changed.
The position of the heater is expressed by D and is measured from the middle point of the heater to the left vertical wall of the enclosure.
Nanofluids considered in the study are assumed to be Newtonian, incompressible fluids with laminar flow.
The base fluid (water) and the solid spherical nanoparticles (Cu, Ag, Al2O3, and TiO2) are in thermal equilibrium.
Thermo-physical properties of the nanofluid are uniform and constant except for the density variation, which is determined based on the Boussinesq approximation. The thermo-physical properties of the base fluid and nanoparticles are given in Table 1.

Initial schematic diagram for the current problem.
Thermo-physical properties of water and various nanoparticles.

Mathematical formulation
Governing equations
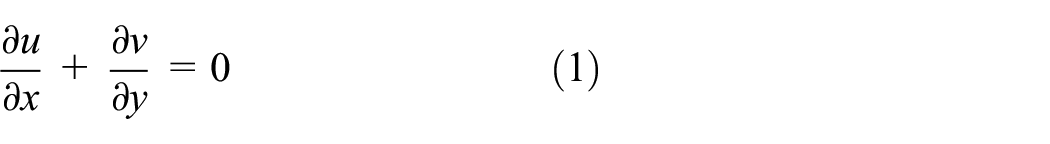
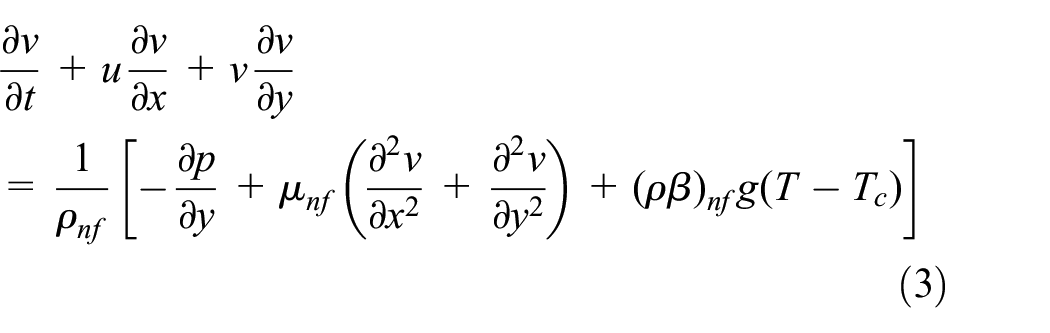
The fluid considered in this study is a water-based nanofluid containing four different types of the nanoparticles: Cu, Ag, Al2O3, and TiO2. The continuity, momentum, and energy conservation equations for the unsteady natural convection in the two-dimensional square cavity can be written as follows18–21,23


Here,


where

In addition,

where
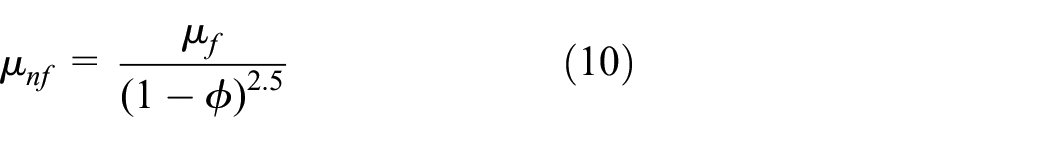
The effective dynamic viscosity of the nanofluid is given by Brinkman 27
The following dimensionless parameters are used to convert equations (1)–(4) to non-dimensional forms as follows
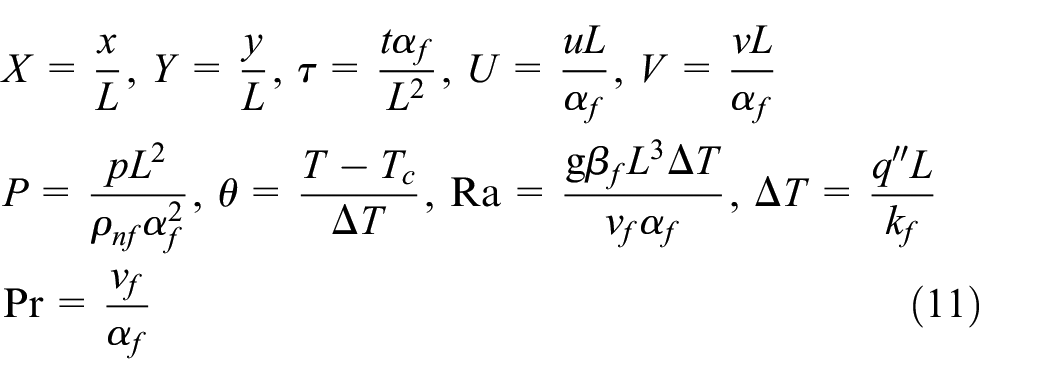
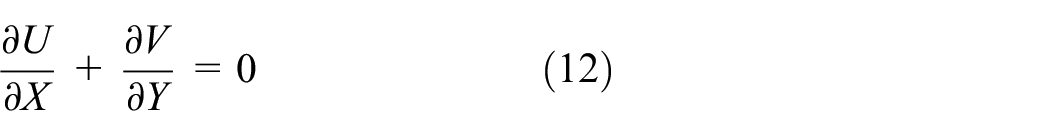
As a result, the dimensionless continuity, momentum, and energy conservation equations can be expressed as follows


Boundary conditions
For fluid flow, a no-slip boundary condition was applied on all walls. For heat transfer, the vertical walls were maintained at a relatively low temperature (Tc), and the ceiling was considered to be adiabatic. The heat source on the bottom was varied in length (B) and distance (C) from the left vertical wall.
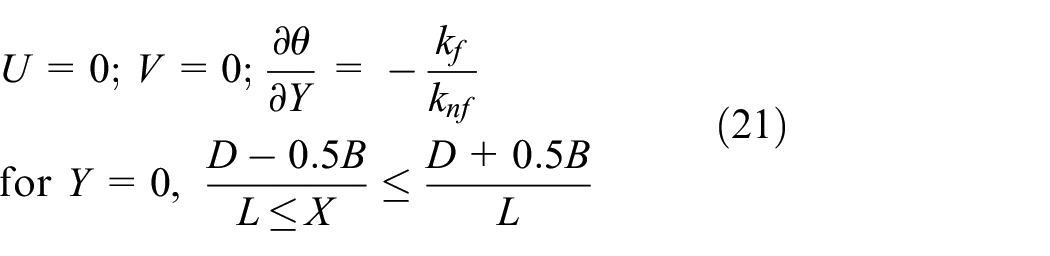
These boundary conditions can be written as follows in dimensionless form


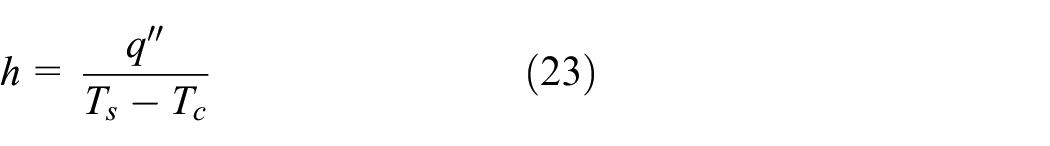
The local Nusselt number on the heat source surface can be defined as follows

where h is the convection heat transfer coefficient:
Then, the non-dimensional form of the local Nusselt number along the heat source is given as follows

where

Numerical method and validation
The dimensionless governing equations for incompressible viscous flow with the boundary conditions were discretized using the semi-implicit CBS scheme in a FEM. The details of the scheme were introduced by Massarotti et al., 28 Nithiarasu, 29 and Zienkiewicz et al. 30 The CBS scheme is implemented in a semi-implicit form in order to solve the incompressible viscous flow equations. In this section, the CBS procedure for the solution of nanofluid equations is described.
The CBS method is based on the calculation of an intermediate velocity from a momentum equation where the pressure gradients are omitted. Then, the pressure is evaluated through solving the pressure Poisson equation. Finally, the velocity is corrected using the computed pressures. In this study, the simplex linear triangular elements are employed.
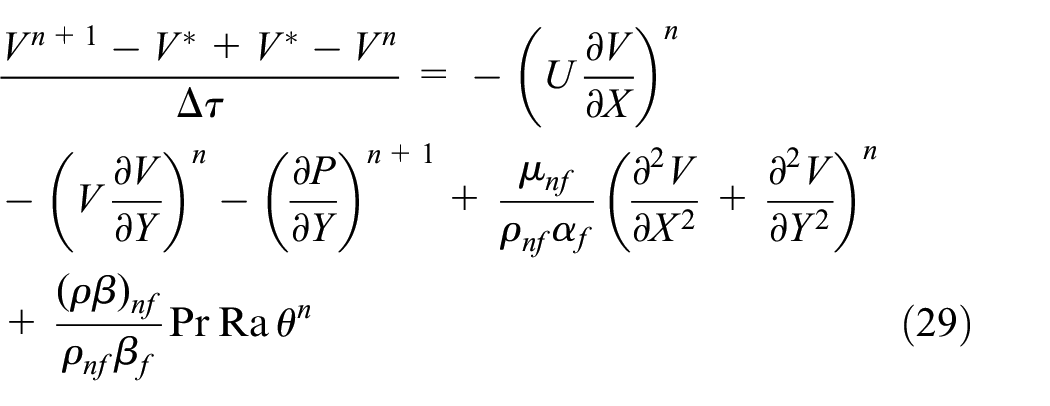
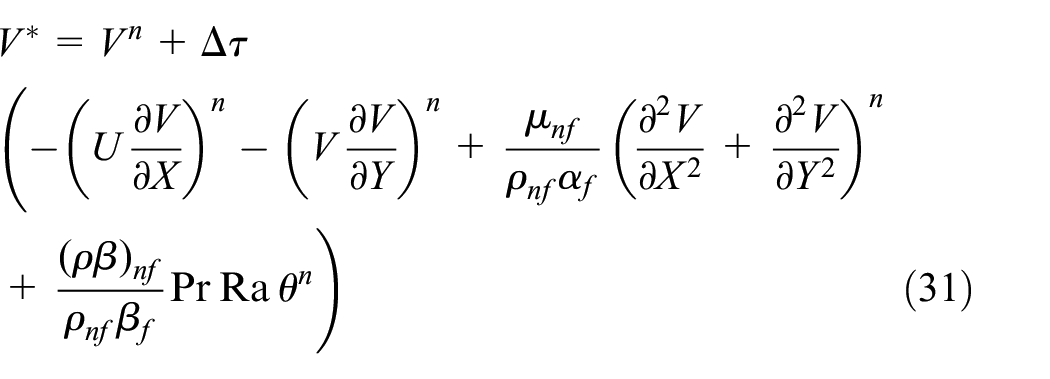
The momentum equation introduced in the generalized model is similar to the convection–diffusion equation and can therefore be discretized in time using the characteristic Galerkin process. In particular, the time discrete momentum equation in its semi-implicit form can be written as follows


Then, we can rewrite equations (26) and (27) as follows

Step 1: predict the velocity
The first step of the CBS algorithm is the calculation of an intermediate velocity

Step 2: solving the pressure Poisson equation
In the second step, the pressure is calculated using the modified Poisson equation, which ensures that the continuity equation is satisfied, and for the generalized model can be written as follows

Step 3: corrected velocity
In the third step, the real velocity values are obtained using the following correction

Step 4: thermal flow problems
The time discretization of the energy equation using forward Euler scheme is written as follows

For the spatial discretization, Galerkin FEM is employed. The trial solutions and weighting function spaces for two-dimensional P1P1 Galerkin FEM are defined as follows
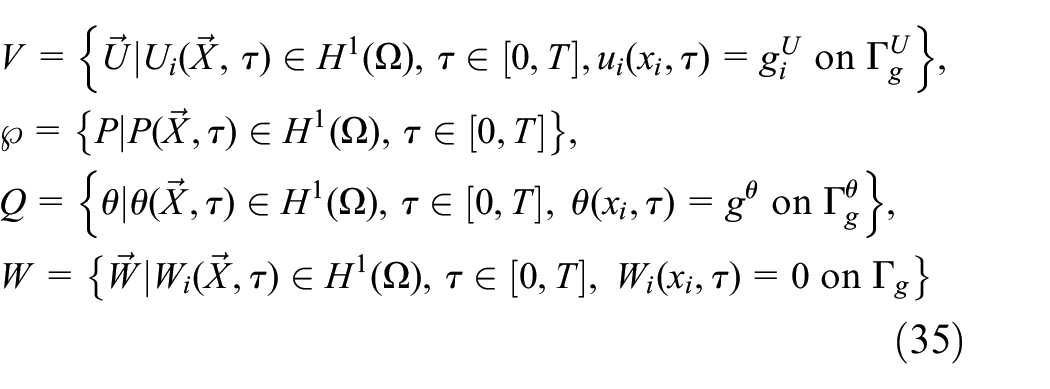
where
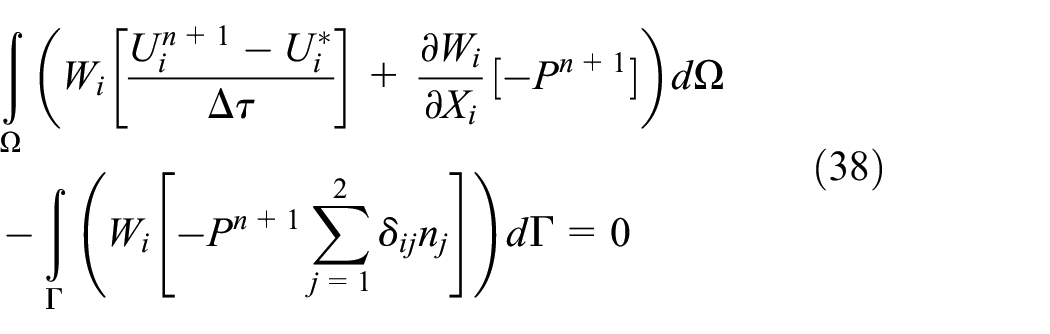
The weak formulation for the governing equation can be written as follows:
Step 1: find

where
Step 2: find

Step 3: find
Step 4: find

The Galerkin approximation is applied by assuming linear interpolation functions

where
Substituting the above interpolations into the weak formulations and integrating using Gauss quadrature rule, we can obtain the semi-discretized equations for
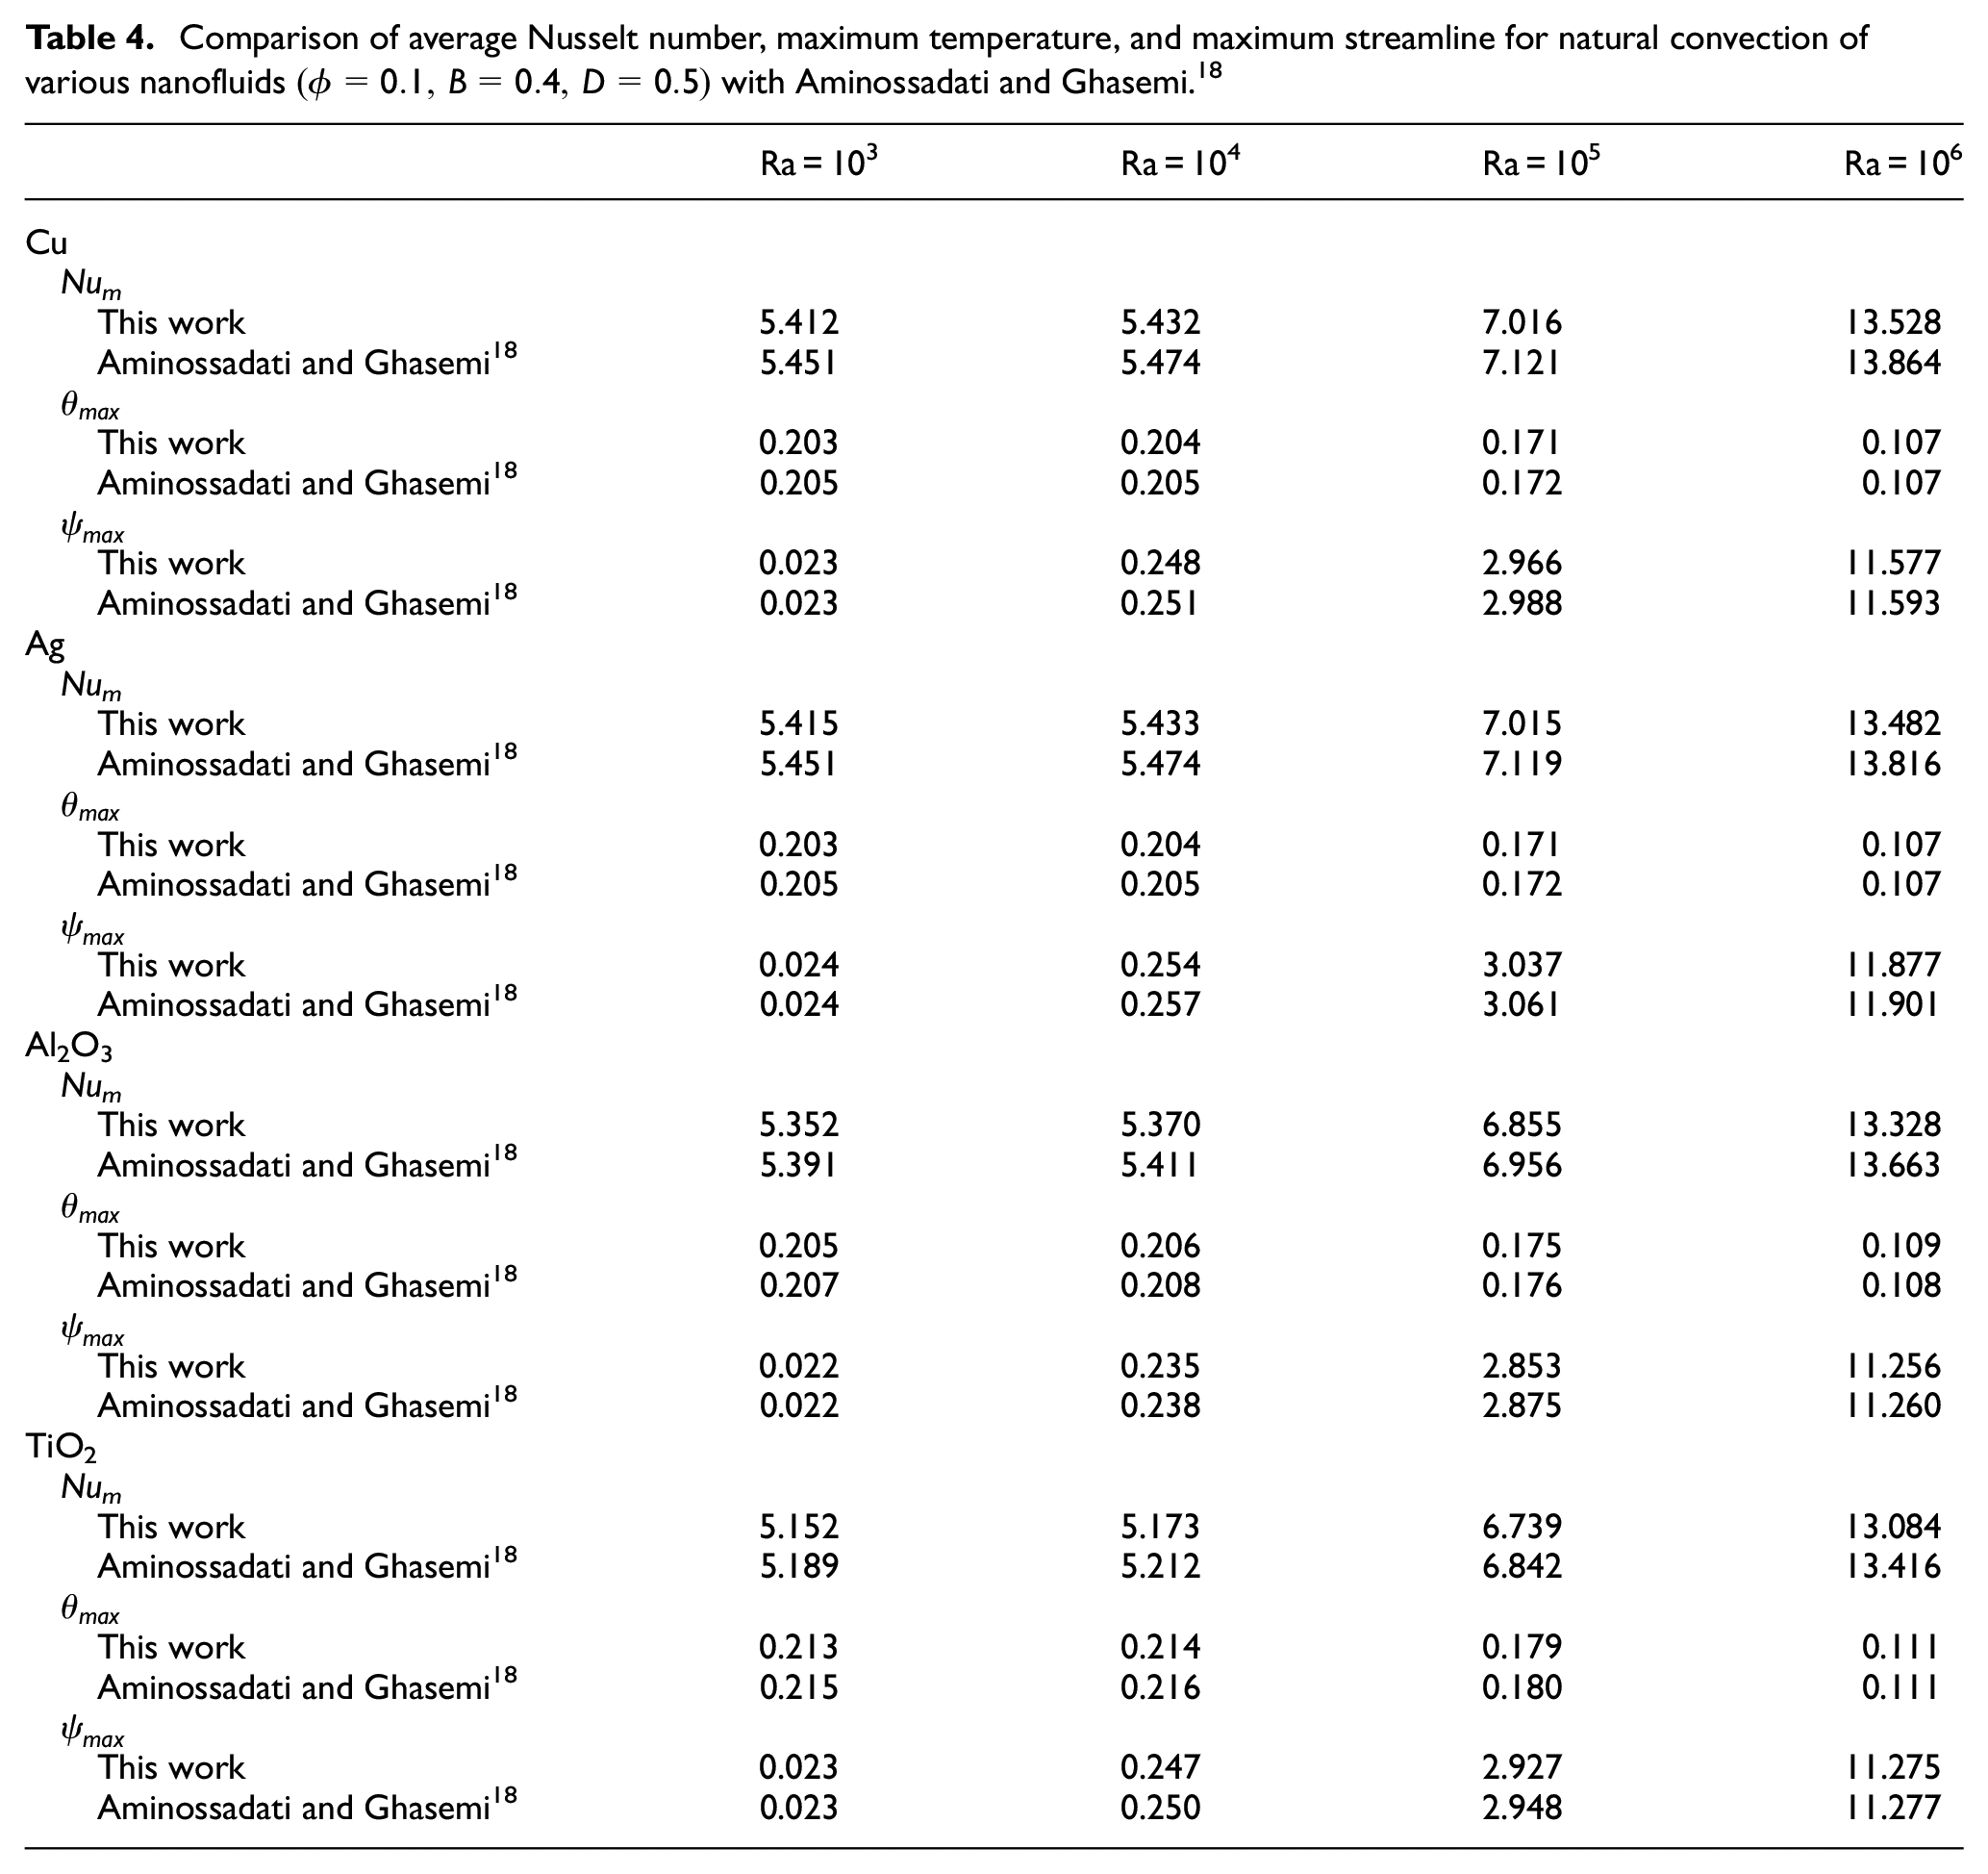
The effect of the grid resolution was examined in order to select the appropriate grid density. Table 2 presents the results of the grid independence test for water–Cu nanofluid with a solid volume fraction of 0.1. The (60 × 60) uniform grid is employed for the remaining simulations based on this test. For validation of numerical code, natural convection heat transfer of a pure fluid with the same configuration of boundary conditions as in Figure 1 (except the constant temperature on the top wall) was solved and is compared with Cheikh et al. 6 and Aminossadati and Ghasemi. 18 Table 3 shows the comparison results. Additionally, we considered natural convection heat transfer for different nanofluids under various Rayleigh numbers and compared these with Aminossadati and Ghasemi. 18 The comparison results are shown in Table 4. The results show good agreement with the previous numerical results.
Grid independency results (water–Cu,


Comparison of average Nusselt number, maximum temperature, and maximum streamline for natural convection of various nanofluids
Results and discussion
Numerical studies for unsteady natural convection in a nanofluid-filled square cavity with a heat source at the bottom were carried out. Different solid volume fractions
Table 5 shows the benchmark results for the average Nusselt number Num, maximum temperature
Benchmark results for case 2: adiabatic condition at the horizontally top wall of the square cavity

In order to demonstrate the variation in temperature and stream fields with various Rayleigh numbers, the streamlines and isotherms for Cu–water nanofluid and pure fluid at different Rayleigh numbers (Ra = 103, 104, 105, and 106) are shown in Figure 2. In general, since the heat source is located at the middle of the bottom wall, symmetrical streamlines with two counter circulating cells and symmetrical isotherms are evident. Figure 2 shows that the shapes of the two vortex cells stay unchanged with increasing Rayleigh number. However, their intensity increases since the buoyant forces become stronger as the Rayleigh number increases. Moreover, at the same Rayleigh number, the streamlines of pure fluid show greater intensity compared with those of the nanofluid. Isotherms clearly display different behaviors as the Rayleigh number changes. For the cases of Ra = 103 and 104, where conduction dominates the flow regime, the isotherms are distributed uniformly with similar parabolic patterns inside the cavity. As the Rayleigh number increases, isotherms spread out to two side walls and descend along two sides toward the heat source. Figure 2 also shows that the addition of nanoparticles to pure water reduces the strength of the flow field. A similar conclusion was reached by other researchers such as Ho et al. 26 and Aminossadati and Ghasemi. 18 This reduction of flow strength is more considerable at low Rayleigh numbers where conduction heat transfer dominates the flow field. Figure 2 also points out that as nanoparticles are added, the maximum dimensionless temperature is reduced, indicating enhanced enclosure cooling performance.

Streamlines (left) and isotherms (right) for the cavity filled with Cu–water nanofluid,
Figure 3 shows the streamlines and isotherms for Cu–water nanofluid for different locations of the heat source. The streamline patterns clearly show that there are two asymmetrical circulating cells with unequal strengths dominating the flow when the heat source is not located at the middle of the bottom wall. As the heat source moves from the left wall toward the middle of the bottom wall, the two circulating flow cells change in strength, and two symmetrical vortices with equal intensity are eventually found in the cavity in the case of

Streamlines (left) and isotherms (right) for the cavity filled with Cu–water nanofluid,
The effect of heat source length on streamlines and isotherms at the same Rayleigh number (Ra = 105) is shown in Figure 4. Symmetrical streamlines and isotherms are observed since the heat source is located in the middle of the bottom wall. As the length of the heat source increases, the maximum temperature increases and the isotherm intensity becomes more considerable. Thus, an increase in heat source length leads to greater heat generation rates and stronger buoyant forces, which intensify the circulating vortices and increase the value of the temperature field.

Streamlines (left) and isotherms (right) for cavity filled with Cu–water nanofluid,
The effect of the length and distance of the heat source on the vertical velocity is illustrated in Figure 5. Figure 5(a) shows that as the distance (D) of the heat source increases from 0.2L to 0.5L, the asymmetrical vertical velocity profile along the mid-section gradually changes to a symmetrical one, and the maximum vertical velocity increases. The highest value of vertical velocity is found when the heat source is at the middle of the bottom wall (D = 0.5L). In Figure 5(b), the effect of various heat source lengths (B) at D = 0.5L on vertical velocity is illustrated. Symmetrical velocity profiles are found for all the values of heat source length (B), and the absolute magnitude of the vertical velocity increases as the heat source length (B) increased. It is clear that heat flow rate and the total heat input increased due to a greater heat source length; consequently, an increase in the buoyancy forces is observed, resulting in a high vertical velocity.

Vertical velocity profiles along the mid-section of the cavity for (a) different locations of the heat source (Cu–water, Ra = 105, B = 0.4L and
The effect of heat source distance (D) on the average Nusselt number and maximum temperature for various Rayleigh numbers is shown in Figure 6. Figure 6(a) shows that the average Nusselt numbers for low Rayleigh numbers, Ra = 103 and 104, are similar. The Nusselt numbers in these cases decrease as D increase from 0.2L to 0.5L. For the case of Ra = 105, the average Nusselt numbers are higher than those of Ra = 103 and 104 cases due to an enhancement in buoyant flow. However, there is only a mild difference in the trend compared with those for low Rayleigh numbers (Ra = 103 and 104). The Nusselt numbers for Ra = 105 also decrease as D increases from 0.2L to 0.5L but with a smaller slope compare to that of Ra = 103 and 104. Differences in the trend and value of the average Nusselt number are clearly observed for high Rayleigh numbers (Ra = 106). The average Nusselt number in case of Ra = 106 is much higher than that of Ra = 105. Importantly, a minimum average Nusselt value is observed at D = 0.3L in case of Ra = 106. In contrast to the behavior of the average Nusselt number with varying D, Figure 6(b) shows that the maximum temperature increases as the heat source moves to the middle of the bottom wall for low Rayleigh numbers, and it reaches a maximum value at D = 0.3 for Ra = 106.

(a) Average Nusselt number and (b) maximum temperature under the effect of Rayleigh number along with different heat source locations (Cu–water, B = 0.4L, and ϕ = 0.1).
Figure 7 shows that at the same Rayleigh number, the greater length of the heat source leads to a higher heat generation rate and, consequently, a reduction in average Nusselt number. For a relatively small Rayleigh number (Ra = 103, 104, and 105), the average Nusselt numbers gradually decrease as B becomes higher. However, for high Rayleigh numbers (Ra = 106), due to a stronger buoyant effect on flow behavior, a descending linear line with higher slope is found.

Average Nusselt number for different lengths of the heat source under the effect of Rayleigh number (Cu–water, D = 0.5L, and ϕ = 0.1).
Figure 8 shows the symmetrical local Nusselt number profiles along the bottom wall under the effect of different lengths of the heat source

Local Nusselt number for different lengths of the heat source (Cu–water, Ra = 105, D = 0.5L, and ϕ = 0.1).
Development and transition of the thermal layer inside the cavity at high Rayleigh number (Ra = 107) are presented in Figure 9. After an origination of the sudden heat flux, hot layers of fluid are formed at the adjacent heat source

Isocontours of thermal layer along with dimensional time
Figure 10(a) shows the temporal variations of dimensionless maximum temperature of the heat source. The flow development after imposing a sudden heat flux at the bottom wall can be classified into three stages: an initial stage, a transitional stage, and a steady stage. In the initial stage, a sudden heat source induces development of a thermal layer at the adjacent heat source, which is dominated by pure conduction. As a result, a rapid increase in the maximum temperature from zero is observed in this stage. A transitional stage then occurs after the initial state. It is characterized by an intermediate oscillatory period in case of Ra = 106 and 107. A convection-dominant steady stage is reached with gradual decay of oscillation. A drop in maximum temperature at the end of the initial stage was found for relatively high Rayleigh numbers (Ra = 106 and 107). As discussed in Figure 9, there is a sequence of traveling waves generated by the heat source rising up to the top wall and subsequently spreading out and down along the two cold side walls of the cavity. These waves then return to the center and impact the new hot traveling waves coming up from the bottom wall. This impact between the cooled traveling waves and hot waves causes a sudden drop in maximum temperature for Ra = 106 and 107. The higher Rayleigh numbers lead to an increase in the gradient of maximum temperature drop. A sharper descent line at the end of the initial stage can be easily observed for Ra = 107 compared with the lower slope for Ra = 106. For small Rayleigh numbers (Ra = 103, 104, and 105), traveling waves move slowly, and, consequently, the impact between the cooled traveling waves and hot waves is weak. No oscillation in the transitional stage or temperature drop is observed for these cases.

Time histories of (a) maximum heat source temperature and (b) average Nusselt number at various Rayleigh numbers (B = 0.4L, D = 0.5L, and ϕ = 0.1) for different types of nanofluid.
Figure 10(b) presents the time histories of the average Nusselt number for different types of nanoparticles at various Rayleigh numbers. Generally, the time required for reaching the steady state decreases as Rayleigh number increases. It can be seen that the Nusselt number lines start with a sudden sharp initial decrease due to low temperature at origination. After reaching certain values, these lines shift upward and pass through a transitional state. Finally, the average Nusselt number lines become stable in the steady stage. As aforementioned discussion in Figure 10(a), no oscillation was found for low Rayleigh number cases (Ra = 103, 104, and 105). However, for high Rayleigh numbers, a recovery from sharply descending values and oscillation occurs at the end of the initial stage. As Rayleigh number increases, the degree of oscillation increases. Figure 10(b) indicates that adding nanoparticles into the base fluid leads to an increase in average Nusselt number and affects the transient behavior. More specifically, for Ra = 105, temporal nanofluid average Nu lines show no oscillation in the transitional stage but the oscillation occurs in the case of pure fluid.
Variation of average Nusselt number for different Rayleigh numbers with solid volume fraction

Average Nusselt number at different values of solid volume fraction for different nanoparticles materials under the effect of Rayleigh number.
In addition, the percentage of the maximum temperature reduction of heat source is a significant parameter in evaluation for the effect of added nanoparticles and the thermal design. Figure 12 shows that at low Rayleigh number (Ra = 103 and 104), where conduction dominates the heat transfer process, adding nanoparticles into a base fluid and increasing solid volume fraction provide significant temperature reduction. Particularly, addition of 20% Cu nanoparticle shows the highest temperature reduction of 42.78% for Ra = 103. At high Rayleigh numbers, the temperature reduction tends to show contradictory trends. Although convection dominates the flow regime at high Rayleigh numbers, heat reduction performance is much lower compared to the low Rayleigh number case.

Percentages of temperature reduction at different values of solid volume fraction for different nanoparticles materials under the effect of Rayleigh number.
Pressure distribution along the mid-section of the cavity is shown in Figure 13. The highest pressure was observed at the center of the mid-section (x = 0.5L). Pressure for different nonofluid flow depends strongly on the specific heat of nanoparticles, Cp. Nanofluid based on higher specific heat nanoparticles creates higher pressure field. The specific heat values of Al2O3 and TiO2 are comparable and approximately two times greater than those of Cu and Ag. Hence, the pressure for Cu and Ag nanofluids are lower than those of Al2O3 and TiO2 nanofluids.

Pressure profiles along the mid-section of cavity for different nanofluids.
Conclusion
Unsteady natural convection in a nanofluid-filled square enclosure cavity with a heat source at the bottom was numerically studied using a CBS scheme in the FEM method. In particular, the effects of Rayleigh number, solid volume fraction as well as the location and length of the heat source on the flow and temperature fields and heat transfer characteristics were investigated by considering various water-based nanofluids including Cu, Ag, Al2O3, and TiO2 nanoparticles.
The heat transfer performance in the nanofluid enclosure was higher compared with that of the pure water. Nanofluids with higher specific heat nanoparticles produce higher cooling performance, especially at low Rayleigh number. For Ra = 103, the addition of 20% Cu nanoparticle to pure fluid leads to 42.78% reduction of heat source maximum temperature.
For low Rayleigh numbers, the maximum flow temperature increases as the heat source moves from the left cold wall to the center. However, at high Rayleigh numbers, there is a critical value where the lowest heat transfer arises at D = 0.3 L.
Increasing the heat source length leads to increase in heat generation rate. Hence, the maximum temperature increases and the average Nusselt number along the heat source decreases. The nanoparticles with higher specific heat (Cp) result in higher pressure field.
In unsteady high Rayleigh number flow, oscillations of the maximum temperature and average Nusselt number were observed at the transitional stage. These oscillations were found to start at lower Rayleigh number in pure water than in nanofluid.
Footnotes
Appendix 1
Academic Editor: Cheng-Xian Lin
Declaration of conflicting interests
The author(s) declared no potential conflicts of interest with respect to the research, authorship, and/or publication of this article.
Funding
The author(s) disclosed receipt of the following financial support for the research, authorship, and/or publication of this article: This work was supported by the 2015 Research fund of University of Ulsan.