
Abstract
In this study, an experiment on the evaporation of nanofluid sessile droplet on a heated surface was conducted. A nanofluid of 0.5% volumetric concentration mixed with 80-nm-sized CuO powder and pure water were used for experiment. Droplet was applied to the heated surface, and images of the evaporation process were obtained. The recorded images were analyzed to find the volume, diameter, and contact angle of the droplet. In addition, the evaporative heat transfer coefficient was calculated from experimental result. The results of this study are summarized as follows: the base diameter of the droplet was maintained stably during the evaporation. The measured temperature of the droplet was increased rapidly for a very short time, then maintained constantly. The nanofluid droplet was evaporated faster than the pure water droplet under the experimental conditions of the same initial volume and temperature, and the average evaporative heat transfer coefficient of the nanofluid droplet was higher than that of pure water. We can consider the effects of the initial contact angle and thermal conductivity of nanofluid as the reason for this experimental result. However, the effect of surface roughness on the evaporative heat transfer of nanofluid droplet appeared unclear.
Introduction
The boiling and evaporation of droplet are very important phenomena for industrial applications using atomized liquids such as fuel spray, spray cooling, and spray painting.1–3 Baumeister and Simon 4 studied the evaporation of droplets on a hot surface and reported a prediction technique for the Leidenfrost temperature. Toda 5 developed a heat transfer model of a single droplet impacting on a hot surface. Thereafter, several researchers conducted theoretical studies to develop a heat transfer mechanism for the evaporation of droplet.6–8 Recently, studies aimed at improving the evaporative heat transfer using enhanced surfaces have been actively conducted.9–10 They found that enhanced surfaces such as microporous coated or micro-structured silicon surface increase the evaporative heat transfer of spray cooling. Choi and colleagues11,12 reported that the thermal conductivity of nanofluid could be enhanced compared to pure liquid, and studies on the application of nanofluid in phase change heat transfer (boiling, evaporation, etc.) have been conducted.13–15 In prior studies by the author, the contact angle of nanofluid droplet was experimentally researched as a basic approach to the phase change heat transfer of nanofluid. 16 The result of this study showed that the initial contact angle of the droplet increased with the surface roughness and that the contact angle of the nanofluid droplets tended to become slightly smaller than that of pure water. However, there remain many unidentified phases in the evaporation of nanofluid droplet. In this study, an experiment on the evaporation of nanofluid sessile droplet on a heated surface was conducted. Droplet was applied to the heated surface, and images of the evaporation process were obtained. The recorded images were analyzed to find the volume, diameter, and contact angle of the droplet. The evaporative heat transfer coefficient was calculated based on experimental result. In addition, the effect of surface roughness on the evaporative heat transfer was investigated.
Experimental apparatus and method
A nanofluid of 0.5% volumetric concentration mixed with 80-nm-sized CuO powder and pure water were used. No additive was employed to enhance the floating stability of the nanoparticles, but the nanofluid was stably floated by supersonic vibration for 2 h before the experiment. The experimental apparatus is illustrated in Figure 1. Droplet shape analysis system (Krüss DSA100) was applied to analyze the shape of the droplet. The temperature of the heat transfer surface was maintained at a constant value. Then, 9–10 μl nanofluid droplets were applied to the surface, and images of the evaporation process were obtained. The recorded images were analyzed to find the volume, diameter, and contact angle of the droplet.

Schematic of the experimental apparatus.
As illustrated in Figure 2, two 0.5 mm-diametered K-Type thermocouples were used for the measurement. One was placed at 0.5 mm away from the heat transfer surface for the measurement of droplet temperature during the evaporation. The experiment for the measurement of droplet temperature was conducted separately. The thermocouple 1 shown in Figure 2 was applied only for the experiment measuring the droplet temperature. The other was inserted into a site 0.75 mm below the heat transfer surface for the measurement of the heat transfer surface. The temperature of the heat transfer surface was calculated using the measured temperature and Fourier’s law of heat conduction. The heat transfer surface was made using a cylindrical copper block with a diameter of 9.0 mm. Nine cartridge heaters (220 W) were installed in the copper block to control the temperature of the heat transfer surface. As mentioned, the effect of the surface roughness on the evaporative heat transfer was also investigated. The heat transfer surfaces were ground using #2000, #220, and #60 sand paper, and then the surface roughness was measured before the experiment. An ultrasonic humidifier was employed to maintain the relative humidity of the laboratory at a constant level.

Measurement of droplet temperature (thermocouple 1 for droplet, thermocouple 2 for the heat transfer surface).
Experimental results and discussion
Photographs of the ground heat transfer surfaces with the #2000, #400, and #60 sand paper are shown in Figure 3. The measured average Ra values were 0.23, 0.66, and 2.29 μm, respectively. 16

Photograph of the copper block surface: (a) #2000, (b) #400, and (c) #60.
The relationship between the power supplied to the cartridge heater and the surface temperature is illustrated in Figure 4. In the experiment, power ranging from 5 to 32 W was supplied to the heater, and then the steady-state temperature of the surface was measured. The surface temperature gradually increased to the range of 35 °C–106 °C along with the increase of the power supply. It was also observed that the surface temperature was kept almost stable while the droplet evaporated.
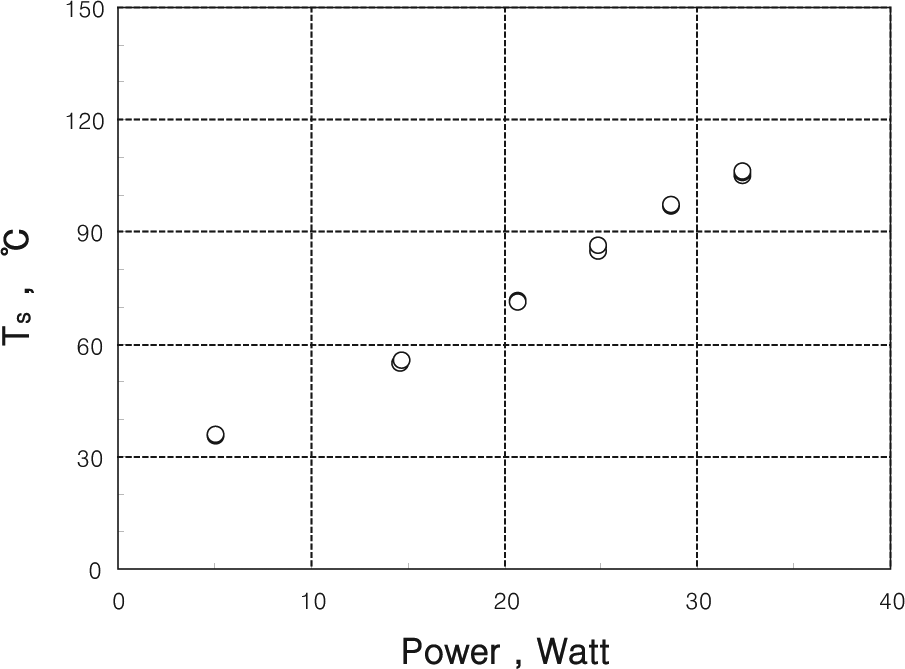
Surface temperature versus power supply.
Figure 5 illustrates the typical result of the measured droplet temperature during the evaporation at Ts ⇋ 71 °C. The measured temperature of the heat transfer surface was also presented in Figure 5. The initial droplet temperature (Tdi) was about 25 °C. As illustrated in Figure 5, the surface temperature was stable during the evaporation. The droplet temperature was increased rapidly for a very short time, then maintained constantly. The mean temperature of the droplet (Tdm) was calculated using this experimental result. Figure 6 illustrates the correlations between the mean temperature of the droplet and the surface temperature.

Results of measured droplet and surface temperature.

Mean droplet temperature versus surface temperature.
Figure 7 illustrates the observed results of the bubble generation and growth for the various surface temperatures using pure water. In the low surface temperature regime, no bubbles were observed on the surface. Many small bubbles appeared in the middle surface temperature regime as illustrated in Figure 7(b). However, bubbles were not growing during the evaporation in this temperature regime. Big bubbles were observed and bubbles were growing fast in the temperature regime near the saturated temperature of liquid as illustrated in Figure 7(c).

Schematics of bubble generation and growth for various surface temperatures: (a) Ts = 35 °C–56 °C (no bubbles or a few bubbles), (b) Ts = 70 °C–85 °C (many small bubbles), and (c) Ts = 97 °C–105 °C (big bubbles and growing fast).
Figure 8 illustrates the measured results of the changes in volume and the diameter of pure water droplet during the evaporation for the middle and high surface temperature regimes. Figure 8(a) and (b) shows the results of each experiment conducted at surface temperatures of 84.2 °C and 105.4 °C. As shown in Figure 8(a), the volume of the droplet with a surface temperature of 84.2 °C gradually decreased over time, but the base diameters of the droplets were almost stable. The gradual growth of small bubbles on the surface was observed. However, as shown in Figure 8(b), the volume of droplet initially increased rapidly and decreased gradually thereafter with a surface temperature of 105.4 °C. This is attributable to the rapid bubble growth inside the droplet on the surface heated over the saturation temperature of the liquid.

Time history of droplet volume and diameter (water): (a) Ts = 84.2 °C and (b) Ts = 105.4 °C.
The experimental results of the nanofluid droplet are illustrated in Figure 9. Each of the results at surface temperatures of 86.1 °C and 105.2 °C is illustrated in Figure 9(a) and (b). The results of the nanofluid droplet were similar to those of pure water droplet, as illustrated in Figure 8, but the volume and diameter of the nanofluid droplets did not reach 0 completely, because the nanoparticles remained on the surface after the evaporation was completed.

Time history of droplet volume and diameter (nanofluid): (a) Ts = 86.1 °C and (b) Ts = 105.2 °C.
Shape images of pure water and nanofluid droplet during the evaporation are shown in Figure 10(a) and (b), respectively. For the pure water droplet shown in Figure 10(a) with a surface temperature of 105 °C, the rapid growth of bubbles was observed at the initial stage of the droplet evaporation. It was hard to observe any bubbles inside the nanofluid droplet shown in Figure 10(b) because the nanofluid was murky. However, we can recognize the bubble growth inside the nanofluid droplet from the shape images. Also, the deposition of nanoparticles on the heat transfer surface was observed at the end of the droplet evaporation. The measured thickness of the deposition layer was about 100–150 μm.

Time history of droplet shape during evaporation: (a) pure water (#2000) and (b) nanofluid (#2000).
Figure 11 illustrates the measured evaporation time of pure water and nanofluid droplet. The experiment was conducted under the same condition of the initial droplet volume and temperature. The experimental result shows that the evaporation rate of nanofluid droplet was higher than that of pure water. We can consider the effects of the initial contact angle and thermal conductivity of nanofluid as the reason for this experimental result. Figure 12 shows the result of the initial contact angle measurement for pure water and nanofluid droplet. 16 The result showed that the initial contact angle increased in both pure water and nanofluid droplet as the surface roughness increased. In a comparison of initial contact angle between pure water and nanofluid droplet, the contact angle of nanofluid droplet was slightly smaller than that of pure water. This fact means that the liquid–solid contact area of nanofluid droplet increases with the decrease of the initial contact angle under the same condition of the droplet volume, which makes the droplet evaporate faster.

Comparison of evaporation time between pure water and nanofluid droplet on the heated surface.

Comparison of contact angles between pure water and nanofluid droplet. 16
Figure 13 illustrates the heat transfer model of the evaporating single droplet for evaluating the effect of thermal conductivity. The heat balance for the evaporating droplet can be expressed as

where Qt is the total heat transfer from the heat transfer surface, Qb is the sensible heat transfer to the droplet, Qe is the latent heat transfer, and Qsurr is the heat transfer to surround through the droplet (convection and radiation). Qb and Qe can be calculated using the following equations, respectively


Heat transfer model for a droplet on the heated surface: (a) heat balance for evaporating droplet on the heated surface and (b) thermal resistance for heat transfer through droplet.
Qsurr is small in the phase change heat transfer, so these heat transfers are negligible. Meanwhile, Qe can be expressed as the sum of Qe,hs and Qe,ds. Qe,ds means the latent heat transfer in the droplet surface (liquid–air contact), and Qe,hs means the latent heat transfer in the heat transfer surface (liquid–solid contact). In the low surface temperature regime, Qe,hs is very small. However, Qe,hs increases with the increase of the surface temperature. Also, the total heat transfer can be expressed using the combined heat transfer coefficient as

where h is the combined heat transfer coefficient and defined as the evaporative heat transfer coefficient in this study. A is the liquid–solid contact area and Δt is the evaporation time. The following equation can be obtained from equations (1) to (3) ignoring the Qsurr

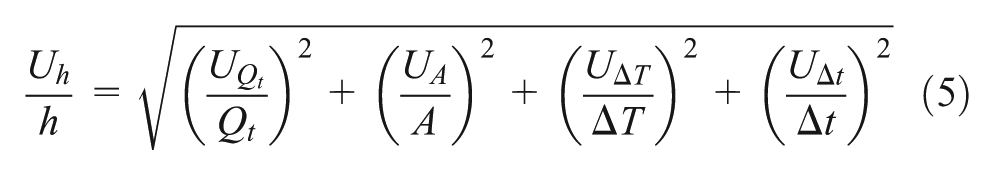
The evaporative heat transfer coefficients calculated from the experimental results are illustrated in Figure 14. For the calculation of the evaporative heat transfer, the mean temperature (Tdm) of the droplet was used. The contact area was also calculated using the measured mean diameter of the droplet. The experimental uncertainty for the evaporative heat transfer coefficients can be expressed as follows 17

Comparison of evaporative heat transfer between pure water and nanofluid droplet.
By considering the errors due to the measured Qt (⇋Qe), A, ΔT (= Ts − Tdm), and Δt, the uncertainty of the evaporative heat transfer coefficients was estimated within 12%. As illustrated in Figure 14, the evaporative heat transfer coefficient increased rapidly with the surface temperature. The average evaporative heat transfer coefficient of the nanofluid droplet was higher than that of pure water. As mentioned, it was presumed that this experimental result was caused by both the initial contact angle and the thermal conductivity of nanofluid. As illustrated in Figure 13(b), we can consider the conduction and convection resistance for the heat transfer through the droplet. A good thermal conductivity of the nanofluid decreases the conduction resistance. In the regime of the high surface temperature near the saturated temperature of the liquid, the convection can be replaced with the boiling heat transfer.
Figure 15 illustrates the effect of surface roughness on the evaporative heat transfer coefficients of nanofluid droplet. In general, the evaporative heat transfer of pure liquid is improved with the decrease of surface roughness because the liquid–solid contact area also increases. It is also known that increased surface roughness at high surface temperature such as nucleate boiling increases the bubble growth rate, which improves the boiling heat transfer. However, the experimental result shows that the effect of the surface roughness on the evaporative heat transfer of nanofluid droplet appeared unclear. Such an experimental result was attributable to the nanoparticles deposited on the heat transfer surface, which reduced the difference in the surface roughness. Further investigation is required to completely understand this experimental result.

Effect of surface roughness on evaporative heat transfer in nanofluid droplet.
Conclusion
An experiment on the evaporation of nanofluid droplet on a heated surface was conducted, and the evaporative heat transfer coefficient was calculated from the experimental result. The results are summarized as follows:
The base diameter of the droplet was maintained stably during the evaporation. The measured temperature of the droplet was increased rapidly for a very short time, then maintained constantly. The nanofluid droplet was evaporated faster than the pure water droplet under the experimental conditions of the same initial volume and temperature, and the average evaporative heat transfer coefficient of the nanofluid droplet was higher than that of pure water. We can consider the effects of the initial contact angle and thermal conductivity of nanofluid as the reason for this experimental result.
The effect of surface roughness on the evaporative heat transfer of nanofluid droplet appeared unclear. The deposition of nanoparticles on surfaces reduced the difference of surface roughness, which made its effect insignificant on the evaporative heat transfer of nanofluid droplet.
Footnotes
Appendix 1
Acknowledgements
This research was supported by Basic Science Research Program through the National Research Foundation of Korea (NRF) funded by the Ministry of Education, Science and Technology (No. 2011-0007117).
Academic Editor: Moran Wang
Declaration of conflicting interests
The author declares that there is no conflict of interest.