
Abstract
This article focuses on the shift strategy of hydro-mechanical infinitely variable transmission. A computer simulation is carried out to investigate the shift strategy, and the simulation results are verified by the test data. There are four typical working conditions in the continuous shift process, among which the shift process from F2(N) to F3(P) plays a decisive role in shift quality. The shift strategy based on the physical parameters from F2(N) to F3(P) is lower engine rotating speed, smaller load torque, lower main circuit pressure, and larger speed valve flow rate. The shift strategy based on the shift time from F2(N) to F3(P) is to switch the third group of clutches first, then disengage the first group of clutches, and engage the second group of clutches at last. The results show that the shift quality of hydro-mechanical infinitely variable transmission can be improved greatly by the optimization of physical parameters and shift time.
Keywords
Introduction
Hydro-mechanical infinitely variable transmission (HMIVT) is a combined stepless speed change device, which is mainly composed of the hydraulic speed regulation mechanism and the mechanical speed variation mechanism.1–3 Because of the stepless speed change in hydraulic transmission and the high efficiency of mechanical transmission, HMIVT has attracted more and more attention.4–8 In a long period, however, the research on HMIVT has focused on the construction design and performance study.9–12 With the increasing requirements of vehicle ride, more and more importance has been attached to the research on the shift strategy. So this article focuses on the shift strategy from the perspective of physical parameters and shift time.
The shift process of HMIVT is a sophisticated dynamics process. There are many factors affecting the shift quality, such as external factors (e.g. power source and load), self-factors of HMIVT (e.g. hydraulic system and transmission system), and control system of clutches (e.g. main circuit pressure and speed valve flow rate). As mentioned above, self-factor is related to the design scheme of HMIVT; the physical parameters discussed in this article mainly involve four factors: engine rotating speed, load torque, main circuit pressure, and speed valve flow rate.13,14 Studying on the shift strategy usually does not involve shift time, because most of the shift process in the same ranges only involve two clutches, in which shift time plays a limited role in providing shift quality. However, the shift quality involving multi-group clutches is not only related to the design parameters of the clutch itself but also affected by the shock of other clutches, which makes the modeling, simulation, and test more and more difficult. Since tractors often work under extreme conditions, the study on the shift shock is very important.
This article aims to solve the optimal shift strategy problem of transmission involving multi-group clutches and build the simulation model of HMIVT based on Simulation X, using output shaft speed drop amplitude, output shaft dynamic load coefficient, output shaft maximum degree of shock, and shift time as evaluation indexes to analyze transmission involving multi-group clutches. Based on the continuous shift process analysis of transmission, the typical working conditions that influence the shift quality of transmission can be concluded, and the simulation study and experimental validation of the shift strategy based on the physical parameters and the shift strategy based on the shift time are also conducted.
Construction of HMIVT and evaluation index for shift quality
Construction of HMIVT
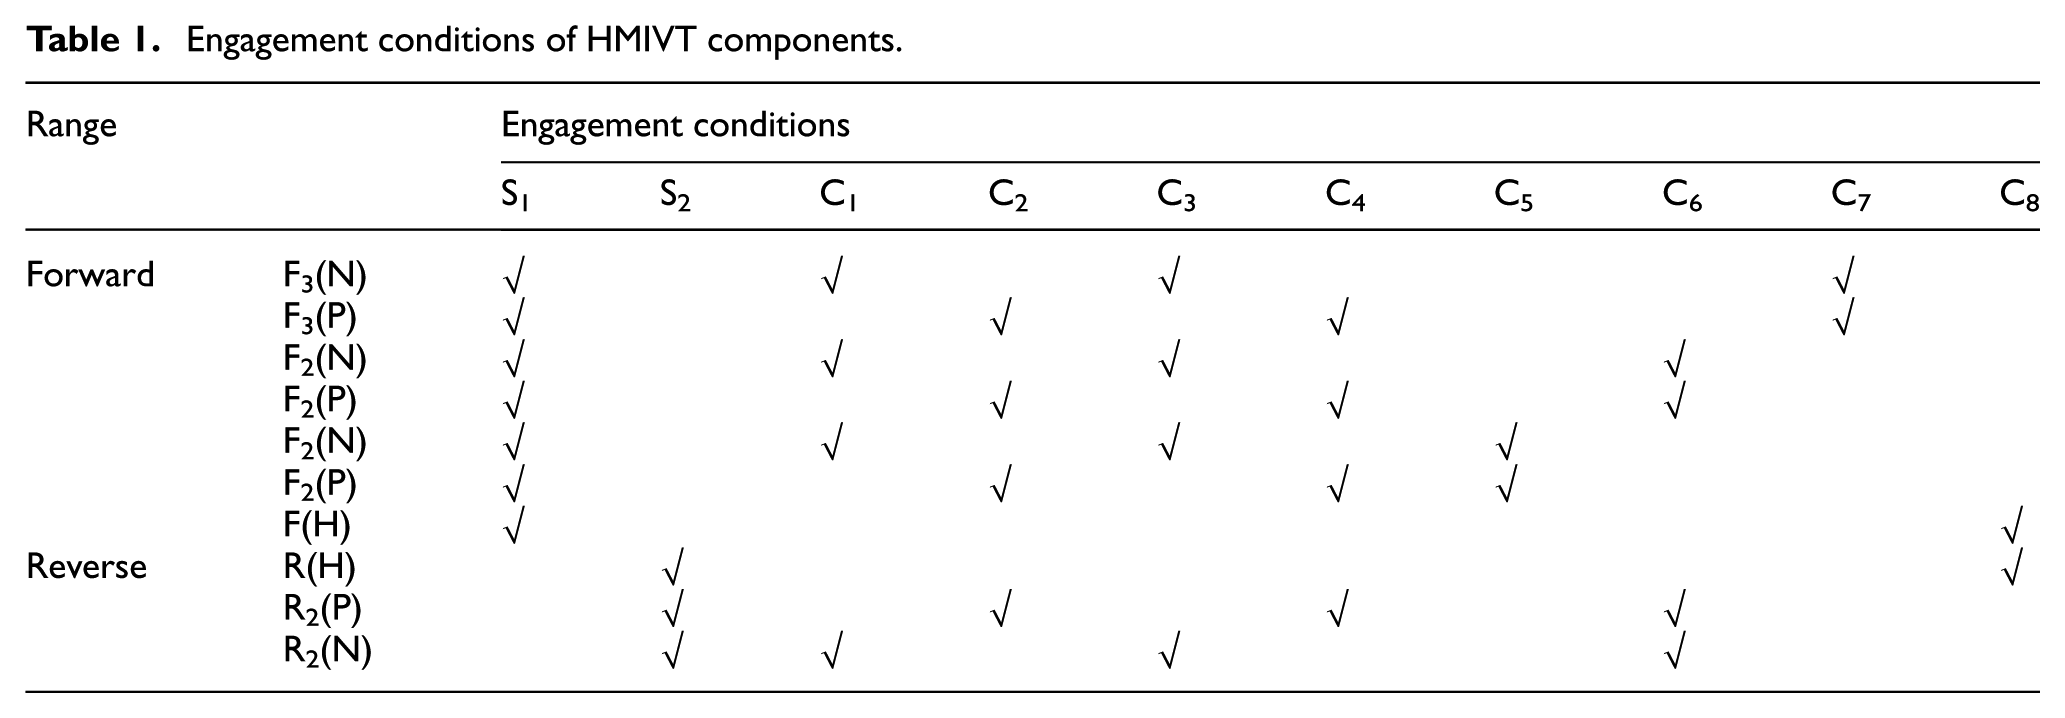
To optimize the shift strategy, an HMIVT is selected as the research object. The construction of HMIVT is shown in Figure 1. 15 Table 1 shows the engagement conditions of HMIVT components.

Construction of HMIVT.
Engagement conditions of HMIVT components.
Simulation model of HMIVT
According to the construction of HMIVT in Figure 1, the simulation model of HMIVT based on Simulation X is shown in Figure 2. The simulation model of HMIVT consists of five parts: (1) engine speed and load torque, (2) hydraulic speed regulation system, (3) mechanical transmission system, (4) gear trains and shafting, and (5) hydraulic control system of clutches. Among them, the hydraulic control system of clutches is the core module for the research of shift strategy, which is shown in Figure 3.

Simulation model of HMIVT.

Simulation model of hydraulic control system of clutches.
HMIVT efficiently realizes stepless speed change by mechanical transmission and hydraulic transmission. Clutches are controlled by the solenoid directional control valves during the shift. Because of the smaller flow requirement of main circuit, a small displacement fixed pump is used as the oil driving device. The main circuit pressure is controlled by the pressure valve; meanwhile, the speed control valve flow rate is controlled by the corresponding directional control valve.
Evaluation index for shift quality
In this article, the output shaft speed drop amplitude, output shaft dynamic load coefficient, output shaft maximum degree of shock, and shift time are selected as the evaluation indexes of shift quality.
Output shaft speed drop amplitude
The output shaft speed drop amplitude reflects the rotating speed fluctuation during shifting, which can be expressed as

where δ is the output shaft speed drop amplitude, no is the output shaft steady speed, and nomin is the output shaft minimum speed.
Output shaft dynamic load coefficient
The output shaft dynamic load coefficient reflects the torque fluctuation during shifting, which can be expressed as
where γ is the output shaft dynamic load coefficient, To is the output shaft steady torque, and Tomax is the output shaft maximum torque.
Output shaft/intermediate shaft maximum degree of shock
The degree of shock reflects the vibration and shock of shaft. The output shaft maximum degree of shock and intermediate shaft maximum degree of shock are applied to analyze the different actions of clutches during shifting. The output shaft maximum degree of shock can be expressed as

where jmax is the output shaft maximum degree of shock, rq is the driving wheel radius, i o is the main reducer transmission ratio, and iLB is the wheel-side transmission ratio.
Shift time
The shift process involves two clutches experiencing four stages: before switching, torque phase, inertial phase, and after switching, so the shift process involving more clutches will be much complicated; this article holds that the shifting is finished when the output shaft rotating speed reaches 99% of the steady rotating speed.
Continuous shift process of HMIVT
According to the simulation model in Figure 2, the conditions of clutches and the displacement of variable pump are controlled at every 10 s. The simulation curves of continuous shift process are shown in Figure 4.

Simulation curves of continuous shift process.
The rotating speed curves reflect the speed change in shafts, and the angular acceleration curves reflect the torque fluctuation of shafts. We can conclude that the shift process from F2(N) to F3(P) plays a decisive role in improving the shift quality during the whole process.
Shock is caused by the switch time difference of clutches during shifting. Load torque leads to a rapid decrease in the output shaft rotating speed, and the output shaft rotating speed will reach the minimum value, when its transmission torque realizes the balance between the most related clutch and the load. This article takes the shift process from F2(N) to F3(P) for example to study shift control strategy based on the physical parameters and shift time.
Analysis on the shift strategy based on the physical parameters
Simulation analysis
The study on shift quality based on the physical parameters is actually solving a optimization problem, which involves multi-factor and multi-evaluation index, so this article chooses the L9(34) orthogonal table as a research method. Range method is used to analyze the simulation results due to the uniqueness of simulation data, and variance analysis method is applied to analyze the test results due to the existence of test error. According to the comparison between the sum of squares and error square sum, F-test is used to draw the conclusions concerning the variance analysis.
Factor A represents the engine rotating speed, the three levels of which are, respectively, 900, 1200, and 1500 r/min; Factor B represents the load torque, the three levels of which are, respectively, 75, 100, and 125 N m; Factor C represents the main circuit pressure, the three levels of which are, respectively, 3, 4, and 5 MPa; Factor D represents the speed valve flow rate, the three levels of which are, respectively, 3, 4, and 5 L/min. The output shaft speed drop amplitude, dynamic load coefficient, maximum degree of shock, and shift time are expected to be used as evaluation indexes I, II, III, and IV. Each index should be tested nine times; the conclusions of range analysis of shift quality based on the physical parameters are shown in Table 2.
Range analysis table of shift quality based on the physical parameters.

There is some difference among the optimal schemes in Table 2, so the principal aspect of contradiction should be emphatically solved according to the data above. The scheme A3B1D3C1 can be substituted by the scheme A3B1D3 for evaluation index I, the range of which is changed from (9.91%, 29.38%) (all schemes) to (9.91%, 10.88%) (scheme A3B1D3); the scheme B3C1A1D1(3) can be substituted by the scheme B3C1 for evaluation index II, the range of which is changed from (1.88, 3.24) (all schemes) to (1.88, 1.97) (scheme B3C1); the scheme B1C1A2D2 can be substituted by the scheme B1C1A2 for evaluation index III, the range of which is changed from (7.95, 13.63) (all schemes) to (7.95, 8.61) (scheme B1C1A2); the scheme D3B1C1A1 can be substituted by the scheme D3B1 for evaluation index IV, the range of which is changed from (1.24, 2.23) (all schemes) to (1.24, 1.37) (scheme D3B1).
HMIVT test bench
HMIVT test bench includes mechanical transmission system and computer measurement and control system. The mechanical transmission system mainly includes engine, torque–speed transducers, HMIVT, valve assembly, and dynamometer. The computer measurement and control system, which is shown in Figure 5, is composed of an upper machine and two lower machines. The upper machine exchanges data with serial ports and data acquisition cards, and the lower machines perform data acquisition. The upper machine and the lower machines are communicated by the CAN interface cards, and the LabVIEW is used as the software development platform.16–19

Computer measurement and control system.
Test verification
The variance analysis method of orthogonal test should be used to study the shift quality based on the physical parameters. Test schemes for each evaluation index should be divided into nine groups, while each group should be tested four times. We choose F-test to draw the significant conclusions; the comparison of the simulation results and test results is shown in Table 3.
Comparison of simulation results and test results.

Fα(2,27) > 5.49(***), 5.49 ≥ Fα(2,27) > 3.47(**), 53.47 ≥ Fα(2,27) > 2.51(*).
There are some differences in the simulation results and test results, which are caused by the model simplification and test error. However, the results of the test basically tally with the simulation results. That is to say, engine rotating speed and load torque play major roles in evaluation index I, followed by speed valve flow rate; load torque plays a major role in evaluation indexes II and III, followed by main circuit pressure; speed valve flow rate plays a major role in evaluation index IV, followed by load torque and main circuit pressure.
The shift strategy based on the physical parameters is lower engine rotating speed, smaller load torque, lower main circuit pressure, and larger speed valve flow rate. It is noteworthy that the shift strategy discussed above is the whole control strategy. If there are some special requirements on the evaluation index, the corresponding control strategies will be changed. Single-factor loading tests can be used to analyze shift strategy based on the physical parameters, the results which are shown in Table 4. The test results of shift strategy based on the physical parameters are shown in Figure 6. According to the test comparison diagrams based on the physical parameters, the shift quality in Test 3 is superior to that in Tests 1 and 2.
Test schemes of shift strategy based on the physical parameters.


Test comparison diagrams based on the physical parameters.
Analysis on the shift strategy based on the shift time
Simulation analysis
According to the analysis above, the shift process from F2(N) to F3(P) involves six clutches, which can be divided into three groups: Group 1(C1, C3), Group 2(C2, C4), and Group 3(C6, C7). The longer the switch time, the larger the shaft speed fluctuation amplitude; the shorter the switch time, the tighter the clutches’ engagement conditions, so the switch time of clutches in the same group does not show distinctive difference, while the shift time difference exists in the different groups of clutches, which provides theoretical basis by grouping study.
Switch strategy of clutches between groups
Factors A, B, and C, respectively, represent the first, the second, and the third groups of clutches, and Factor D is the blank column. Levels 1, 2, and 3, respectively, represent the different switch time of clutches (9.50, 10.00, 10.50 s). The output shaft speed drop amplitude, output shaft dynamic load coefficient, intermediate shaft maximum degree of shock, and output shaft maximum degree of shock are expected to be used as evaluation indexes I, II, III, and IV. Test schemes for each evaluation index can be divided into nine groups; the conclusions of range analysis based on the shift time are shown in Table 5.
Range analysis table of shift quality based on the shift time between groups.

According to the range analysis data in Table 5, the scheme C1B3A3 can be substituted by the scheme C1B3 for evaluation index I, the range of which is changed from (−1.30%, 49.07%) (all schemes) to (−1.30%, 5.01%) (scheme C1B3); the scheme B3C2(C2B3)A3 can be substituted by the scheme B3C2(C2B3) for evaluation index II, the range of which is changed from (2.02, 3.08) (all schemes) to (2.02, 2.34) (scheme B3C2(C2B3)); the scheme B3A3C3 can be substituted by the scheme B3A3 for evaluation index III, the range of which is changed from (9.19, 54.08) (all schemes) to (9.19, 25.50) (scheme B3A3); the scheme A3C2B2 can be substituted by the scheme A3C2 for evaluation index IV, the range of which is changed from (4.56, 21.02) (all schemes) to (4.56, 6.25) (scheme A3C2). The shift strategy of clutches among groups is that clutches in Group 3 should be switched earlier than that in Group 1 and Group 2, which provides theoretical basis for the discussion below.
Switch strategy of clutches in Group 3
Single-factor loading test can be used to analyze switch strategy of clutches in Group 3. The switch time of clutches is shown in Table 6. The shift quality simulation results of clutches in Group 3 are shown in Figure 7.
Switch time of clutches (switch strategy of clutches in Group 3).


Shift quality simulation results of clutches in Group 3.
The output shaft lowest speed, respectively, reaches 1066.27, 1021.80, and 1059.50 r/min in 10.94,11.05, and 10.85 s, so the output shaft speed drop amplitude is, respectively, 7.15%, 6.39%, and 7.74%, which shows that the switch time has little effect on evaluation index I. The output shaft maximum torque, respectively, reaches 187.90, 189.59, and 203.11 N m in 11.21, 11.35, and 11.09 s, so the output shaft dynamic load coefficient is, respectively, 1.88, 1.89, and 2.03, which shows that there is little difference on evaluation index II when the switch time of C6 is no later than that of C7. The intermediate shaft maximum degree of shock, respectively, reaches 27.40, 19.76, and 20.32 in 11.13, 11.13, and 11.09 s, which shows that evaluation index III has excellent performance when the switch time of C6 is not earlier than that of C7.
The output shaft maximum degree of shock, respectively, reaches 8.24, 8.48, and 13.03 in 11.23, 11.36, and 10.99 s, which shows that evaluation index IV has excellent performance when the switch time of C6 is not later than that of C7. According to the analyses above, the control strategy of clutches in Group 3 is that clutches C6 and C7 are switched at the same time.
Switch strategy of clutches in Groups 1 and 2
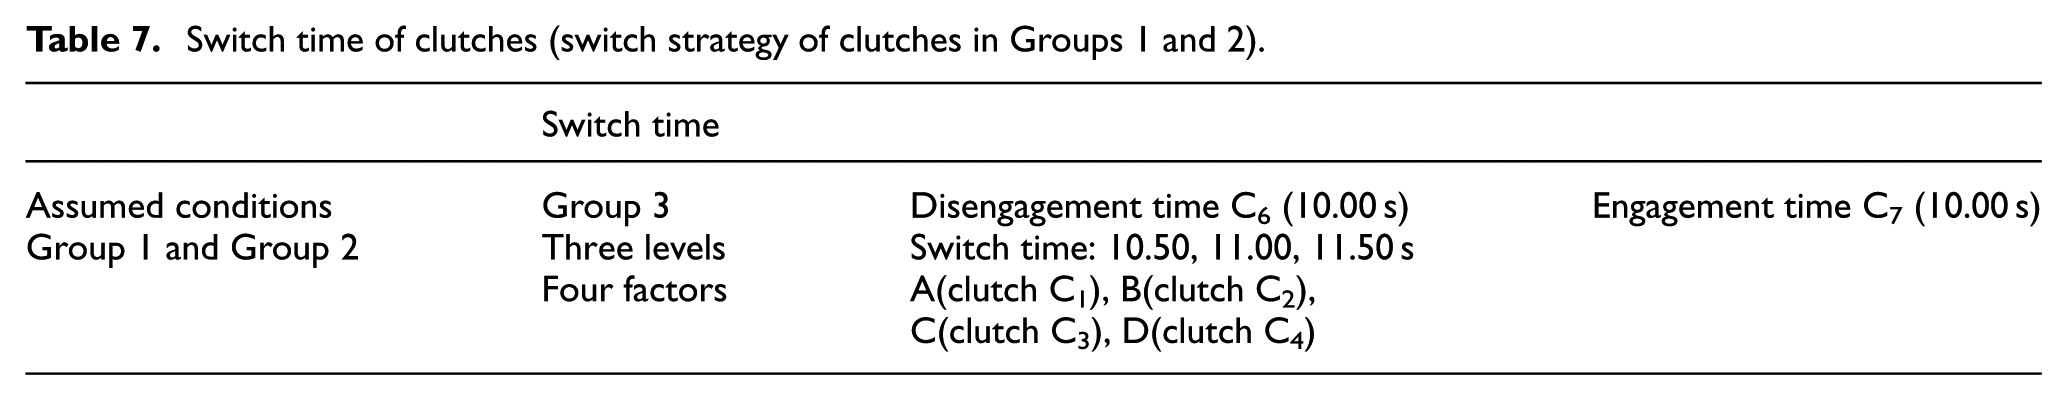
The range analysis can be used to analyze the switch strategy of clutches in Groups 1 and 2. The switch time of clutches is shown in Table 7.
Switch time of clutches (switch strategy of clutches in Groups 1 and 2).
According to the L9(34) orthogonal tables related to the evaluation indexes of shift quality, the range analysis conclusions for the clutches of planet gear mechanism based on the shift time are shown in Table 8.
Range analysis table of shift quality based on the shift time in Groups 1 and 2.

According to the range analysis data in Table 8, the scheme A3B3C3D2(3) can be substituted by the scheme A3B3C3 for evaluation index I, the range of which is changed from (3.58%, 11.02%) (all schemes) to (3.58%, 4.14%) (scheme A3B3C3); the scheme A1C1B1D1 can be substituted by the scheme A1C1B1 for evaluation index II, the range of which is changed from (1.91, 2.68) (all schemes) to (1.91, 2.17) (scheme A1C1B1); the scheme D3C1B1A1 can be substituted by the scheme D3C1B1 for evaluation index III, the range of which is changed from (11.7, 39.43) (all schemes) to (11.7, 13.64) (scheme D3C1B1); the scheme A1C1B2D3 can be substituted by the scheme A1C1B2 for evaluation index IV, the range of which is changed from (−3.99, 53.55) (all schemes) to (−3.99, 2.56) (scheme A1C1B2). The proportion of factor based on the shift time in Groups 1 and 2 is shown in Table 9.
Proportion of factor based on the shift time in Groups 1 and 2.

The simulation results show that the shift strategy based on the shift time is to switch the third group of clutches first, then disengage the first group of clutches, engage the second group of clutches at last.
Test verification
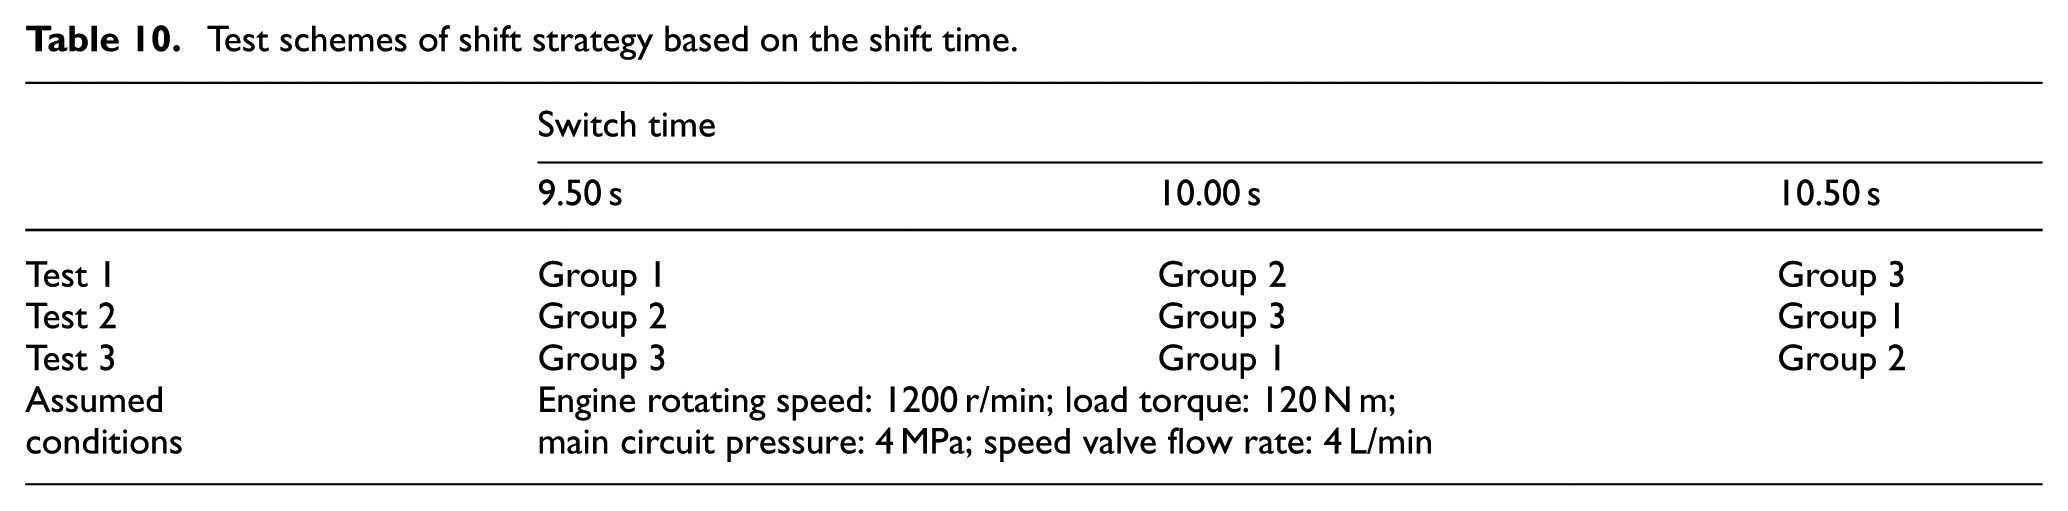
Single-factor loading tests can be used to analyze the shift strategy based on the shift time, the results which are shown in Table 10. The test results of shift strategy based on the shift time are shown in Figure 8.
Test schemes of shift strategy based on the shift time.
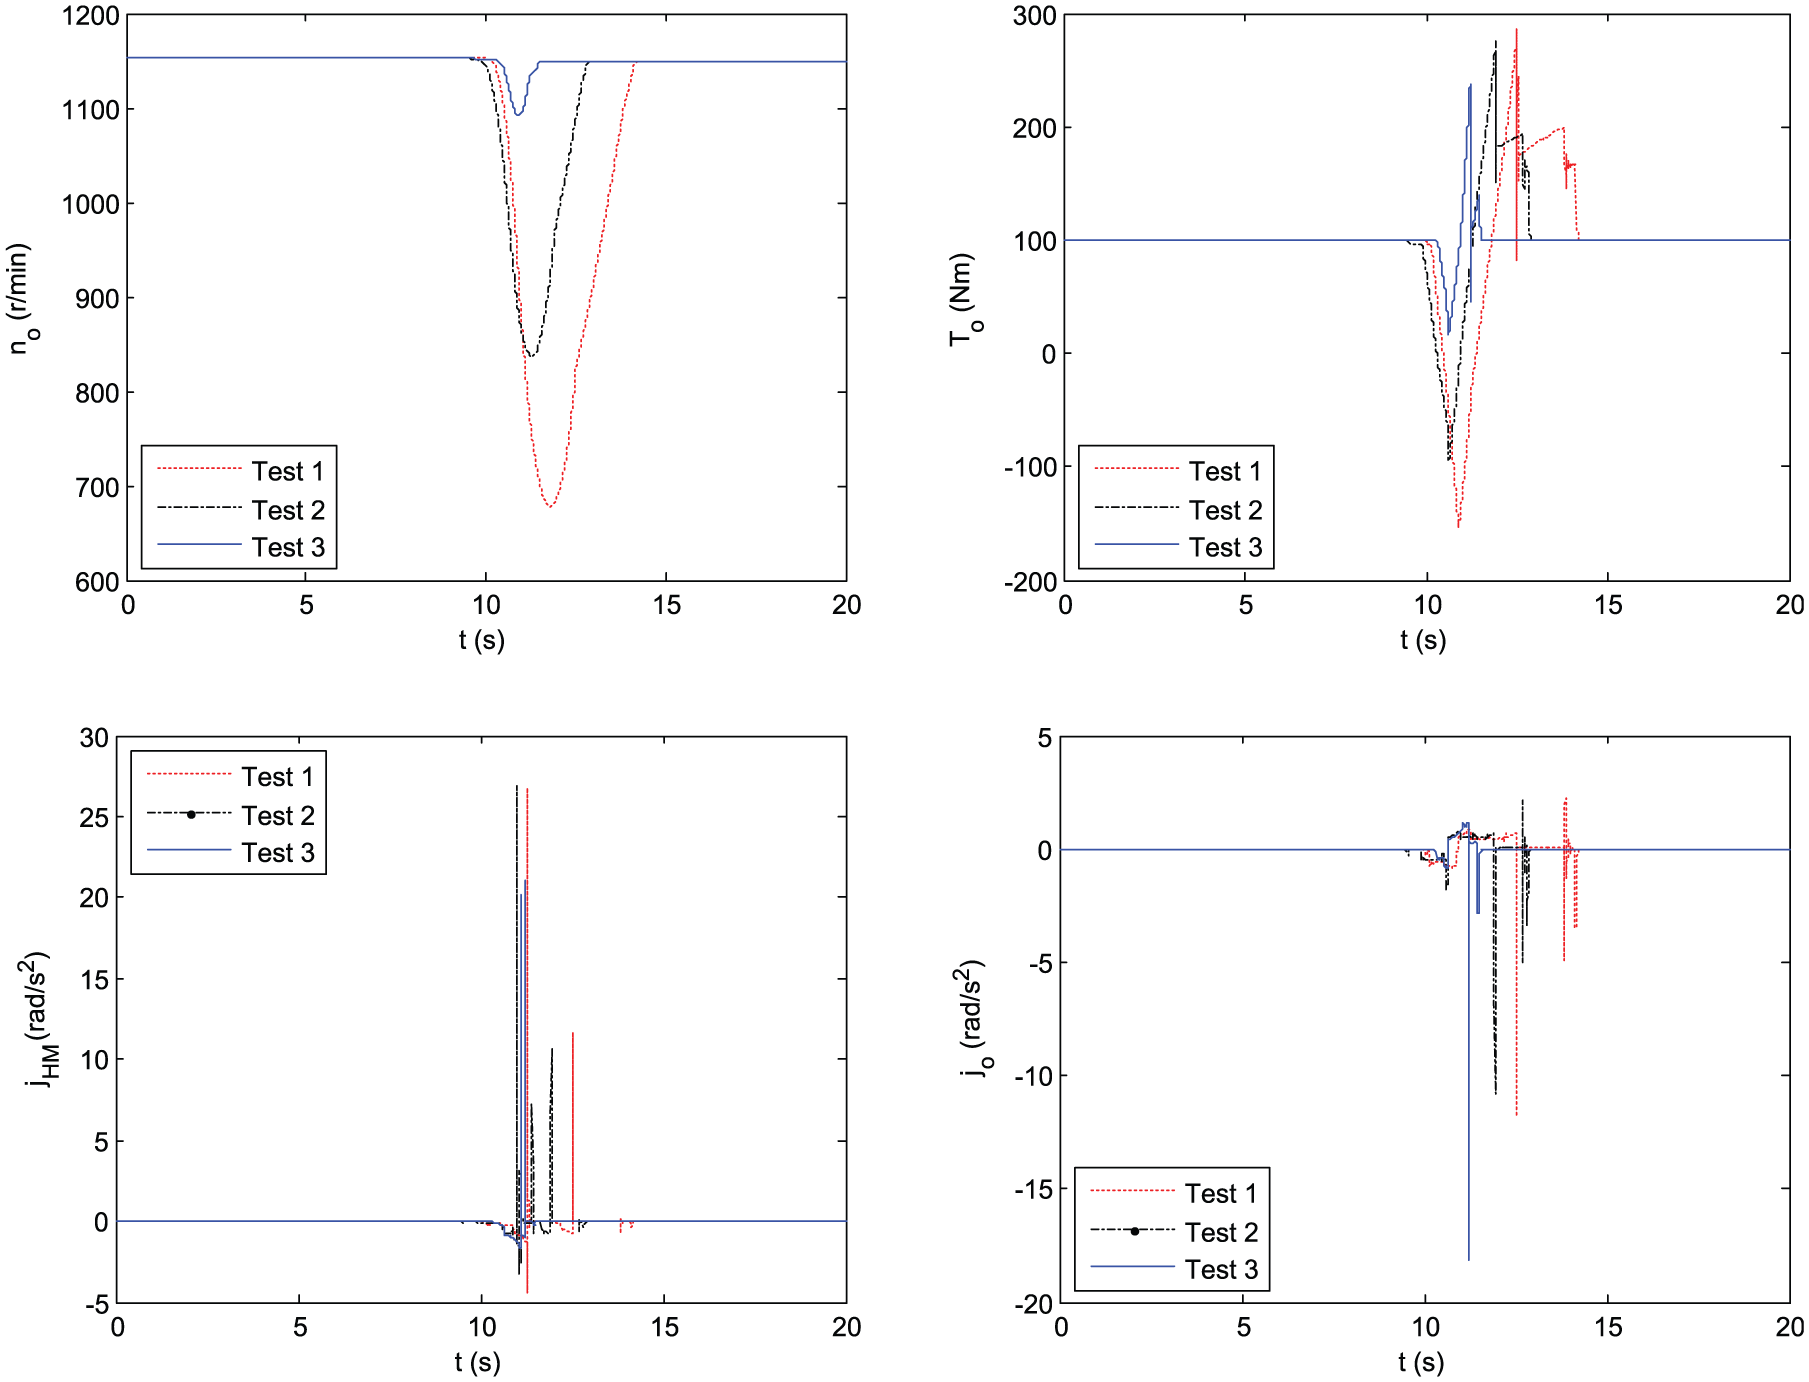
Test comparison diagrams based on the shift time.
According to the test comparison diagrams in Figure 8, the shift quality in Test 3 is superior to that in Tests 1 and 2. The study on the shift strategy based on shift time is on the premise of the fixed physical parameters, and vice versa. We often set switch time of clutches according to the physical parameters in the practical application, and the engagement conditions of clutches are controlled by the pulse-width modulation (PWM) modulator. The controllers locate the time frame from the structural body databases and then control the switch time of clutches according to the databases.
Conclusion
The shift process from F2(N) to F3(P) plays a decisive role in improving shift quality during whole shift process. Shift quality can be improved greatly by optimizing the physical parameters and the shift time of HMIVT involving multi-group clutches.
In the shift process from F2(N) to F3(P), the shift strategy based on the physical parameters is lower engine rotating speed, smaller load torque, lower main circuit pressure, and larger speed valve flow rate.
In the shift process from F2(N) to F3(P), the shift strategy based on the shift time is to switch the third group of clutches first, then disengage the first group of clutches, engage the second group of clutches at last.
Footnotes
Academic Editor: Mario L Ferrari
Declaration of conflicting interests
The author(s) declared no potential conflicts of interest with respect to the research, authorship, and/or publication of this article.
Funding
The author(s) disclosed receipt of the following financial support for the research, authorship, and/or publication of this article: This article was financially supported by National Natural Science Foundation Project (51575001) and Scientific Research Innovation Project of Jiangsu University (KYXX-0008).