
Abstract
In this study, we conducted a simulation investigation of a hypothetical core barrel assembly drop accident based on the dynamic mesh model. The investigation included three separate circumstances: high-temperature dynamic water, high-temperature still water, and low-temperature still water. Results showed that dynamic parameters (e.g. velocity and resultant force) of the drop assembly in high-temperature dynamic water are smaller than those in still water due to the buffer effect of the flowing water. The velocity and hydraulic force in the dynamic water situation increased quickly at first and then remained stable throughout the remainder of the experiment; due to turbulence effect, the hydraulic force fluctuated slightly, first increased, then decreased, and then reached as stable a level in still water as that in dynamic water. The velocity of the drop assembly showed parabolic growth.
Keywords
Introduction
Safety is of the absolute utmost priority during the design and commercial operation of a nuclear power plant. The reactor, which lies at the heart of the plant, is readily affected by flow-induced vibration that can cause the component to fail due to phenomena such as nut loosening or core barrel fracture. Weld cracking in the core barrel, for example, can cause the core barrel assembly (including the core, thermal shield, flow distribution device, core barrel, and other parts) to drop—the falling assembly then hits the secondary support assembly, threatening the integrity of the entire reactor.
Flow-induced vibration has garnered considerable attention from researchers and developers in terms of ensuring nuclear safety. Paidoussis, 1 for example, reviewed the flow-induced vibration in reactors and reactor components and established four categories into which flow-induced vibration phenomena can be divided: cross flow, internal axial flow, external axial flow, and leakage flow. Pettigrew 2 studied the vibration of the fuel assembly under internal axial flow and found that it tends to vibrate near its natural frequency and that vibration amplitude increases proportional to the flow velocity to the second or third power. Hassan and Hayder, 3 Sigrist and Broc, 4 Kuehlert et al., 5 Longatte et al., 6 and others have performed extensive research on the flow-induced vibration of steam generators by means of both simulation and experimentation; Bakosi et al., 7 Mohany and Hassan, 8 and Bhattacharya and Yu 9 mainly examined the fuel rod under flow-induced vibration. Recently, Rahman et al. 10 analyzed hydraulic force (lift-off and hold-down force) of three types of high-performance annular fuels and found that the hydraulic force acting on the fuels was affected greatly by the configuration of fuels. All of these studies were focused mainly on the direct influence of flow-induced vibration on internal structures; while relatively little attention has been given to indirect effects such as the impact of internal structures on the pressurized water reactor (PWR). The dynamic mesh model can be applied to determine the dynamic properties of the internal structures, as evidenced by several previous studies—many prior researchers have utilized this technique to simulate the dynamic properties of various types of fluid machineries such as valves,11–17 pumps,18,19 and more. These previous works suggest that the dynamic mesh model is well suited to analysis of a hypothetical drop accident in a PWR.
This study was focused on secondary (i.e. indirect) effects on internal structures, where we assumed a hypothetical core barrel assembly drop event to examine the dynamic hydraulic forces at work during the drop process. We investigated dynamic parameters under three separate circumstances, which are discussed in detail below. Drop data such as velocity, hydraulic force, and resultant force were obtained based on the dynamic mesh model to allow us to design appropriate support keys.
Numerical model
Geometric model
A typical PWR consists of several major components, including the cold legs, downcomer, lower plenum, flow distribution device, bottom support plate, core barrel, fuel bundles, top support plate, support columns, guide tubes, and hot legs, which form the flow path for the coolant; these components are depicted in Figure 1(a).

Typical structure of pressurized water reactor: (a) 3D structural model and (b) sketch map.
There are about 100 holes scattered throughout the flow distribution device, which guide the coolant to the bottom support plate, which consists of another approximately 700 long and thin holes in staggered distribution. Due to the weak influence of leakage on hydraulic force, the leakage path between the thermal shield and core barrel is negligible, and these two components can be considered as a whole. In order to measure the hydraulic force of fuel bundles (while reducing computational resources), we simplified the core region in two ways. First, we separated a porous domain from the core inlet and outlet regions to ensure that coolant flowed uniformly and then applied porosity and isotropic loss models to the domain; porosity was determined by considering the real geometry of the reactor’s internal structures (here, constant porosity was considered 0.6). Loss coefficients were adjusted to match the magnitude of the pressure drop found in the porous domain with those measured. Second, we added a simulated core with the same volume as the real fuel bundles to determine the hydraulic force of the bundles. These two processes allowed us to guarantee both complete pressure drop of the core and flow uniformity.
In order to secure a high degree of accuracy, we modeled nearly all the internal structures precisely except for the core region, support columns, and guide tubes; support columns and guide tubes were modeled according to their configuration with the internal flow path and internal parts being neglected.
The fracture location of the core barrel and the forces acting on the drop assembly are depicted in Figure 1(b). During our hypothetical drop accident, the drop assembly (which comprises the flow distribution device, core barrel, and fuel bundles) drop under the comprehensive action of gravity, spring force, and hydraulic force. Among these forces, gravity remains constant whereas the hydraulic force and spring force change with the location of the drop assembly. The basic parameters we used for the drop analysis are summarized in Table 1.
Basic drop analysis parameters.

Mesh sensitivity
Inlet ducts were additionally introduced into the model to facilitate smooth flow development in the entrance region. The inlet duct length was determined based on the typical hydrodynamic entrance length for turbulent flow, so the flow at the core inlet region was expected to be less affected by the assumed turbulence intensity at the inlet and non-uniformity at the outlet. We used the ICEM CFD 12.1 toolkit to generate the mesh. In order to balance the contradiction between numerical accuracy and the cost of calculation, a mesh sensitivity test was performed in high-temperature still water (HTSW; Table 2); the difference between maximum and minimum relative error was small, at 5.3% and 3.0%, respectively. To reduce computational resources and acquire a more detailed flow field, we selected the M4 mesh scheme for all subsequent tests.
Mesh sensitivity analysis results.

Turbulence model and boundary conditions
Commercial computational fluid dynamics (CFD) codes usually solve Reynolds-averaged Navier–Stokes (RANS) equations for a turbulence simulation and provide various turbulence models ranging from the 0-equation model to the large eddy simulation model. In this study, we used the shear stress transport (SST)


Equations (1) and (2) are RANS equations. The Reynolds stress terms

In the SST


where
By referring to the operation conditions, we imposed a velocity-inlet condition at each cold leg. Turbulent intensity at the inlet was assumed to be 10%. Outflow condition was imposed at each hot leg, assuming fully developed turbulence at the outlet, and the walls were set to non-slip wall boundary conditions. To secure accurate wall shear stress while maintaining numerical stability, we adopted the wall function approach to bridge the viscosity-affected region between the wall and the fully turbulent region. Because we had selected the SST
Because the main purpose of this study was to obtain drop assembly dynamics, it was crucial to determine the correct forces at the beginning of the drop process. In the HTSW and low-temperature still water (LTSW) situations, the inlet velocity was set to approximately 1e−5 m/s and the gravitational force of the coolant included hydrostatic force. In the high-temperature dynamic water (HTDW) situation, normal inlet velocity was applied and the coolant had the same gravitational force. This allowed us to set appropriate initial conditions for the drop process.
Dynamic mesh model
The dynamic mesh model allows accurate determination of dynamic hydraulic forces according to the changing fluid domain of the nuclear power reactor when the core barrel assembly drops. We utilized two compiled user-defined functions (UDFs) for this purpose. The first UDF was used to compute dynamic drop assembly parameters (e.g. hydraulic force, spring force, velocity, and acceleration) and was defined by dynamic mesh macro DEFINE_CG_MOTION. The dynamic hydraulic force comprised two forces: viscosity and pressure. The COMPUTE_FORCE_AND_MOMENT macro was used to extract both the viscosity force and pressure force acting on the walls of the drop assembly. The first UDF was also paralleled via RP_HOST and RP_NODE macros to make full use of the available computational resources. The second UDF was written to output dynamic parameters at the end of each time step and was defined by the DEFINE_EXCUTE_AT_END macro hooked to Fluent code.
To accurately represent the motion of the drop assembly, the volume mesh must be updated in cases of numerical divergence; we applied a combination of smoothing and remeshing methods to accomplish this. The convergence tolerance of the smoothing method was 10−3 and the spring constant factor was set to 0.7. We used the local cell remeshing method, specifically, with the remeshing interval size set to 1 mm. The core barrel walls, flow distribution device, and bottom support plate were modeled as moving walls. As for the simulated core, the drop wall was wrapped in a fluid domain and dropped as a whole. The reference location of the drop assembly was set to 0 mm, and the time step to 0.2 ms.
Results and analysis
Dynamic parameters of drop assembly in HTDW situation
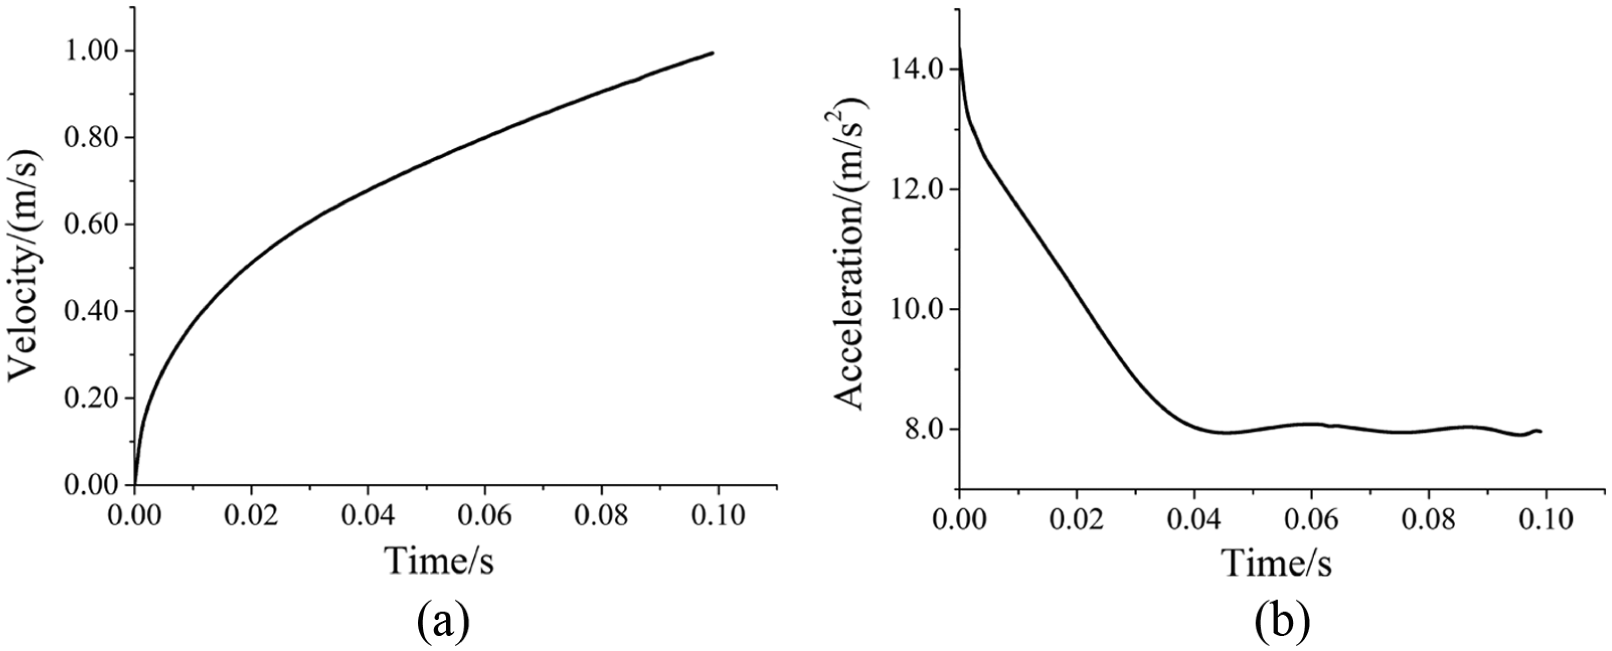
Figure 2(a) shows the displacement of the drop assembly, which increased linearly with time under the hypothetical drop accident until reaching 53 mm. Figure 2(b) shows the dynamic hydraulic force of the drop assembly. At the moment of fracture, the initial hydraulic force was 1990 KN which then reached its maximum value (2750 KN) in a very short period. This may have been caused by the drop assembly’s squeezing effect on the coolant. The hydraulic force then decreased and fluctuated continually for the rest of the simulation, likely because as increased drop assembly displacement strengthened the turbulence effect, causing the hydraulic force acting on the drop assembly to fluctuate. Figure 3(a) shows the spring force of the drop assembly, which was 1440 KN initially and ultimately dropped to 0 KN due to Hook’s law, which caused it to be proportional to the displacement. Figure 3(b) shows the resultant force of the drop assembly, which decreased as displacement increased. When the assembly dropped to about 20 mm, the resultant force reached its minimum value (0 KN). Figure 4(a) shows the velocity of the drop assembly, which began at 0 m/s and reached its highest value (0.32 m/s) at about 20 mm before falling to and remaining near a constant value of 0.29 m/s. This velocity profile was most likely shaped by the relatively small amount of gravity at this stage. The acceleration profile of the drop assembly is illustrated in Figure 4(b).
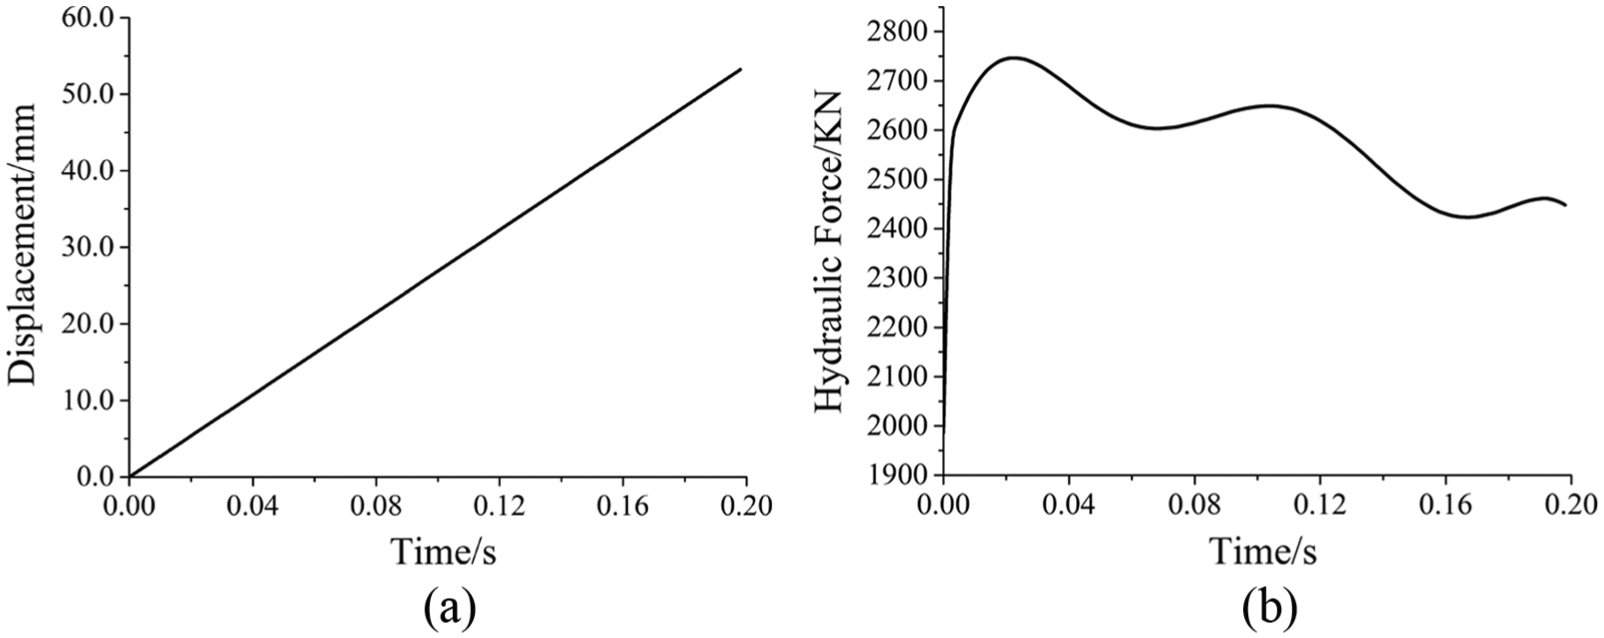
(a) Displacement and (b) hydraulic force in HTDW situation.
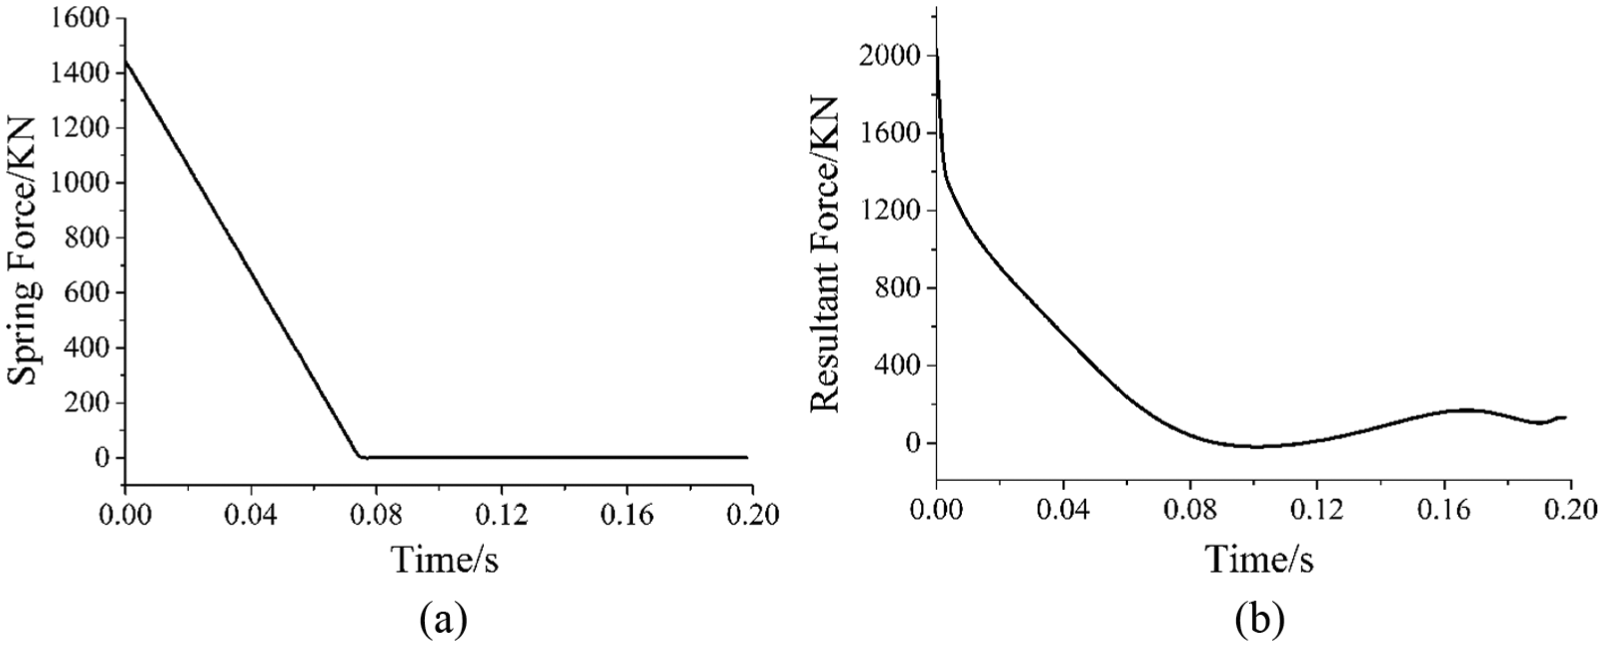
(a) Spring force and (b) resultant force in HTDW situation.

(a) Velocity and (b) acceleration in HTDW situation.
Dynamic parameters of drop assembly in HTSW situation
Figure 5(a) shows the displacement of the drop assembly, which also increased linearly with time during the hypothetical drop accident. Because the coolant was immobile, the pressure acting on the drop assembly only included hydrostatic pressure (and not hydrodynamic pressure), making the resultant force in still water larger than that in dynamic water; thus, the slope of the displacement profile in still water was much larger than that in dynamic water. The final displacement was, again, 53 mm. Figure 5(b) shows the dynamic hydraulic force of the drop assembly. Compared to Figure 2(b), a similar variation tendency was observed apart from the fact that the hydraulic force in still water was much smaller and smoother. This occurred because the flow velocity of the coolant in still water is much smaller than that in dynamic water (approximately 1:10 in the lower plenum), so the turbulence effect was much weaker and the hydraulic force more stable. Figure 6(a) shows the spring force of the drop assembly, the variation tendency of which was mostly the same as that in dynamic water, but dropped to 0 KN more quickly. Figure 6(b) shows the resultant force of the drop assembly, which decreased as displacement increased until reaching a minimum of approximately 2100 KN, which was quite different from the minimum value in dynamic water. Figure 7(a) shows the velocity of the drop assembly, which, owing to the large resultant force mentioned above, showed parabolic growth throughout the simulation.

(a) Displacement and (b) hydraulic force in HTSW situation.

(a) Spring force and (b) resultant force in HTSW situation.
(a) Velocity and (b) acceleration in HTSW situation.
Dynamic parameters of drop assembly in LTSW situation
Figure 8(a) shows the displacement of the drop assembly, which again increased linearly with time during the hypothetical drop accident. Because the coolant was at room temperature, its density was larger than that in still water at high temperature, thus the initial hydrostatic pressure was a little larger and drop velocity smaller. Figure 8(b) shows the dynamic hydraulic force of the drop assembly; when compared to Figure 5(b), there was a similar variation tendency observed except that the hydraulic force was slightly larger at the lower temperature. The maximum hydrostatic force was approximately 720 KN in still water at low temperature but about 550 KN in still water at high temperature. Figure 9(a) shows the spring force of the drop assembly, which showed similar variation temperature in still water at either simulated temperature, but reduced to 0 KN more slowly at low temperature. Figure 9(b) shows the resultant force of the drop assembly, which decreased as displacement increased until reaching minimum value of approximately 2000 KN—nearly the same as that in still water at high temperature. Figure 10(a) shows the velocity of the drop assembly, which, again, showed parabolic growth throughout the simulation due to the large resultant force.

(a) Displacement and (b) hydraulic force in LTSW situation.

(a) Spring force and (b) resultant force in LTSW situation.

(a) Velocity and (b) acceleration in LTSW situation.
Flow field analysis
Figure 11 shows the pressure and vortex contour at two different drop displacements: one at the beginning of the simulation and the other at the end. Generally speaking, the pressure decreased along the flow direction. There was a local high-pressure region at the bottom of the lower plenum and a local low-pressure region at the flow path of the simulated core, which formed as the assembly dropped, the relative velocity between the drop assembly and fluid grew larger, resulting in a stronger vortex region in the flow path of the simulated core. Figure 12 shows the velocity contour, conversely, at the two different drop displacements. Although the drop displacements were different, the velocity distribution was similar at either location, though uneven in the lower plenum and with a high-velocity region around the simulated core.

Pressure and vortex contour HTDW situation: (a and c) 8.0e−4 s and (b and d) 5.28e−2 s.

Velocity contour in HTDW situation: (a) 8.0e−4 s and (b) 5.28e−2 s.
To explore the velocity distribution in further detail, we examined the velocity vector illustrated in Figures 13 and 14. We found that the velocity of the bottom support plate increased along the radial direction, indicating that most of the coolant entered the fuel bundles peripherally. When the assembly dropped, this tendency was especially pronounced.
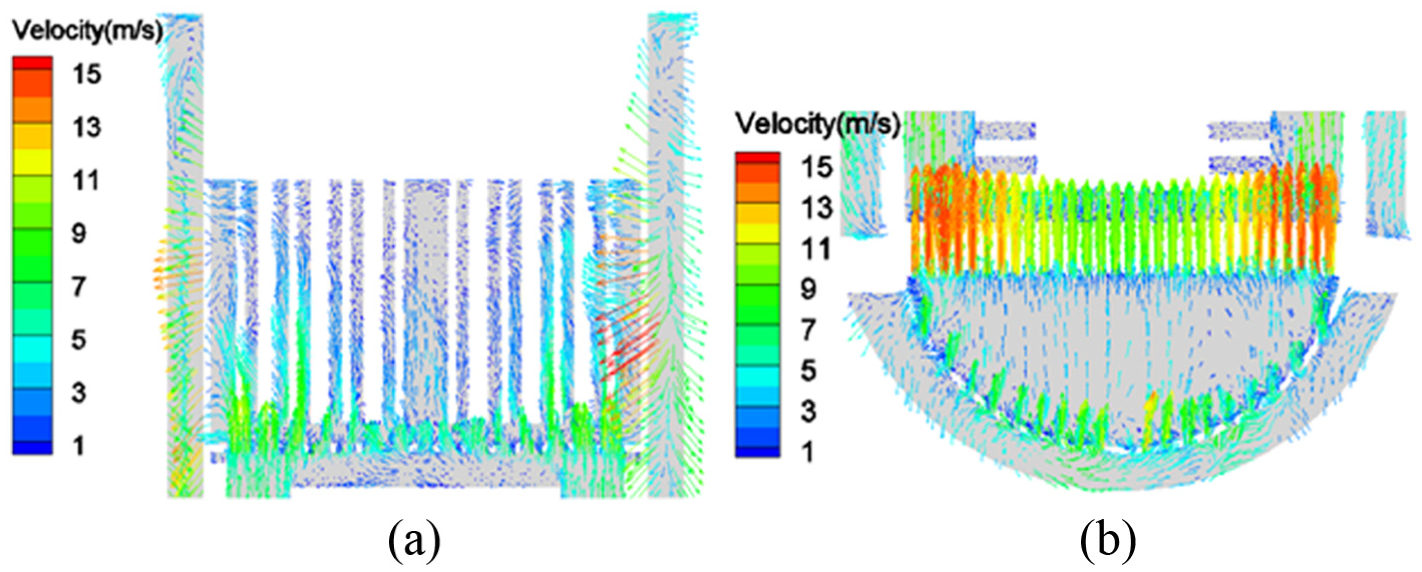
Velocity vector in HTDW situation: 8.0e−4 s.

Velocity vector in HTDW situation: −5.28e−2 s.
Figure 15 shows the pressure contour at two different drop displacements in still water at high temperature. Owing to the still water, the pressure distribution obeyed hydrostatic pressure distribution, where the pressure increased from the bottom of the reactor to the top.
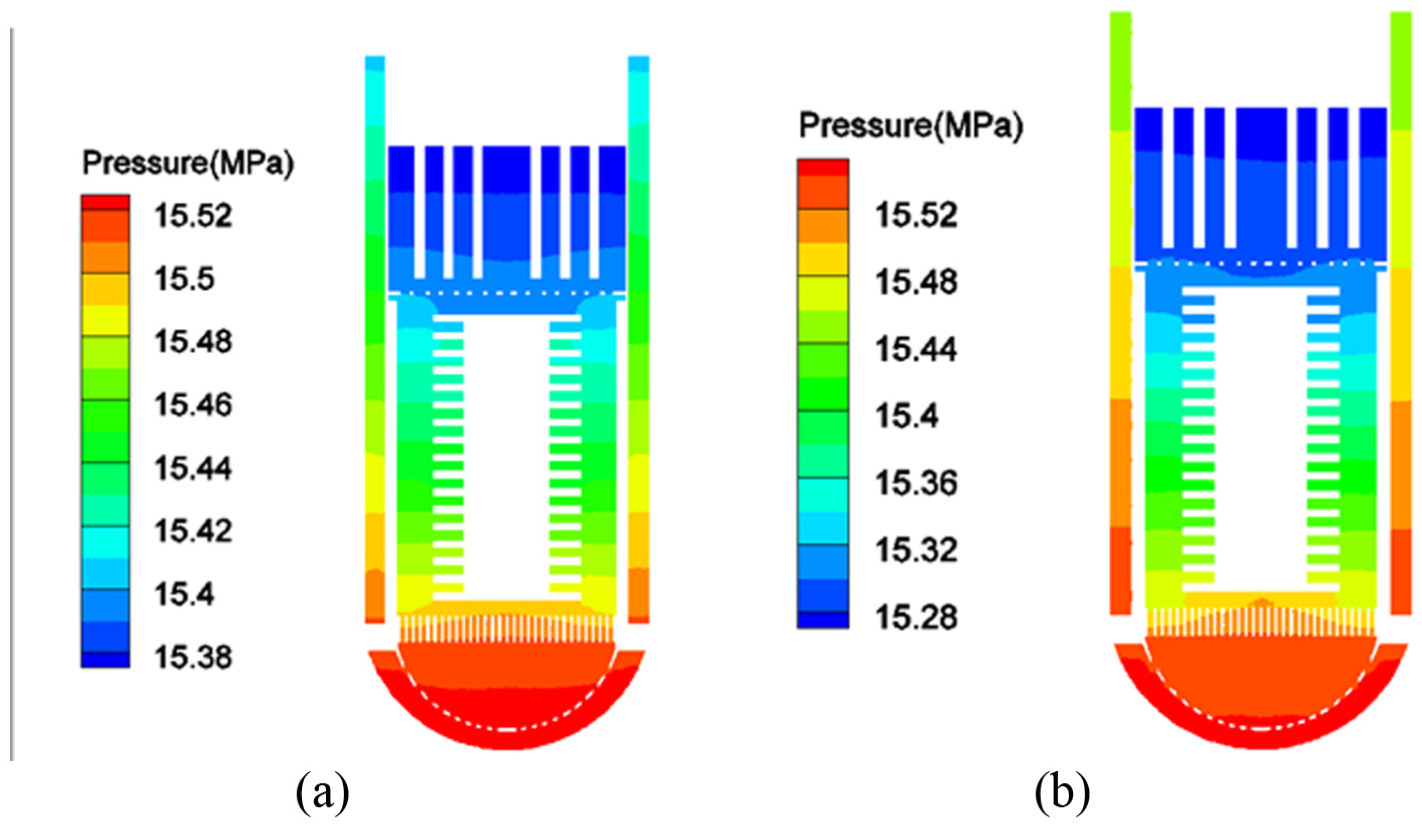
Pressure contour in HTSW situation: (a) 8.0e−4 s and (b) 9.68e−2 s.
Conclusion
In this study, we conducted simulations to determine the dynamic parameters of a drop assembly based on the dynamic mesh model. Results showed that the velocity and resultant force of the drop assembly in dynamic water were far lower than those in still water, thus the impact on the support keys was smaller in dynamic water, suggesting that the reactor would have a higher safety margin. We also found that the velocity and resultant forces of the drop assembly in HTSW were slightly above those in LTSW.
Altogether, we found that the variation laws of dynamic parameters during a typical drop process can be successfully investigated via the dynamic mesh model. We hope that the findings presented here will prove very useful in terms of nuclear safety in the future.
Footnotes
Academic Editor: Hua Meng
Declaration of conflicting interests
The author(s) declared no potential conflicts of interest with respect to the research, authorship, and/or publication of this article.
Funding
The author(s) disclosed receipt of the following financial support for the research, authorship, and/or publication of this article: This study was supported by National Natural Science Foundation of China (No. 51279145).