
Abstract
High structural modal frequencies of car body are beneficial as they ensure better vibration control and enhance ride quality of railway vehicles. Modal sensitivity optimization and elastic suspension parameters used in the design of equipment beneath the chassis of the car body are proposed in order to improve the modal frequencies of car bodies under service conditions. Modal sensitivity optimization is based on sensitivity analysis theory which considers the thickness of the body frame at various positions as variables in order to achieve optimization. Equipment suspension design analyzes the influence of suspension parameters on the modal frequencies of the car body through the use of an equipment-car body coupled model. Results indicate that both methods can effectively improve the modal parameters of the car body. Modal sensitivity optimization increases vertical bending frequency from 9.70 to 10.60 Hz, while optimization of elastic suspension parameters increases the vertical bending frequency to 10.51 Hz. The suspension design can be used without alteration to the structure of the car body while ensuring better ride quality.
Keywords
Introduction
Lightweight design of railway vehicles has been commonly applied as means to conserve energy. However, using light materials and altering mechanical structures, lightweight design can often result in deterioration of rigidity of the car body. This reduction in the rigidity of car body is one of the primary causes of low modal frequencies. Li et al. 1 established two finite element (FE) models to compare the effects of lightweight design on the modal frequencies of the car bodies of railway vehicles. Results indicate that most modal frequencies decreased to varying degrees as a result of lightweight design principles. Lower structural modal frequencies induce strong, flexible vibrations and contribute to worse ride comfort of passengers. 2 Tomioka et al. 3 analyzed three-dimensional (3D) flexural vibrations of lightweight railway vehicle car bodies. The result shows that the vibration of lightweight car bodies with low modal frequencies occurred in a high-sensitivity range for human, leading to poor ride comfort for railway passengers. Therefore, qualitative regulations regarding the eigenfrequencies of railway vehicle car bodies have been reported in UIC 566 4 and EN 12663, 5 and many countries have specific frequency requirements. For example, the first vertical bending frequency of a car body under service conditions should not be lower than 10 Hz 6 according to the technical standards of ICE in Germany.
Many papers have emphasized on the influence of low modal frequencies and car body flexibility on the subsequent vibration of railway vehicles. For example, the influence of car body flexibility on the vehicle ride quality was investigated by Zhou et al., 7 including the first two modes of a Euler–Bernoulli beam model. Results indicate that high bending frequency can alleviate the resonance of the car body. And some previous research aims to reduce the flexible vibration of car body with different control methods, such as Kamada et al. 8 used piezoelectric actuators to suppress bending vibration of high-speed railway vehicle and Schandl et al. 9 improved passengers comfort through designing an active vibration reduction system for flexible car body. However, few studies to date have investigated the means by which to improve modal parameters of car body. Wu et al. 10 increased the first two modal frequencies of automobile car bodies according to sensitivity analysis, which attempts to improve dynamic parameters by modifying mechanical structures. 11
The objective of this article is therefore to investigate specific methods by which to increase the modal frequencies of railway vehicle car bodies. This article proposes modal sensitivity optimization of railway vehicle based on sensitivity analysis and a new method of equipment suspension design for underneath the car body. In the latter case, coupling exists between the flexible car body and the equipment. Simulation studies and experiments were conducted, and the effectiveness of the proposed methods was confirmed. Two methods were also compared to determine the most suitable method for use in various situations.
FE model and modal analysis of car body
The studied railway vehicle is a passenger car. The car body has an integral bearing cylindrical structure without a central sill and is composed of an end wall, side wall, chassis, head, and an apron board. A car body in service condition includes a bearing structure, interior materials, and equipment beneath the chassis. The equipment primarily includes an electro-pneumatic brake unit, charger, inverter, and battery system. First, a 3D FE model was established with FE software HYPERMESH according to its 3D geometric model, as shown in Figure 1.

Original car body FE model with suspended equipment.
Four-node shell elements were used here. All types of equipment are considered to be large mass points which connect rigidly to the bottom of the car body at various positions. The mass parameters of the car body and equipment are listed in Table 1. This model has a total of 650,181 elements and 813,117 nodes.
Mass of car body and equipment.

It is assumed that all materials are linear, and that the mass of the car body is equally distributed. The car body comprises low-carbon steel. The material parameters used in the simulation model are listed in Table 2.
Material parameters of car body.

Modal frequencies and shapes of car body are obtained by modal analysis with block Lanczos method, which is conducted under free boundary conditions. The three typical mode shapes of the first vertical bending, the first lateral bending, and the first torsion are shown, respectively, in Figure 2, in which the first vertical bending frequency is only 9.15 Hz, the first lateral bending frequency is 11.05 Hz, and the first torsion frequency is 13.29 Hz.

Modal shapes of railway vehicle car body: (a) first vertical bending, (b) first lateral bending, and (c) first torsion.
Modal test and model correction
Modal test model and equipment
The FE simulation model requires confirmation by experimental data. Therefore, a modal test of the studied car body is implemented to correct the model. Equipment and sensors used in the modal test are listed in Table 3. The data collection system is made up of acceleration sensors-BW14596, data collection front-end-LMS SCR09, and collection software LMS Test.Lab. There are 72 channels and 1 CAN-bus and GPS in the collection front-end. The data transmission rate is 8 M/s. Acceleration sensors all work at three directions with the sensitivity of 50 mv/ms2. The sampling frequency is 256 Hz.
Modal test equipment and sensors.

The following steps are implemented during the test:
The geometric size of the car body is measured, and the positions of data collection points are determined;
Acceleration sensors are fixed at each measurement point in the Y- and Z-directions;
Excitation positions are determined and exciters are installed. The excitation devices connect to the car body via mandrills, force transducers, and impedance heads;
The test model and test parameters are input into the computer running LMS Test.Lab software;
The entire modal test system is debugged;
The force excitation signals and acceleration response signals of each point are recorded in the time domain during the formal test;
Data preprocessing is performed with LMS Test.Lab. Modal analysis and identification are conducted to obtain the structural modal frequencies, shapes, and damping ratios of the studied railway passenger car body.
The measurement points must be selected near the main body frame. A total of nine sections are identified along the length of the car body, as shown in Figure 3. There are eight acceleration measurement points located in each of the nine sections, which are numbered as shown in Figure 4. The directions of each sensor are defined according to the entire vehicle coordinate. The acceleration values in both the vertical and lateral directions are recorded.

Measurement sections of car body.

Acceleration response point distribution along the car body.
There are four modal exciters, all of which are located along the bottom side beam of the car body. Exciters are installed at two points of car body head and at two points of car body rear as shown in Figure 3. The four exciters are close to points A1, A3, I1, and I3, respectively. Figure 5 illustrates one of the modal excitation systems installed at the head of the car body (close to A1).

Modal excitation equipment.
Figure 6 illustrates installation of the acceleration sensor in detail. All signals from the acceleration sensors and from the force transducers of the exciters are transferred to a data collection system in the computer through numerous cables, as shown in Figure 7.

Acceleration sensor installation.
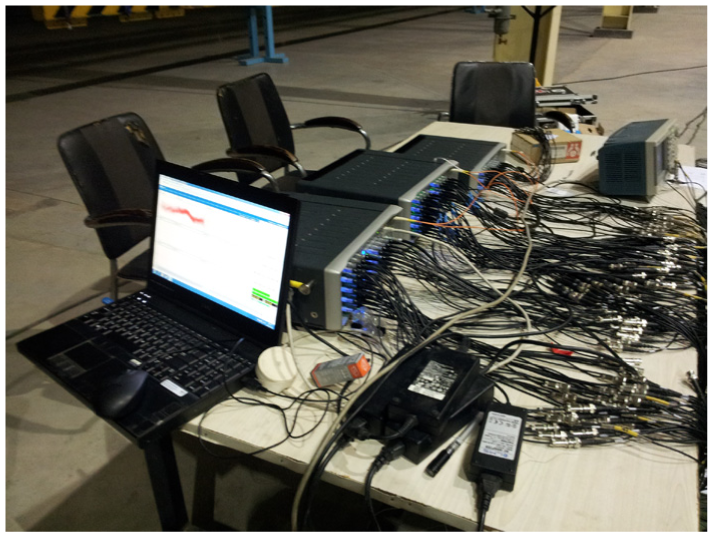
Data collection system.
Test conditions
The car body is supported by four very soft rubber springs with the vertical stiffness of about 320 kN/m in order to realize free boundary conditions; the modal test employed is based on the mechanisms of multi-point excitations and responses. The test is divided into two parts, in order to account for the vertical and lateral directions. A frequency sweeping input method is employed in order to excite the car body. All test excitation conditions are listed in Table 4.
Modal test conditions.

Modal test results
The modal identification method based on polymax method is applied with LMS software in this modal test. This polymax method is capable of obtaining clear stabilization diagrams, even in the presence of large damping and dense modals, so as to achieve a given physical modal order.
The polymax method requires frequency response functions (FRFs) at each measurement point. All FRF amplitudes are then summed in order to centralize the peak information in a single system. The integrated FRFs sum to achieve modal parameter identification of a steady diagram. Poles are then selected based on the modal selection indicator functions (MIFs) and all local minimums at all resonance frequencies. Finally, modal frequencies, modal shapes, and damping ratios of the body are obtained according to modal vector estimation of the selected modal poles. Figure 8 shows the frequency response results of the modal test, which can be used for obtaining the modal frequencies later.

Test results in frequency domain.
Table 5 depicts the obtained modal frequency results. Some difference was observed between simulation and test results, likely because FE modeling ignores certain interior decoration masses in the service condition, which must be uniformly distributed in the car body. According to the test results, the original model can be corrected by increasing the equivalent mass and stiffness.
Modal analysis correction (Hz).

Table 5 indicates good agreement between the new FE model and the modal test, with a maximum error equal to 0.5%. The newly developed model will be used for the following calculations.
As indicated by the above results, the first vertical bending frequency of the car body in service condition is less than 10 Hz, which fails to meet the standard criterion.
Modal sensitivity optimization
Modal sensitivity analysis
When dynamic properties are unable to meet related requirements, dynamic structural modification is employed. In this case, the modal frequencies optimization of a railway vehicle car body based on sensitivity analysis theory is proposed. The local parts, which primarily contribute to structural stiffness, are selected as the design variables in order to increase the rigidity of the structure.
The dynamic equation of the car body structure is established as follows

where K is the global stiffness matrix; M is the global mass matrix; and ωi and ui are the i order modal frequency and modal shape vector of the structure, respectively.
The derivative of equation (1) is calculated as follows

where
The variable


Then,
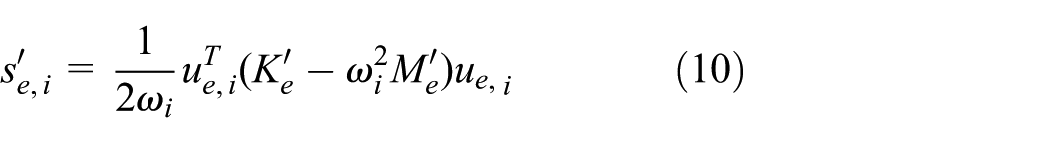
In the simulation model, K and M are determined by the stiffness matrix Ke and mass matrix Me of each element, respectively. The variable e represents the elemental number


The derivative of equations (6) and (7) sub-variable b is calculated as follows


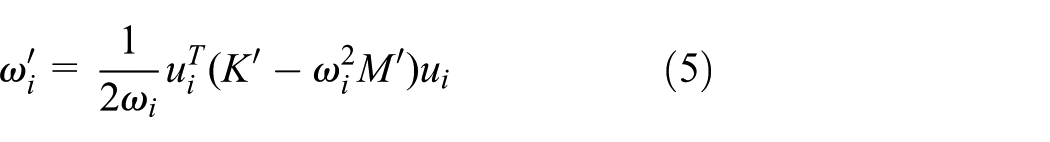
Then, equation (5) can be written as follows
where
The values of car body mass and stiffness depend on the material properties and its specific structural makeup. Based on the above modal frequency sensitivity theory, the first vertical bending frequency is set as the objective function
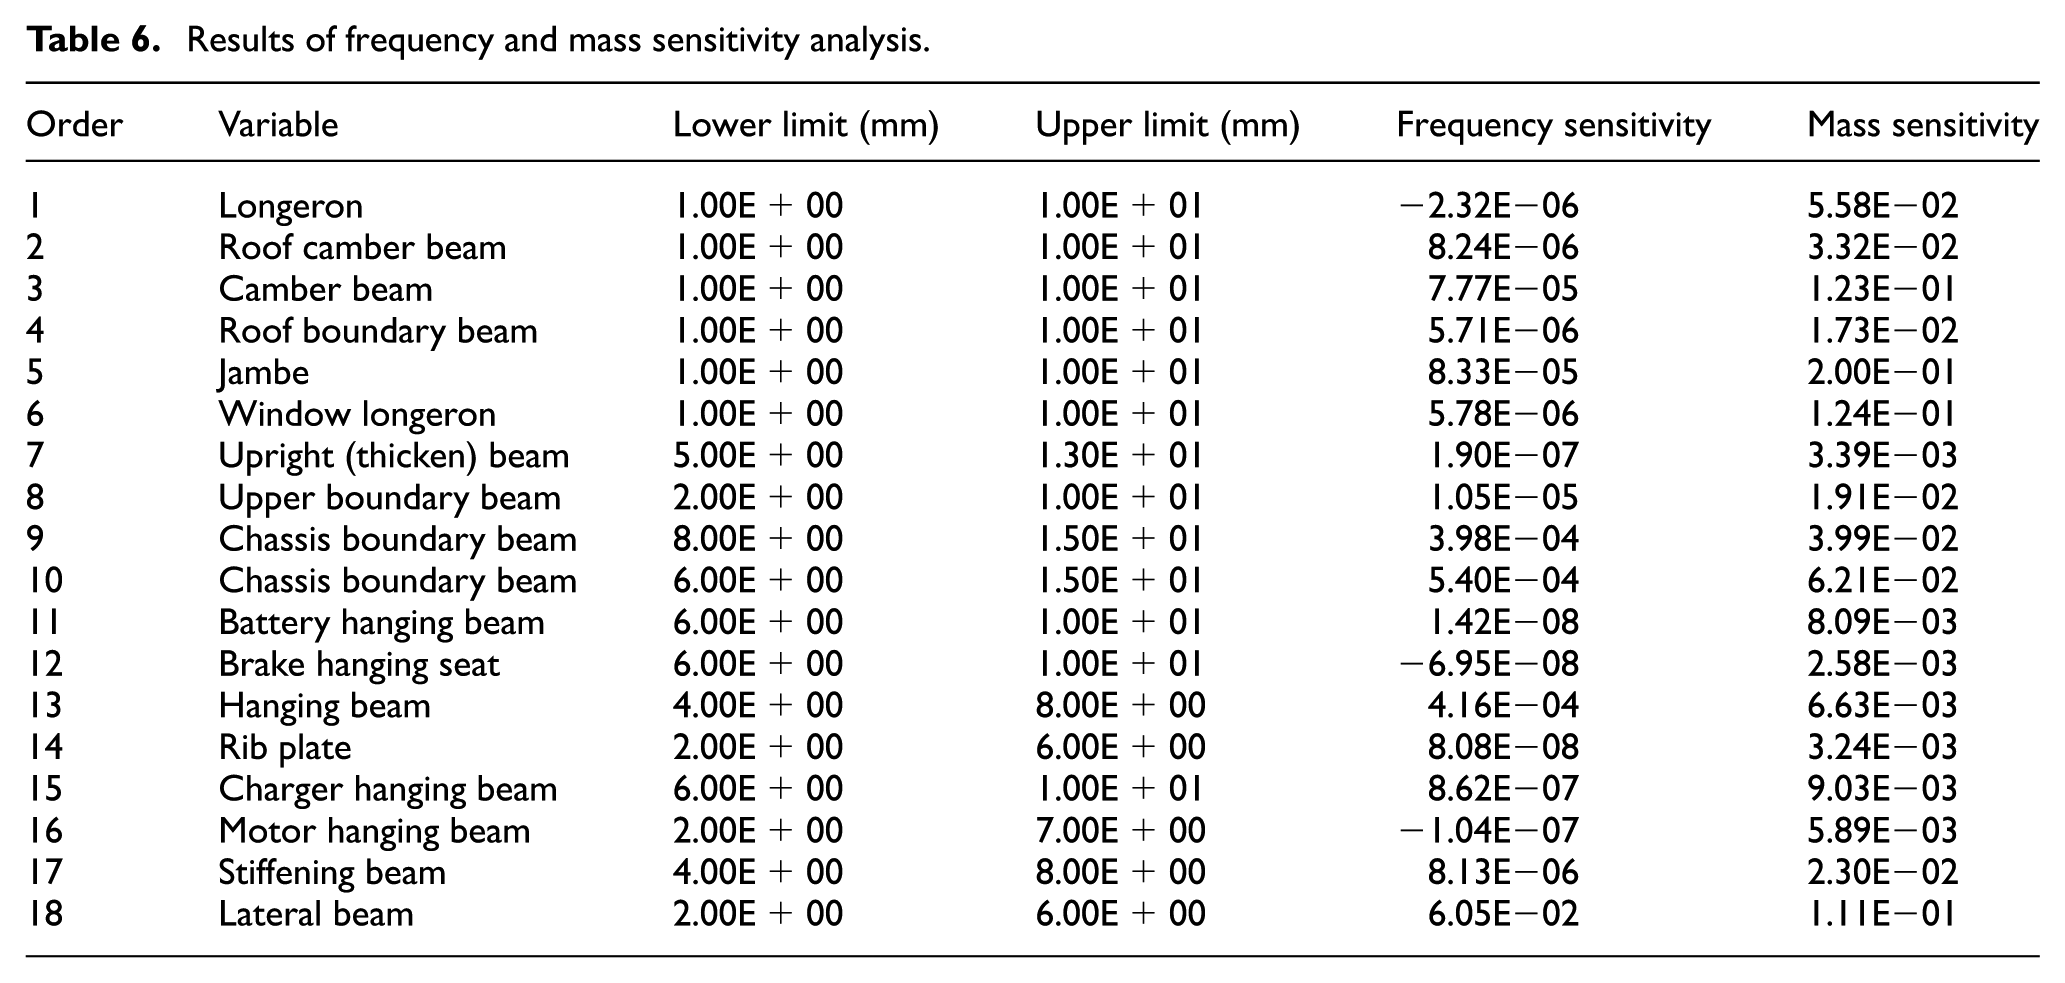
Most stiffness properties of a car body are determined by its bearing structure. First, 18 components of the bearing framework of a car body are chosen to represent optimal variables, as shown in Figure 9. And the specific meaning of variable is shown in Table 6. The sensitivity of each part thickness on the first vertical bending frequency is then calculated. Finally, modal frequency sensitivity analysis is conducted in order to determine which component has the greatest effect on increasing modal frequencies.
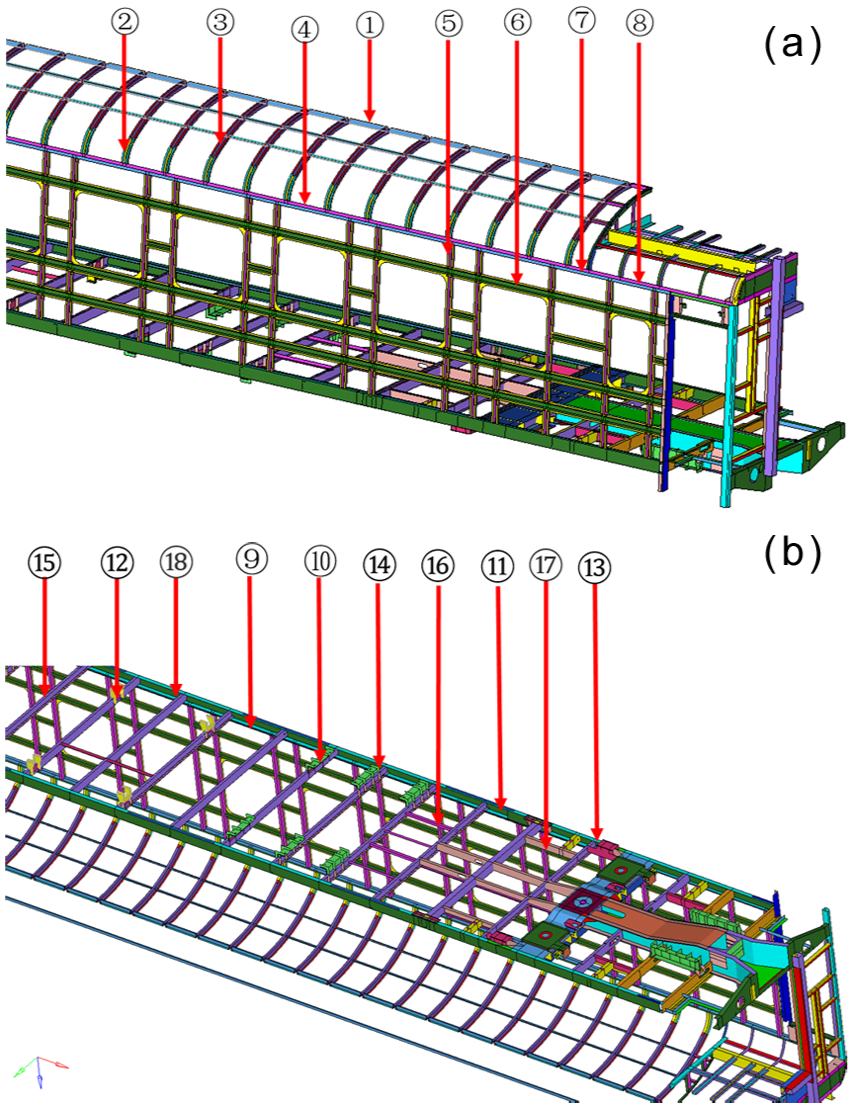
Optimal design variables of modal sensitivity analysis.
Results of frequency and mass sensitivity analysis.
Modal sensitivity optimization
First, both the sensitivity of the first vertical bending frequency and of the car body mass are calculated. Table 6 depicts modal frequency sensitivity and mass sensitivity values as they relate to numerous variables. As shown in Table 6, some components exhibit large sensitivity values as related to frequency, while others primarily influence mass. These values represent different degrees of influence of the changing thickness of different beams on frequency and car body mass.
Figure 10 depicts the modal frequency sensitivity values of all studied components. A positive sensitivity value indicates the addition of thickness to increase frequency and vice versa. If the sensitivity value is close to zero, the effect of that particular component can be ignored. Increasing the beam thickness can effectively increase the bending frequency of the car body; thus, this article focuses on the improvement of modal frequencies. A small number of components that exhibit high-sensitivity values are selected from among the 18 studied components. Component number 18, the lateral beam, demonstrates the greatest sensitivity value, while number 13 (hanging beam) and numbers 9 and 10 (chassis boundary beam) also exhibit a significant positive effect on the first vertical bending frequency.

Sensitivity value of each component in reference to first vertical bending frequency.
In order to guarantee the addition of less weight due to changes in variable thickness during the optimization process, a new Sr index is constructed. The relative modal sensitivity value Sr is defined as follows
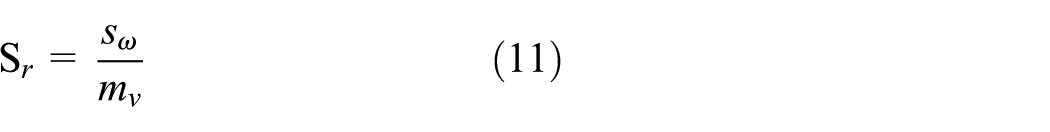
where sω is the modal frequency sensitivity to beam thickness, and mv represents the variable mass. The relative sensitivity value Sr depends on both the modal frequency and the variable mass. According to the relative sensitivity results displayed in Table 7, the four beams represented by numbers 9, 10, 13, and 18 are identified as the optimal design variables.
Relative sensitivity values.

The limit thickness ranges of the four optimal design components are then set as constraint conditions, and modal optimization is conducted. The memory consumption of the computer is 32,000 MB and the computational time is about 20 min for one variable condition. There are four variable conditions, so the computational time is 160 min in total. As shown in Table 8, the first vertical bending frequency increases from 9.70 to 10.60 Hz while the weight of the entire car body increases from 39.44 to 40.37t. The thickness of most design variables reaches their upper limits, which indicates the effectiveness of modal sensitivity optimization with the cost of additional structural mass.
Results of relative modal sensitivity optimization.

The first lateral bending and the first torsion frequencies also increase with different levels, as shown in Table 9. In the initial stages of railway vehicle design, modal sensitivity optimization can be conveniently applied. However, as most vehicle parameters have already been determined and altering the thickness of components in the car body is difficult to realize, this method will be limited in its implementation. Based on this situation, another method that does not require alteration of any internal structures of the car body is proposed.
Modal frequency results (Hz).

The design of equipment suspension parameters
The coupled dynamic model of car body and suspended equipment
Vibration of a railway car body includes rigid body modes, which normally operate in a low-frequency range. The car body also exhibits higher frequency flexible modes consisting of twisting and bending deformations of the entire car body. 13 A simplified equivalent dynamic model with 2 degrees of freedom is established, as shown in Figure 11, to determine the effects of equipment suspension on the modal parameters of the car body.
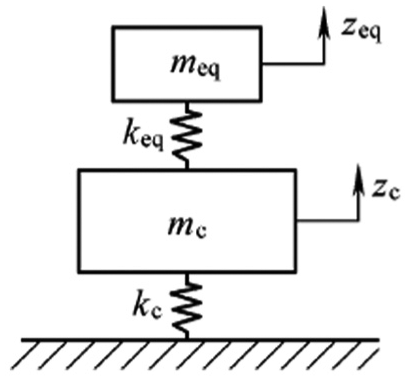
Equivalent dynamic model.
In this model, the flexibility of the car body is represented by the equivalent vertical bending stiffness kc = 134.4 MN/m, mc is the car body mass, zc is the vertical displacement of the car body, meq is the equipment mass, keq is the suspension stiffness, which is a design variable here, and zeq is the vertical displacement of equipment.
The differential motion equations of the system can be expressed as follows

According to the solutions to equation (12), the natural frequencies can be expressed as follows

When elastic suspension replaces the rigid connection between the equipment and the car body, they constitute a model with 2 degrees of freedom. The vibration response of each component occurs as a superposition of the lower frequency vibration mode with ω1 and the higher frequency vibration mode with ω2. The vibration responses of the car body and equipment can be calculated as follows

where A1, A2, B1, and B2 are amplitudes of the two modes.
The binomial theorem is then applied in order to obtain the ratios between the amplitudes of the two natural modes, as follows

where
Suspension static deflection is selected as the design variable. Relationship between static deflection δ and its stiffness keq, as well as its frequency feq, can be expressed as follows


The parameters of the car body are substituted into equations (13) and (16) in order to obtain the natural frequencies of the system, which change in response to static deflection δ, as shown in Figure 12. As the static deflection increases, both the independent equipment feq and both natural frequencies decrease.

The relationship between natural frequencies and static suspension deflection.
When the static deflection is approximately equal to 0 mm, the car body is rigidly connected to the equipment, forming a one-body system with the mass sum of its bearing structure and the suspended equipment. In the original model, the first vertical bending frequency is 9.7 Hz. Then, the static deflection of equipment suspension is increased to a nearly infinite value, resulting in the decoupling of the car body and the equipment. At this time, the mass of the equipment is subtracted from the car body, and the first vertical bending frequency of car body is close to 10.97 Hz. The system can be considered as one with 2 degrees of freedom with elastic equipment suspension. The vertical bending frequency falls between 9.70 and 10.97 Hz, as shown in Figure 12. As long as the suspension deflection is positive, the frequency exceeds the 9.70 Hz demonstrated by the rigid model, indicating improvement achieved by elastic suspension. Elastic spring elements are incorporated into the FE model in order to determine specific suspension parameters in the next section.
Parameter design of elastic suspension
In this model, 3D rubber spring elements are utilized to represent elastic connections employed to hang equipment under the chassis of the car body. For example, the details of rigid and elastic connections between the electro-pneumatic brake unit and the car body are shown in Figure 13. There are four rubber springs under the car body to suspend the bake unit mass.

Equipment suspension in FE model: (a) rigid connection and (b) elastic connection.
The stiffness and damping coefficient of rubber springs can be expressed as follows


where kd is the dynamic rubber stiffness, which changes with temperature, excitation frequency, and material; c is the elastic element damping coefficient; and ε is the damping ratio.
The bounce frequency of a bogie is always approximately 5 Hz 14 and the first vertical bending frequency of a car body is approximately 10 Hz; thus, the independent suspension frequency of equipment feq should avoid these frequencies in order to prevent resonance. Based on resonance avoidance, 6, 7, and 8 Hz are, respectively, selected as feq values to perform modal analysis of a flexible car body in service condition. The results are shown in Table 10. The memory of computer is 32,000MB and the computational time is about 1.5 h for one condition of flexible suspension. There are three conditions, so the total computational time is 4.5 h.
Modal frequencies of car body with different suspension methods (Hz).

As shown in Table 10, all modal frequencies of a car body increase for all studied suspension frequencies, as compared to the original value. Thus, no positive correlation is observed between equipment and the suspension and modal frequencies of the car body. In this case, feq = 7 Hz demonstrated optimal improvement to the car body modal parameter, resulting in a first vertical bending frequency of 10.51 Hz. The elastic suspension parameter design should follow the principle that independent suspended frequency of equipment must not be equal to the natural frequencies of the car body or bogie.
Ride quality of railway vehicle
The random vibration accelerations of vehicles at an operation speed of 160 km/h through on-track field tests are considered to be input signals of modal transient response calculations. Ride qualities are compared after improving the modal parameters according to the two method proposed methods. The sampling frequency is 2048 Hz, and the utilized test equipment is listed in Table 11.
Vibration test equipment.
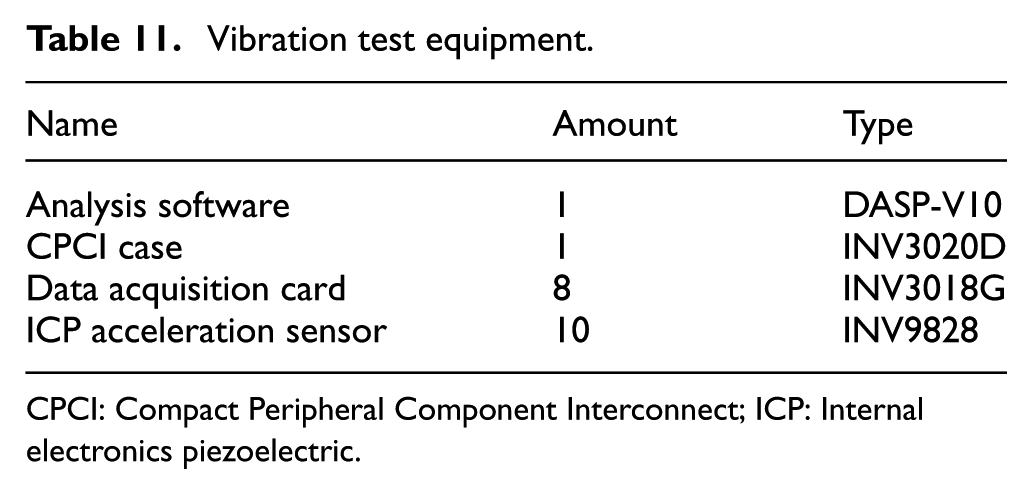
CPCI: Compact Peripheral Component Interconnect; ICP: Internal electronics piezoelectric.
Figure 14 shows the test train and data collection system inside of the car body. Vibration acceleration sensors are located at the air spring cover plate under the bolster beam of the car body.

Vehicle vibration test.
Figure 15 illustrates the vertical and lateral vibration excitation signals transmitted from rail/wheel contact in the ride quality analysis test. Ride quality at the car body center is calculated in both the vertical and lateral directions.

Vibration acceleration input data.
There are a variety of standards and criteria according to which the ride quality of railway vehicles may be evaluated. For the long-term evaluation of ride comfort of railway vehicles, the evaluation procedure based on ISO 2361 15 and that proposed by Sperling 16 are often employed. The Sperling index is an alternative method of analysis based on Wz, a frequency-weighted root mean square (RMS) value of acceleration that is evaluated over defined time intervals or over a defined track section.
Ride quality implies that the vehicle is assessed according to the effect of mechanical vibrations on the occupants. The equations for the

where a is the RMS acceleration (cm/s2), f is the response frequency (Hz), and F(f) is a frequency-dependent factor used to express human sensitivity to vibration. The above equations were constructed based on vibration tests with human subjects and were then supplemented by other test results.
The acceleration measured on the car body does not exhibit a single frequency, but a frequency spectrum in which natural frequencies of the vehicle are particularly pronounced. The Wzi ride factor is determined for each individual frequency. The total ride quality index Wztot is determined by a combination of Wzi values exhibited at different frequencies

Table 12 shows the classification of ride quality for railway vehicles used in China. If the Sperling index Wztot is greater than 3, the vehicle is not accepted as demonstrating adequate ride quality.
Classification for ride quality.

Figure 16 shows the Sperling index obtained from different models. According to Table 12, all obtained values meet the standardized requirements for “good” ride quality, except for the vertical component of the sensitivity optimization model. As shown in Figure 16, the elastic suspension design of equipment improves ride quality in both the lateral and vertical directions. However, the vertical ride quality deteriorates after modal sensitivity optimization, due to the additional car body mass.

Railway vehicle ride quality index.
The Sperling index is at its minimum when the suspension frequency of equipment is equal to 7 Hz. At this moment, the vertical bending frequency is 10.51 Hz, which is bigger than that of other suspension conditions. Therefore, as long as the equipment suspension parameter is set reasonably, it can improve car body modal frequencies and the ride quality of railway vehicles simultaneously. Additionally, this method does not require alteration of any car body internal structures, making it more applicable to practical situations.
Conclusion
Modal sensitivity analysis is applied to optimize modal frequencies by modifying the structural thickness of car body frames with high sensitivity. The first vertical bending frequency of a car body in service condition increases by 9.2%, while the body mass increases by 2.35% as the rigidity of the car body is increased. Modal sensitivity optimization can improve the modal frequencies of car body. However, subsequent increase in the vehicle sprung weight may result in deterioration of dynamic performance.
The connection mode between equipment under the chassis and the car body is altered based on the coupled model. When the independent suspension frequency of equipment is equal to 7 Hz, the resonance frequency ranges of both the car body and the bogie may be avoided, and the first vertical bending frequency increases to 10.51 Hz. Modal frequencies can be effectively improved by setting reasonable elastic suspension parameters, which allows the vehicle to meet relevant modal frequency requirements (>10 Hz) while simultaneously optimizing ride quality.
Although both proposed methods are capable of achieving the desired results, the second method does not require structural alteration of the car body and thus increase the vehicle weight, which is beneficial for implementation in existing engineering applications.
Footnotes
Academic Editor: Rahmi Guclu
Declaration of conflicting interests
The author(s) declared no potential conflicts of interest with respect to the research, authorship, and/or publication of this article.
Funding
The author(s) disclosed receipt of the following financial support for the research, authorship, and/or publication of this article: This work was sponsored by the National Science and Technology Support Program of China (no. 2015BAG19B02) and Project funded by China Postdoctoral Science Foundation (no. 2015M571597).