
Abstract
For the reliable simulation-based fatigue design of railway vehicles, the operation conditions and resulting loads over the lifespan of the vehicle have to be considered. After introducing the relevant fatigue loads on the vehicle and the methods for modelling the fatigue damage, this work aims at analysing the influence of the operating conditions and loads on the damage using sensitivity analysis. Two approaches are studied: the variance-based sensitivity analysis of the loads acting on the car body and the influence of different operating conditions using statistical values per track section. The loads are obtained from multi-body simulations and the damage is estimated using both physical FE-models and meta-models. The performances of linear regression models and polynomial chaos models are evaluated. The proposed sensitivity analysis is applied to the highspeed train being developed in the Next Generation Train (NGT) project at DLR and will serve as a basis for the virtual design and reliability analysis.
Introduction
Car bodies of railway vehicles are in general designed and dimensioned based on static equivalent loads as defined in EN 12663-1 1 for extraordinary and operating loads and in EN 15227 2 for collision scenarios. Real dynamic excitations during operating are not considered. The used equivalent static loads may therefore not be representative and adapted to today’s vehicles and operating conditions. The consequences can be an unnecessary over-sizing of the vehicles, conflicting with the aim of lightweight construction.
Current work at DLR therefore tends to develop a virtual design process for car bodies of lightweight railway vehicles, based on real operating loads. In order to ensure a reliable design, the relevant loads have to be described with sufficient precision. Uncertainties in the load conditions have to be considered so that acceptably low failure probabilities can be guaranteed. Uncertainties may also appear in the suspension parameters of the vehicle modifying the dynamic responses as well as the material properties of the car body structure, in particular the weld seams.
For the fatigue design of railway vehicles various approaches have been developed over the years, using both cumulative damage in the time domain and spectral methods in the frequency domain depending on the considered components, loadsignals and frequency ranges. For instationary vehicle dynamic loads at low frequencies acting on the car body, the use of measured track geometry data and multi-body system (MBS) models allows a reliable simulation of the load-time signals.3–5 Based on detailed MBS simulations the influence of model parameters, e.g. suspensions including active systems, on the loads can be studied in the design phase.6,7 Applying these loads to the car body structure, the fatigue life can be evaluated for different design solutions 8 and a reliable analysis can be performed. 9
For the virtual fatigue design a probabilistic modelling approach, considering uncertainties in the load and vehicle parameters is implemented in this project. Applications of such modelling approaches can be found for component design e.g. railway wheelsets, 10 vehicle dynamics applications 11 and in many other fields e.g. aeronautics. 12 Based on established MBS and FE models, suitable approaches for probabilistic design evaluations are sought in this work. They are required both for the realization of variance-based sensitivity analyses as well as the estimation of the failure probabilities.
A crucial step is the identification of the parameters which have significant effects on the life span. The identified parameters can then be introduced as variables in the design process, allowing studying the propagation of uncertainties and the reliability of the design. For the identified parameters, calibration and validation tests can be defined. The aim of this work is therefore to propose suitable sensitivity methods for the analysis of load and vehicle parameters. Considering the use of probabilistic methods, meta-models and statistical approaches are used allowing large numbers of model evaluations which cannot be reached with the physical models.
The following section introduces the simulation-based fatigue design and describes the process with the models and loading conditions used. In the second section the sensitivity analyses are applied to the Next Generation Train (NGT) using measured track geometry data. Both the direct effect of track geometry conditions on the damage as well as the contribution of the suspension elements to the load transmission are highlighted. Furthermore, it is discussed, to which extend simple meta-models and statistical analyses can replace the costly physical modelling for variance-based sensitivity and reliability analysis.
The simulation-based fatigue design process and sensitivity analysis
For the sensitivity analysis with respect to car body fatigue a cumulative damage approach based on the modelling steps and parameters outlined in Figure 1 is used in this work. It includes the determination of the relevant operating conditions, the computations of the corresponding loads and the evaluation of the resulting stresses and damages in the car body structure.
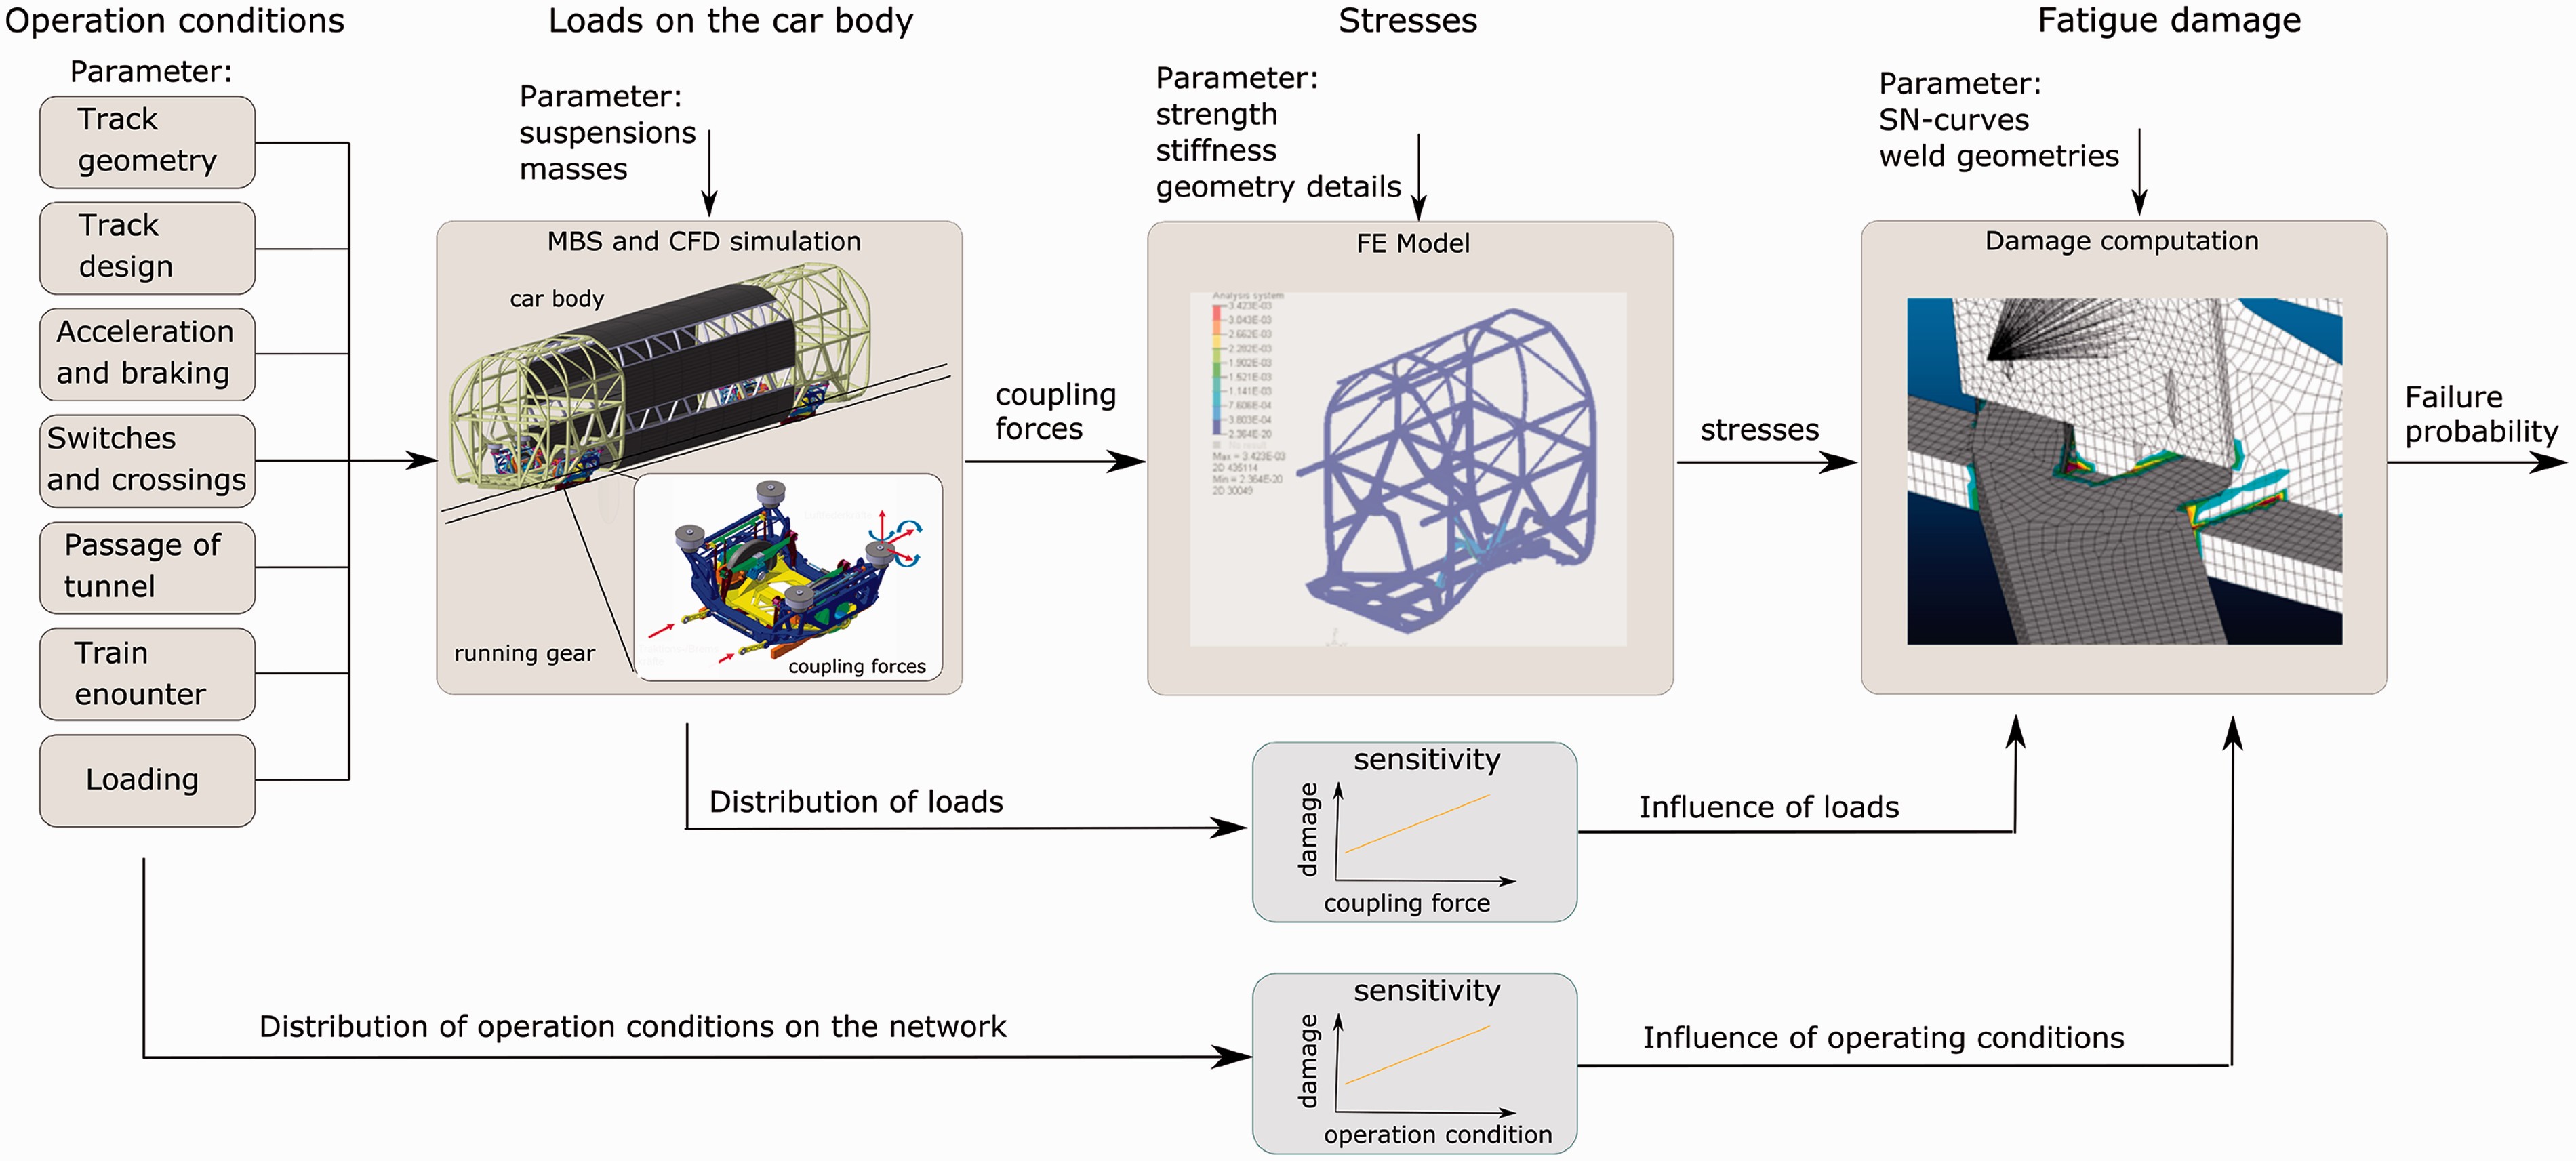
Process of the simulation-based fatigue design.
The operating conditions indicated in Figure 1 depend on the traffic and maintenance schedule. The resulting loads can be determined either from measurements or simulations. Multi-body system (MBS) simulations of the vehicle dynamics were carried out for the NGT at DLR, 13 using measured track geometry data. For the determination of pressure profiles due to tunnel passages and train encounters, measurements and CDF simulations were performed. 14 The forces that are transmitted into the car body structure of the NGT in the event of a crash were determined with the help of crash tests 15 based on the requirements of the EN 15227.
The operating loads lead to stresses in the structure of the car body. They are determined using static or dynamic Finite Element (FE) simulations. Due to the large size of the FE model of the car body, static computations represent a common computation method, as outlined in 16 and. 17 Welds, which are often critical for the service life, are taken into account by computing weld stresses based on notch factors which have been identified from detailed FE models as outlined in.18,19
Operating conditions and loads
Loads defined in standards
Current standards have been used for a long time and offer a reliable basis for the design of railway vehicles. The standard EN 12663-1 1 defines the relevant load cases for the strength and fatigue design of the vehicle. However, in a recent study Malzacher 20 showed that the origin of some load cases in the standard is not clearly documented. Furthermore, for the fatigue design only equivalent quasi-static loads are available. This may lead to oversizing of the structures and prevents an efficient lightweight design. The application of representative operating loads may be the better approach.
Operating loads from vehicle dynamics
Due to the continuous loading and the resulting high number of load cycles, the vehicle dynamics represent one of the most important sources of damage. Track irregularities lead to dynamic wheel-rail forces which are transmitted via the suspension from the running gear to the car body. Beside these dynamic forces, uncompensated accelerations and the running behaviour in curves lead to quasi-static forces.
The real track position deviates from the target track position, specified in the track layout parameters. These track irregularities are described by the parameters track gauge, longitudinal level, cross level, alignment and twist (variation of cross level), defined in EN 13848 21 and measured by specific track geometry measurement devices. In the MBS simulation 22 the track geometry is represented by these measured parameters.
The dynamic effect on the vehicle depends on the wavelengths of these track irregularities and the vehicle speed. According to standard EN 13848, they are measured depending on the line speed in the wavelength range between 1 m and maximal 200 m. For the service speed of 320 km/h analysed in this work, the frequency range of interest up to 20 Hz is covered.
Between the dynamic forces in the wheel-rail contact and the forces acting on the car body, the frequency content changes due to the filtering functions of the suspension elements. Since the eigenfrequencies of the airsprings in the secondary suspension are very low (1–2 Hz), most of the high frequency components are filtered out. However, elastomer elements (traction bar, damper) can also lead to the transmission of higher frequencies.
The passing over switches and crossings leads to forces above the level of normal track geometry excitation. When running on the branch track, the curvature and the discontinuities in curvature result in high accelerations and forces. Moreover, the crossing of the frog imparts a vertical impulse to the wheel and thus leads to high dynamic forces. This effect can be modelled by a vertical defect on one rail. For the representation of high frequency effects due to wheel-rail interaction, more detailed simulation models are required as outlined in. 23
Loads from longitudinal train dynamics
Longitudinal loads are transmitted between the car bodies of the train by the buffers and couplings as well as between the running gears and the car bodies. The simulation of longitudinal loads, which can require detailed component models (brake and propulsion system, couplings etc.), is studied in. 24 Typical operating conditions leading to longitudinal loads are traction and braking as well as coupling and running in curves of small radii.
Loads from aerodynamic effects on the car body
The passing of tunnels and encounters of trains on the neighbouring track lead to aerodynamic loads on the car body in the form of external pressure changes. 25 The resulting pressure difference between the inside and outside of the car body determines the loads and resulting damage to the structure. It depends on the air tightness of the car body, which leads to a time delay between external and internal pressure changes.
Loads from crash cases
In the rare cases when they occur, crash can lead to high loads on the structure. Absorber systems shall dissipate collision energy and avoid that the principal structure is exposed to loads which lead to major deformations.
For the NGT train, crash modules located at both ends of the car body have been developed and tested at 20 km/h by Zimmermann. 15 In the event of a collision, they shall absorb energy and keep the loads on the car body structure as low as possible. The energy absorption is achieved by compression tubes, which also transmit the operating loads in normal service.
Determination of representative load collectives
After identifying the loads which are relevant for the fatigue design, their frequency of appearance and the possible combinations have to be determined. This can be done by selecting and combining load data from different lines and operating conditions. Also the use of virtual test tracks including all relevant load information, similar to vehicle dynamic assessment in 26 and, 27 are a possible solution. These tracks do not represent real tracks but show representative characteristics with respect to track quality and layout. Data can be obtained from sections of real track data or from statistical models as in 28 and extrapolated to complete design collectives. 29
Modelling methods
Multi-body simulations of the vehicle dynamics
Vehicle simulations are carried out using the commerical and common multi-body simulation software Simpack. 22 Models of the NGT High-Speed Train (HST) middle car, the end car and a shortened train consisting of 6 cars with two end cars and four middle cars are available.
The NGT HST running gear concept7,30 is based on independently rotating wheel pairs which are installed in single wheel pair and double wheel pair frames. Figure 2 illustrates the running gear of the middle car with a single wheel pair frame. The primary suspension between the axle beam and the bogie frame consists of leaf springs and vertical dampers. The secondary suspension is composed of four air springs on each bogie corner including the anti-roll system, two symmetrical lateral dampers and an active lateral centering device. Longitudinal traction and braking forces are transferred by two traction rods from the bogie frame to the car body.
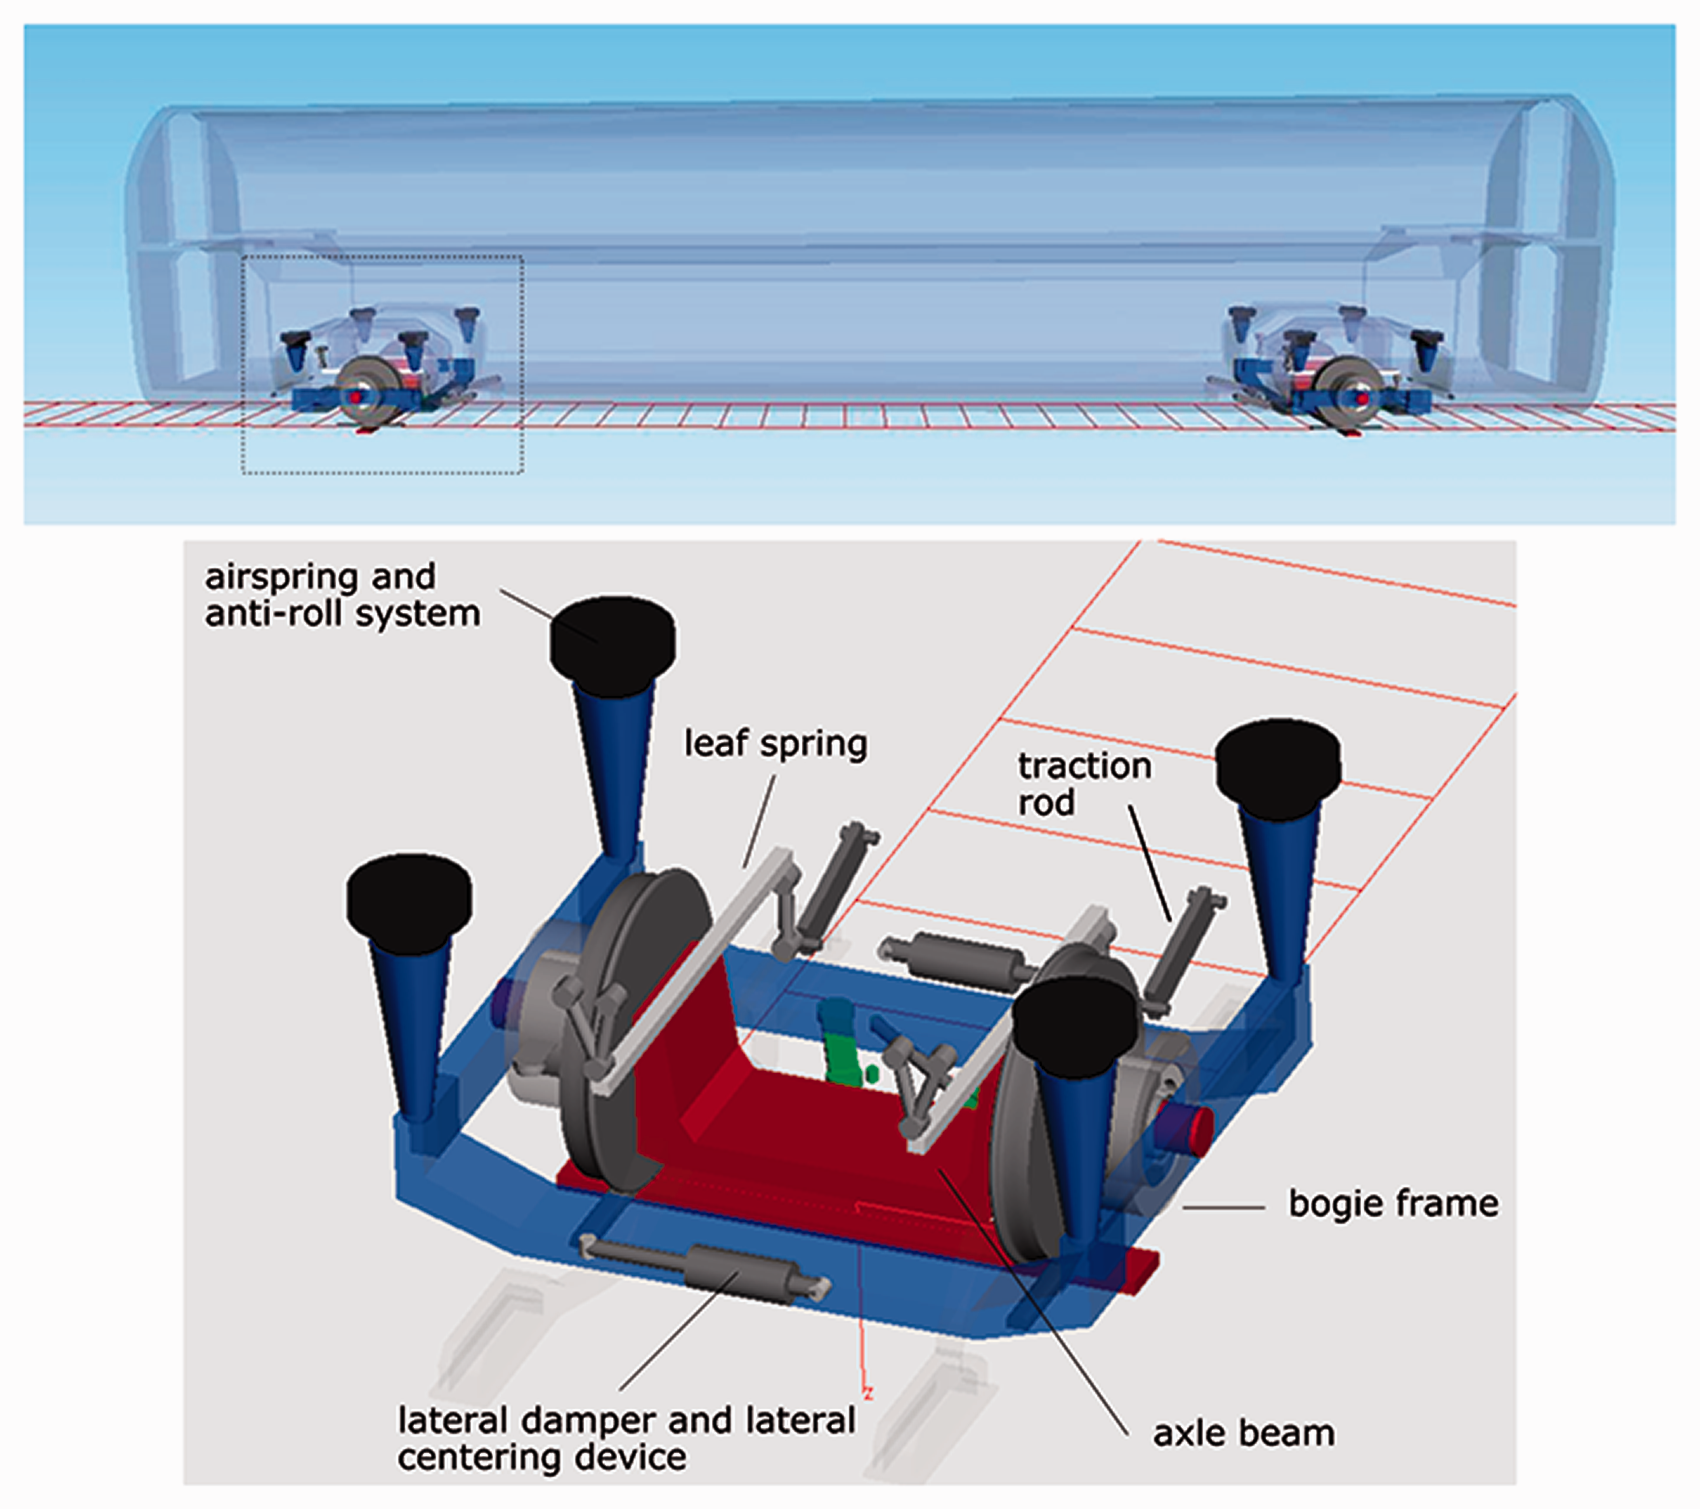
MBS model of the NGT middle car with the running gear and the suspension elements.
The propulsion system of the train is distributed over all wheels with higher traction power installed in the two end cars. Since the independently rotating wheels do not have self-steering capability, a lateral guidance control based on the torque vectoring principle on the wheel pair, is used.
For the assessment of the lateral and vertical dynamics due to track geometry the model of the NGT HST middle car is used. The longitudinal dynamics is studied using the shortened train model.
Different operating scenarios are simulated by loading the measured track layout, track irregularities and configured speed profiles. A tool for automated route construction and post processing of simulation data is implemented in Matlab.
Finite-element modelling of the stresses
The loads which are acting on the car body lead to stresses and consequently to damage of the structure. For the modelling of the stresses a Finite Element (FE) model is created based on the CAD model of the car body. The computation can be performed by static or transient simulations.
In the simple static case, the stresses are computed only once for each load, using a unit load value. The unit stresses are then scaled with the time signals of the loads and the resulting element stress tensors of every load are superposed at every time step. Since the loads are independent and thus non-proportional to each other the resulting stress tensors shows variable main stress axes. Therefore the method of the critical cutting plane 31 is used for the computation of the equivalent stresses.
However, for applying the static simulation two requirements have to be fulfilled: the model has to be linear, allowing the scaling and superposition of the stresses, and the effect of the car body eigendynamics on the damage is negligible.
Since the model is linear-elastic and no large displacements appear, the first requirement is fullfiled. However, changing boundary conditions required for computing the different load cases have a nonlinear effect. By using the inertia relief method 32 based on a free floating car body without fixed boundary conditions this nonlinearity is avoided.
In order to verify the second requirement, modal analysis of the car body structure is performed. The lowest eigenfrequency is compared with the frequency content of the loads. Based on the element strain energy attributed to every mode, structural parts in which eigendynamics may lead to increased stresses are identified and can then be analysed by modal-transient simulations in the fatigue design.
Evaluation of the damage and lifespan
For all relevant parts of the car body structure the damage is computed using the linear damage accumulation method according to the modified Miner rule. 31 Welds are not directly modelled in the FE structure but considered in the fatigue tool Femfat. 19 The stresses are evaluated at a defined distance to the weld using interpolation of the element stresses. They are then transformed in the local weld coordinate system and scaled using weld specific notch factors which have been identified from detailed FE models and are available in the Femfat data base. The equivalent stress in the weld is computed according to the DVS 1608 33 standard.
The equivalent stresses are then analysed using the Rainflow counting method, 31 giving the Rainflow matrixes, which classify the stress cycles according to the mean value, the amplitude and the number of cycles. Finally, the damage is computed from element specific SN-curves (Woehler curves).
Meta-modelling
Sensitivity and reliability analysis require a large number of model evaluations. If the evaluation of the physical model is costly, meta-models can be implemented. These black box models are trained and validated from measurement data or results of the physical model. Depending on the system behaviour, linear and nonlinear meta-models exist. In literature, neural networks (NN) and polynomial chaos models (PCM) are proposed for modelling nonlinear system behaviour. In 34 PCM is used for analysing vehicle dynamics under uncertainty. In 28 the computation of the stresses and the Dang Van fatigue index is replaced by a polynomial chaos meta-model.
In polynomial chaos models, the polynomial basis is not described by deterministic polynomials, but by multivariate polynomials depending on the distribution of the input parameters

Sensitivity analysis
The sensitivity analysis aims at determining the damage relevant input parameters by varying parameter values and studying their effects on the damage. Based on the results, the calibration and validation of the model can focus on the significant parameters and the effect of uncertainties can be evaluated. Besides, the influence of the parameters can be checked for physical consistency and robustness of the model. Furthermore, an improved understanding of the interactions of the different loads with respect to the damage can be gained.
The evaluation of the sensitivities of the input parameters on the damage requires the following analysis steps: Determination of the input parameters of the model, differentiated in probabilistic and deterministic variables Determination of the distribution of the input parameters (value range, probability density functions) Propagation of the input distributions to the model output using sampling methods Quantification of the influence of the input parameters on the damage
Selection of methods
Various qualitative and quantitative sensitivity methods have been developed as outlined in. 36 They can be divided into local and global methods. Local methods do not take into account the coupling effects of the input parameters on the result. They analyse the influence of a parameter at a defined working point with the other parameters fixed (one-parameter-at-a-time). Global variance-based sensitivity methods (multi-linear regression and nonlinear methods) allow taking this influence into account by covering the complete distribution range of all parameters.
One-Parameter-at-a-time method (OAT)
The easiest way to carry out a sensitivity analysis is to vary each parameter separately while all other parameters are fixed at their nominal value. However, the influence of one parameter on the fatigue damage can depend on the values of the other parameters. This coupling effect is neglected in the OAT method. Since operating loads can appear in various combinations, this method therefore seems unsuitable.
Regression analysis
Based on Monte-Carlo sampling a multi-linear regression analysis between the N input parameters and the damage can be performed. The regression coefficients

The Standard Regression Coefficients (SRC) are obtained by normalizing the regression coefficients αi with the standard deviation of the input parameter δi and the damage δY as:

The SRCs are a more suitable measure of the sensitivities, since they consider both, the weight of a parameter in the regression and the value range of this parameter and thus its effective influence.
The multi-linear regression model requires linear behaviour. By computing the determination coefficient R2, describing the part of the output variance explained by the expression model, the linearity of the data can be analysed. Only if R2 is close to one, indicating linear behaviour, the regression coefficients can serve as global sensitivity indices.
Variance-based methods
Variance-based methods are global sensitivity analysis methods which study the influence of the distribution of the input parameters on the distribution of the result. 36 Coupling effects are taken into account and it is possible to analyze the propagation of uncertainties through the model. These methods require the application of sampling methods, in order to estimate the distribution of the damage from a sufficient number of model evaluations.
For evaluating the influence of a parameter Xi on the variance of the result

Interactions describe the coupled influence of several interacting parameters on the result. For the example of two input parameters, the variance Vij is defined as the joined effect of the two parameters minus the first-order effects:

To distinguish between the single influence of an input parameter Xi and the complete influence of that input parameter considering the coupling with other input parameters, the total sensitivity index

Thus, if the total index is significantly higher than the first-order index, this indicates a strong coupling of the parameters. In order to reduce the computing effort, the Sobol indexes 35 based on the evaluation of two samples are used.
Variance-based sensitivity analysis with correlation of inputs
The sensitivity indices described in the previous sections are based on the assumption that the input parameters are independent one from another. If instead the correlation between parameters is close to one, the dimension of the input parameter vector is reduced and the parameters are considered as one input. For two dependent parameters Xi and Xj, the sensitivity index is therefore defined as:

More difficult is the case of parameters which are partly correlated. In general, the use of the first-order sensitivity index remains a good estimation of the influence of a parameter. When analysing the effect of fixing a parameter on the variance of the output, the correlation of this parameter with other parameters will lead to a larger reduction of the output variance. The influence of the studied parameter is overestimated but not hidden.
Realization of the sensitivity analysis
In a first step, all input parameters and the output of the sensitivity analysis have to be defined. The output, given by the damage in the structure, is computed for all relevant elements in the FE model. In the sensitivity analysis both the overall maximal value for the structure with possible changes of the location and fixed critical locations (e.g. weld seams) are evaluated.
The sensitivity analyses outlined in Figure 1 are performed as follows: Loads on the car body: The influence of the loads transmitted over the suspension into the car body is studied using variance-based sensitivity analysis by computing samples obtained from the fitted normal distributions of the input parameters. Operating conditions: The influence of different operating conditions is studied using MBS simulations on measured track data. Input parameters are the track layout, the track irregularities and the passages over switches. For this purpose the track is separated in sections of equal length and regression analysis using statistical values per section is applied. The influence of speed is not studied, since operation at the admissible service speed is assumed.
Lines in a network distinguish significantly with respect to their track layout and track quality. The standard EN 13848 37 defines 5 quality classes (A to E) which are based on the standard deviations of the track geometry parameters computed over sections of 200 m lengths. The technical report TR 16513 38 gives a survey of track geometry quality in European networks. In 3 the influence of operating conditions is studied using measurements and MBS simulations. If a sufficient amount of measured track data is not available, stochastic models are used as proposed in. 39
Application of the fatigue computation process to real track data
The coupling forces and moments on the car body are obtained from MBS simulations of the NGT middle-car model on measured track data, representing 50 kilometres of a high-speed line with slab track and 320 km/h service speed. The track geometry data is separated in track layout and track irregularities by filtering at 200 m wavelength.
The stresses and damages are evaluated in the aluminium structure of the car body shown in Figure 1. Fibre composite parts are not considered. Damage values in the sensitivity and regression analysis are expressed with reference to the rupture damage value in the SN-curve (damage = 1).
Analysis of the loads acting on the car body
The time signals of the loads contain dynamic components caused by the track irregularities as well as quasi-static forces due to the uncompensated lateral accelerations in curves. By applying a bandpass filtering, these components are separated: Filtering: low-pass 0.2 Hz for quasi-static components Filtering: band-pass 0.2–20 Hz for dynamic components
Figure 3 shows the separation of the lateral airspring force into the dynamic and quasi-static components for a short track section. The influence of the curves can be clearly seen in the quasi-static force component.
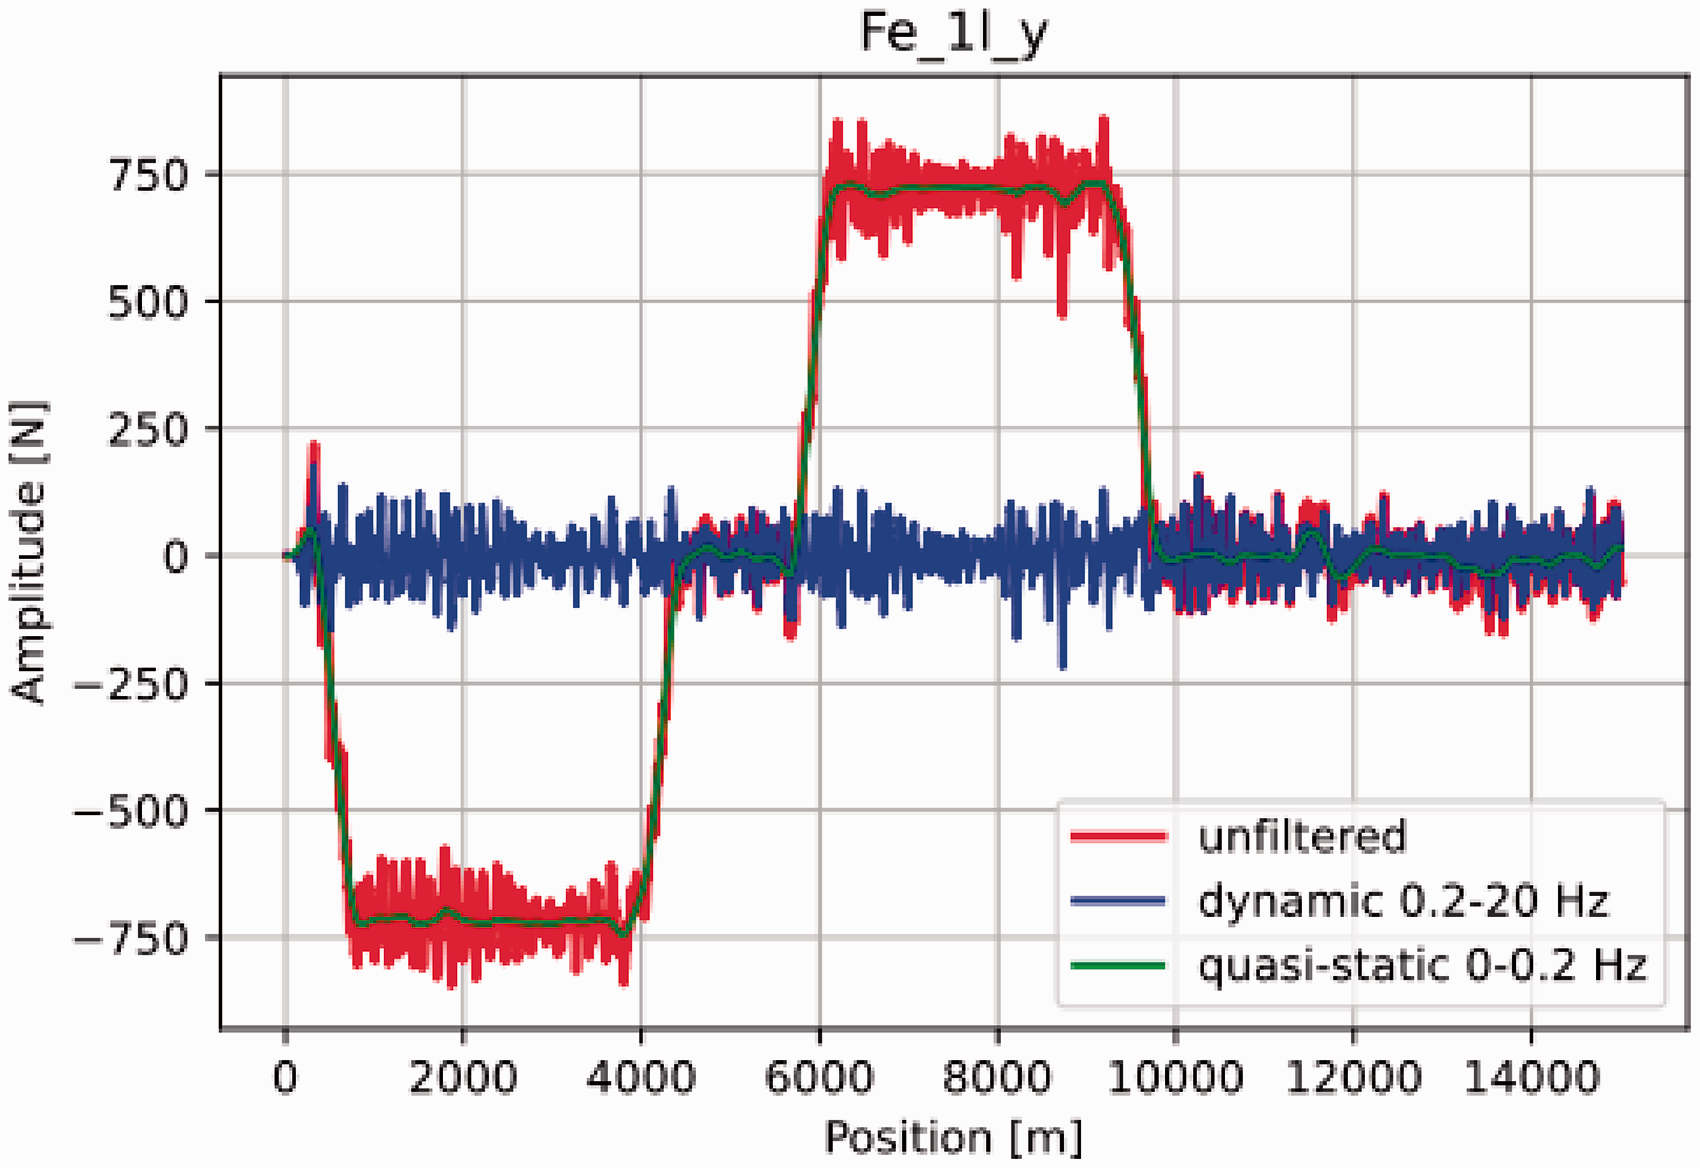
Separation of the coupling loads in the quasi-static and dynamic part (lateral airspring force).
The frequency content of the dynamic loads is analysed by computing the Power Spectral Densities (PSD) and compared with the eigenfrequencies of the car body, obtained from modal analysis. Figure 4 shows, that e.g. the air springs filter out most of the vibration energy above 2 Hz while the traction rod transmits higher frequencies into the car body structure.
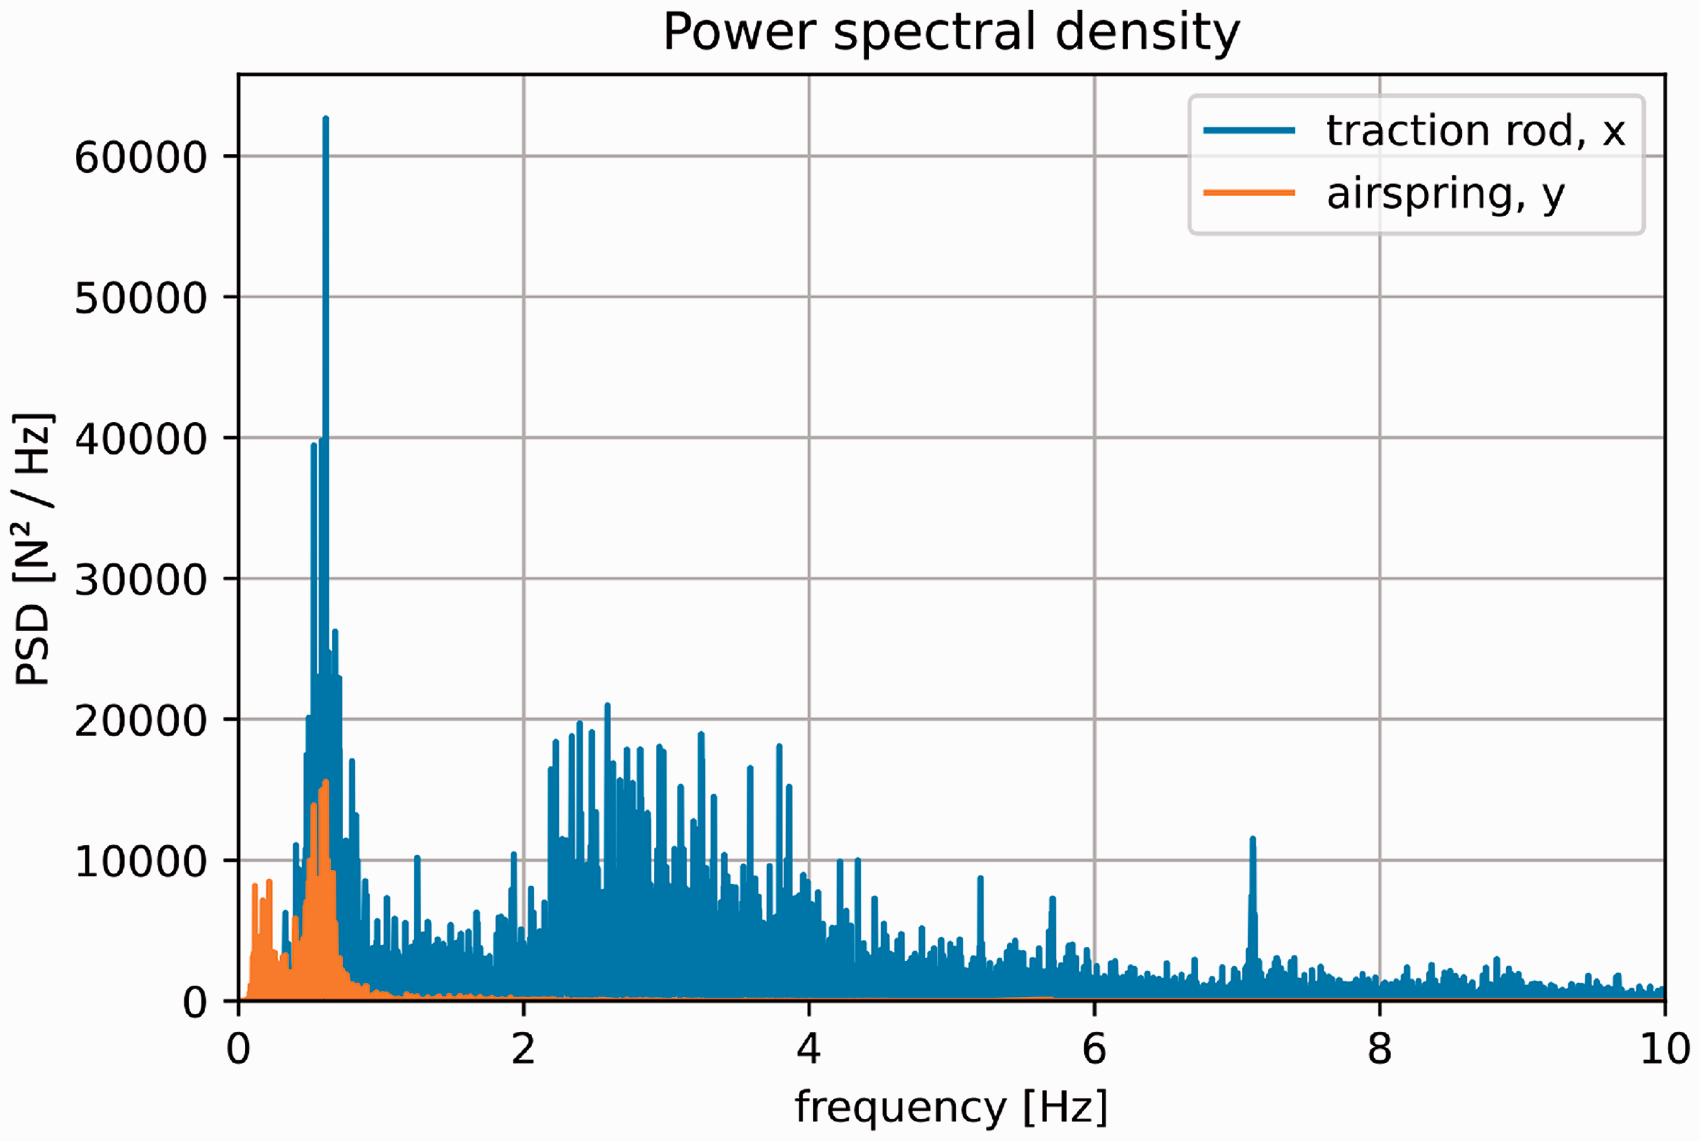
Power spectral densities (PSD) of the dynamic lateral airspring and longitudinal traction link force.
The lowest eigenfrequency of the car body appears at 9.5 Hz. It is due to local buckling of the lightweight upper floor in the middle section of the car body. The first vertical bending mode appears at 17.7 Hz. The analysis of the modes and elastic strain energies indicates, that the stiff car body section above the running gear, where the maximum damage appears, is effected by structural dynamics only at high frequencies. The quasi-static computation of the stresses is therefore applicable.
The distributions of the dynamic and quasi-static loads are analysed by computing the probability density functions (PDF). Normal distributions are fitted to the empirical distributions.
For the lateral airspring force
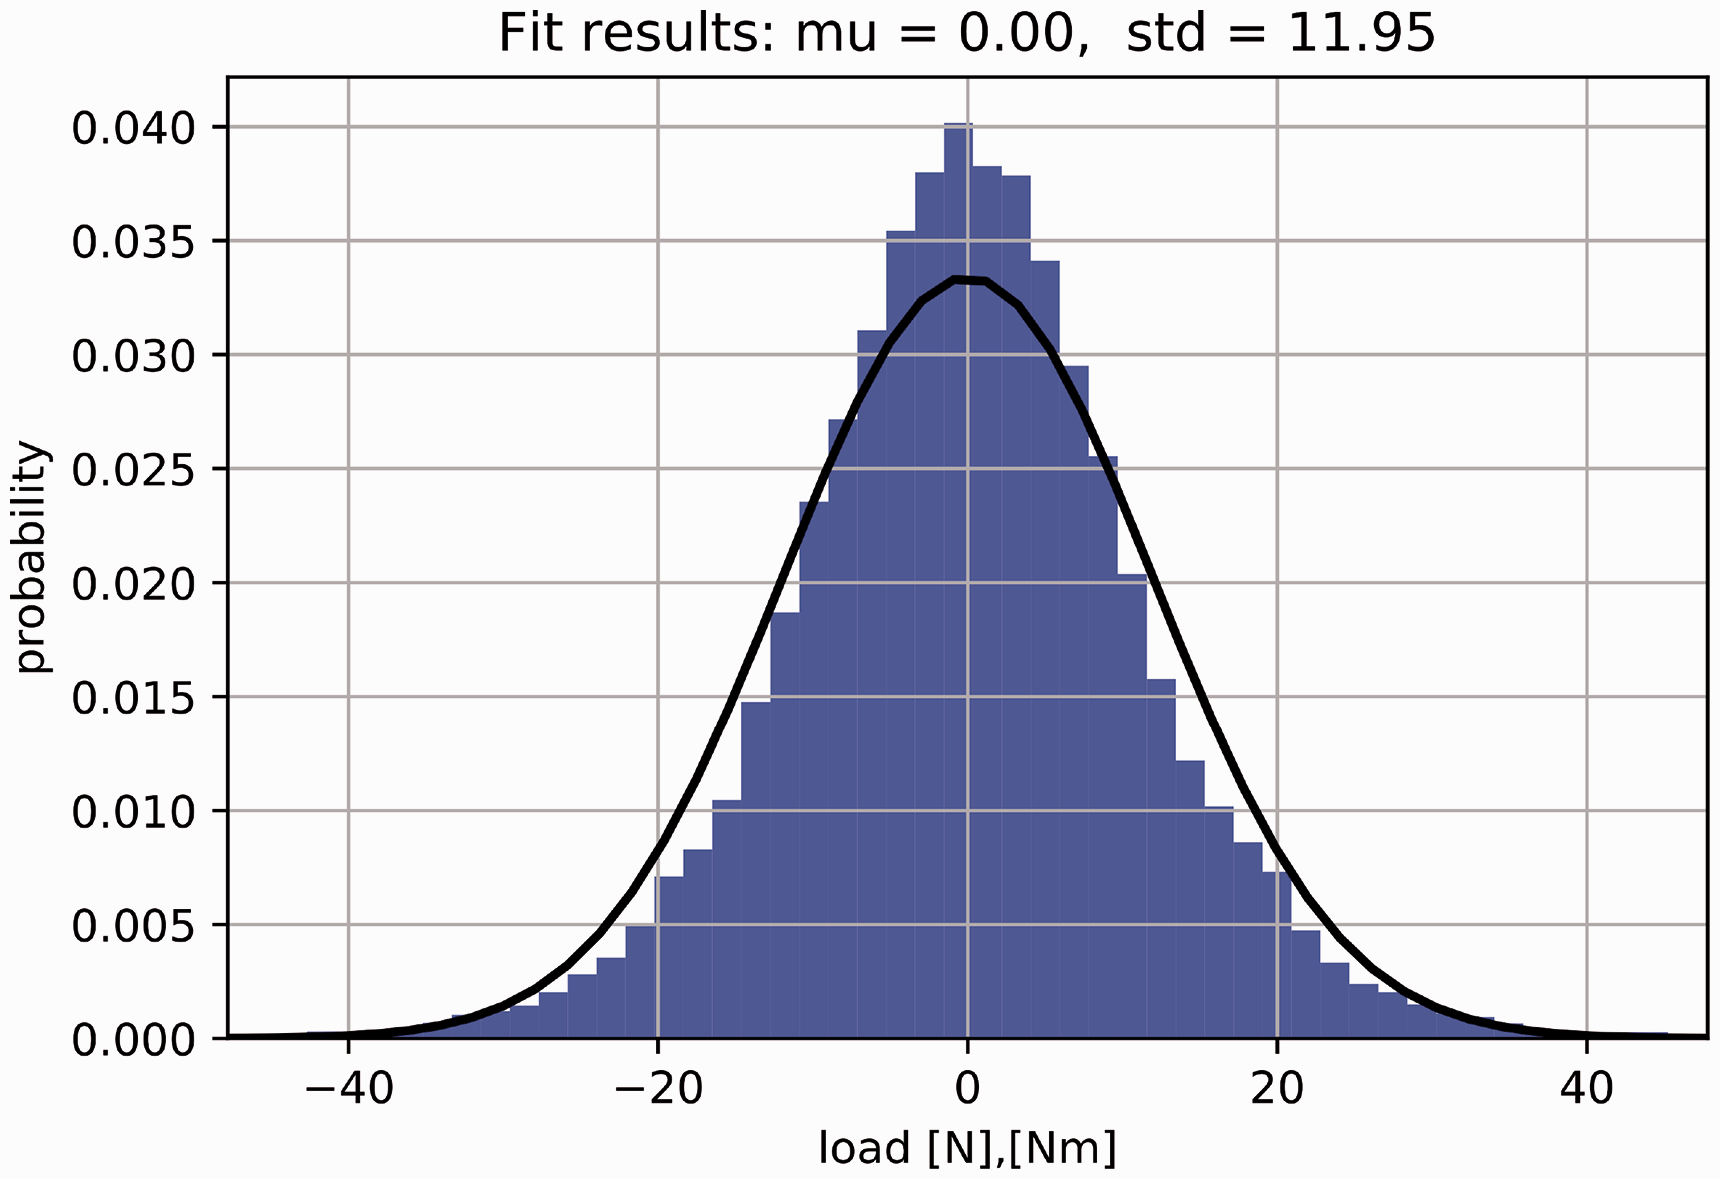
Empirical and fitted normal distribution of the dynamic lateral airspring force.
The distributions of the loads are summarized in box plots in Figure 6. It is observed, that the vertical forces and the longitudinal forces in the traction rods are most significant. Lateral forces from the dampers and the active lateral centering system show also significant amplitudes.
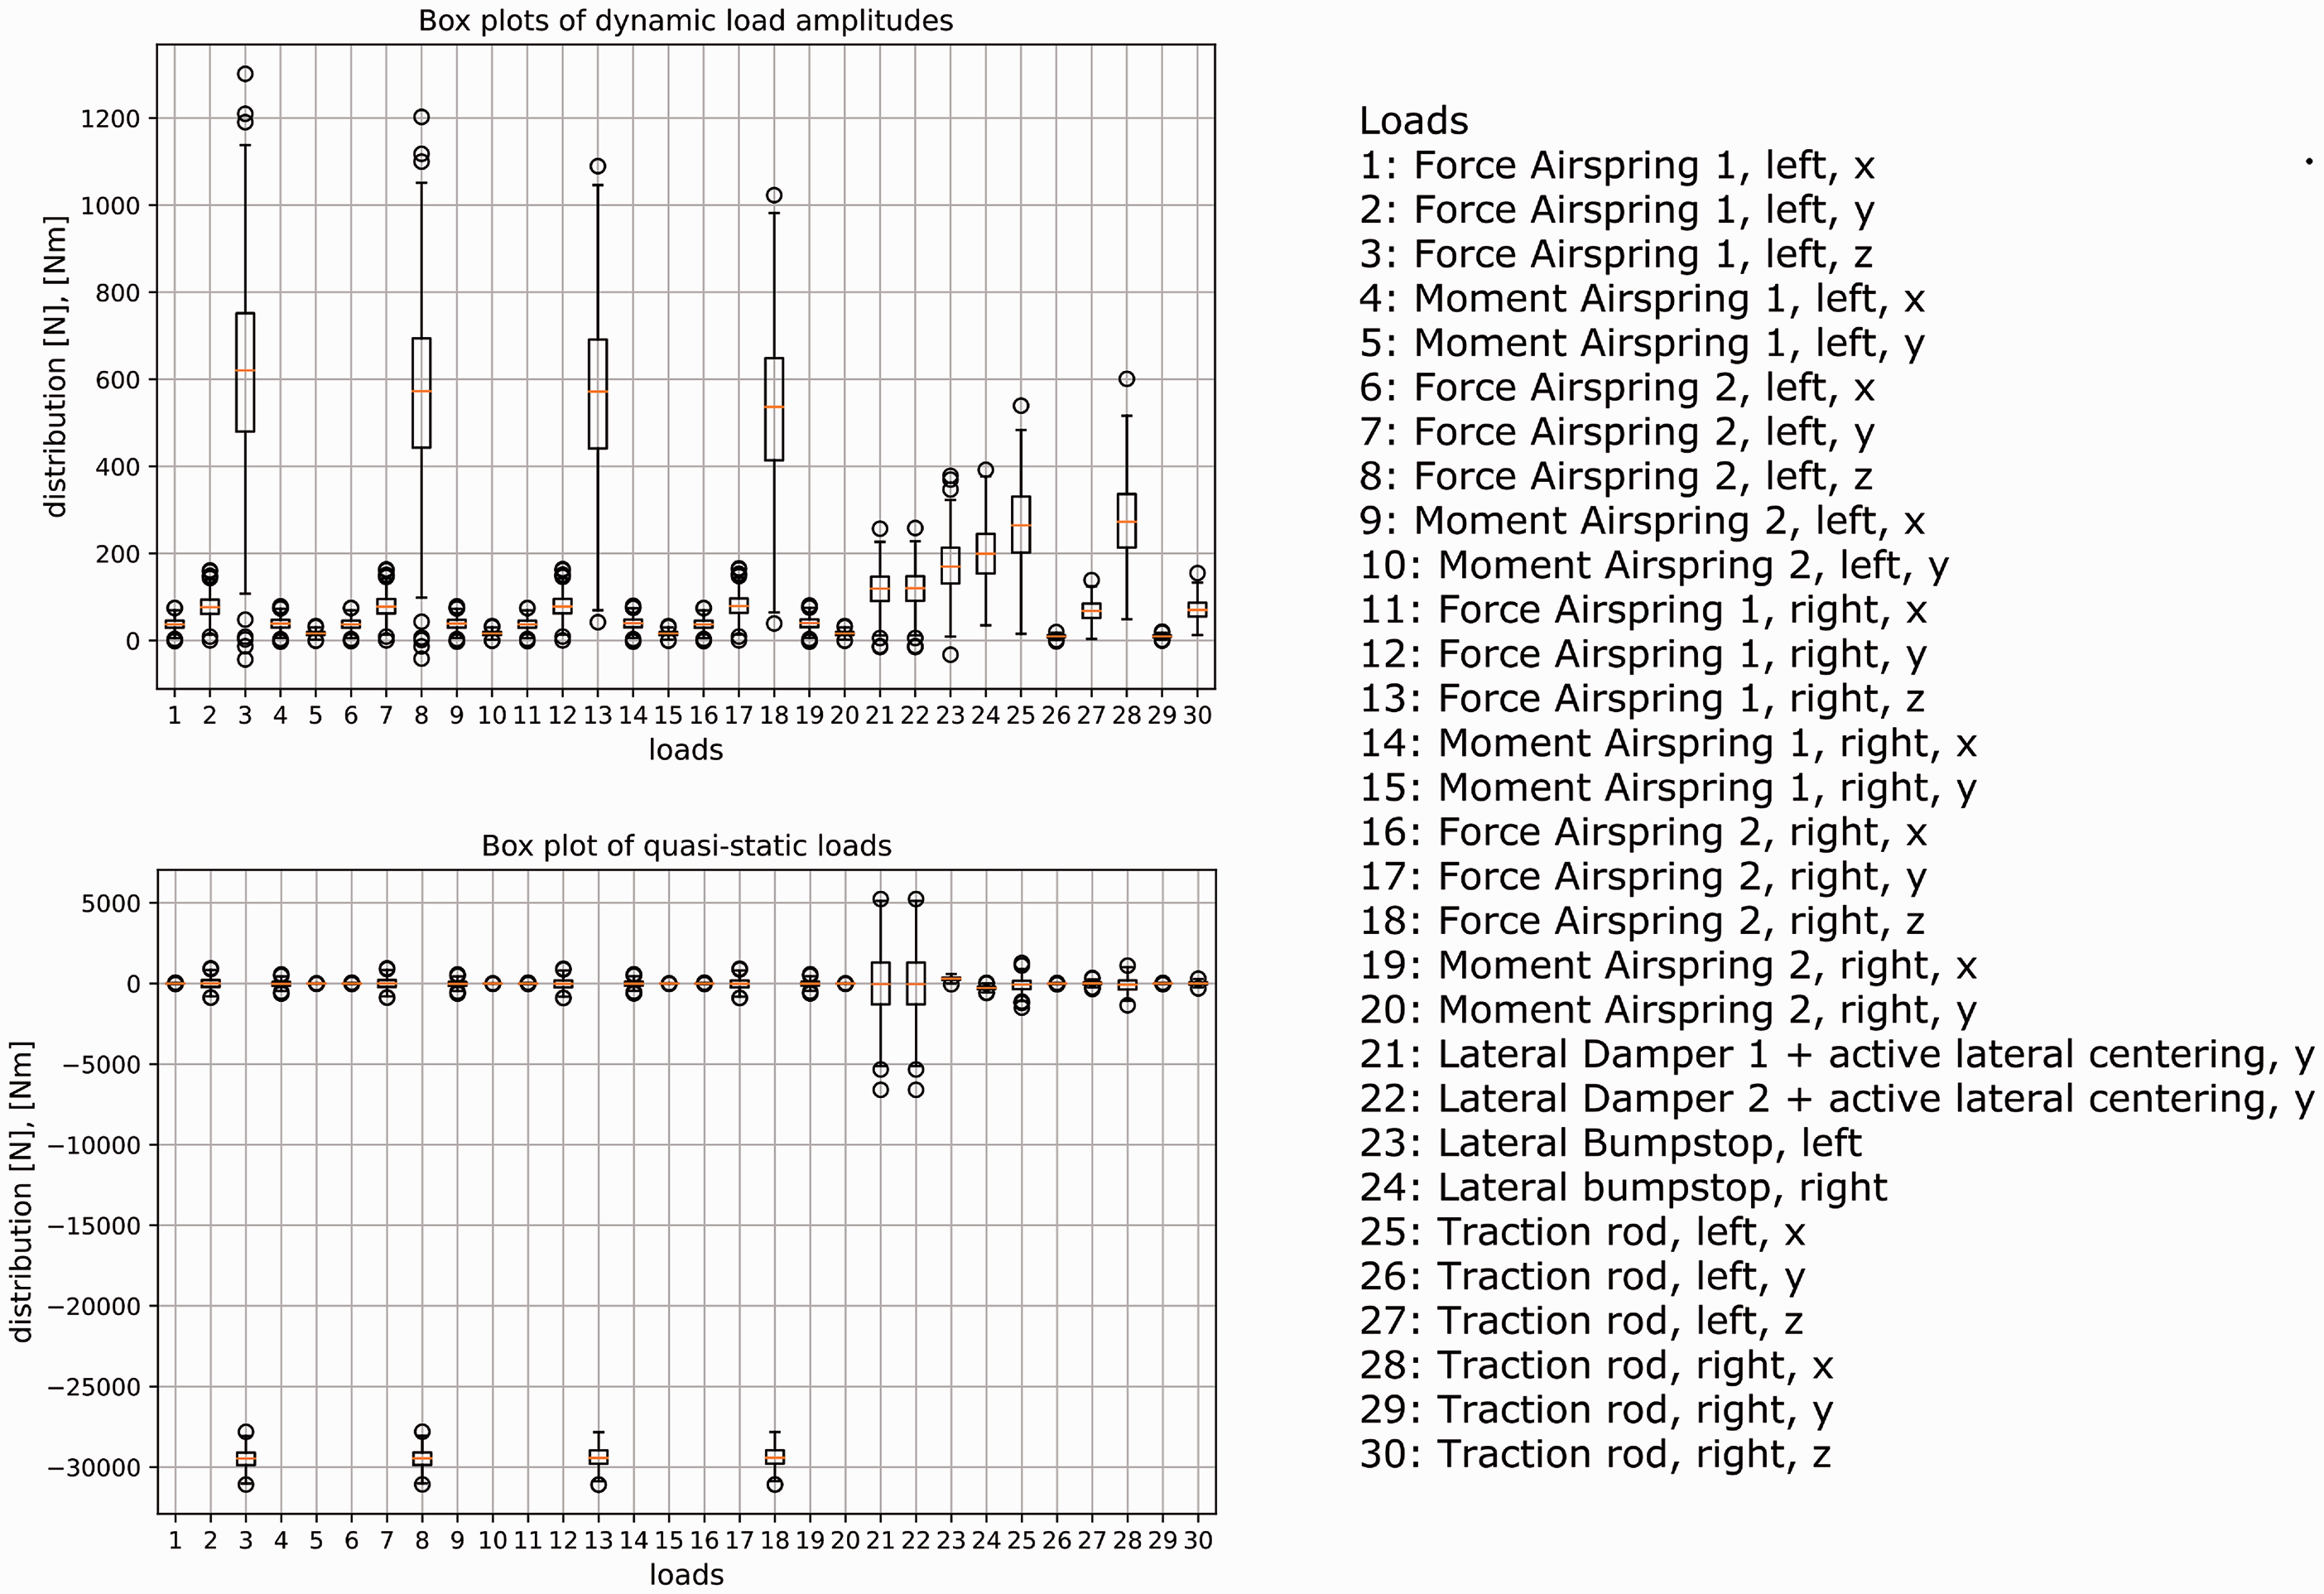
Box plots of the dynamic and quasi-static load components, fitted by normal distributions.
The dependency of the input loads, separated in their dynamic and quasi-static components, is examined with the help of the correlation matrix in Figure 7. Due to the different frequency ranges, the correlation between the dynamic and the quasi-static loads is very low. Among the dynamic and quasi-static loads, several forces show correlations close to 1 or −1. This is e.g. the case for the two airpsrings on the same side of the running gear, which are exposed to the same excitation.
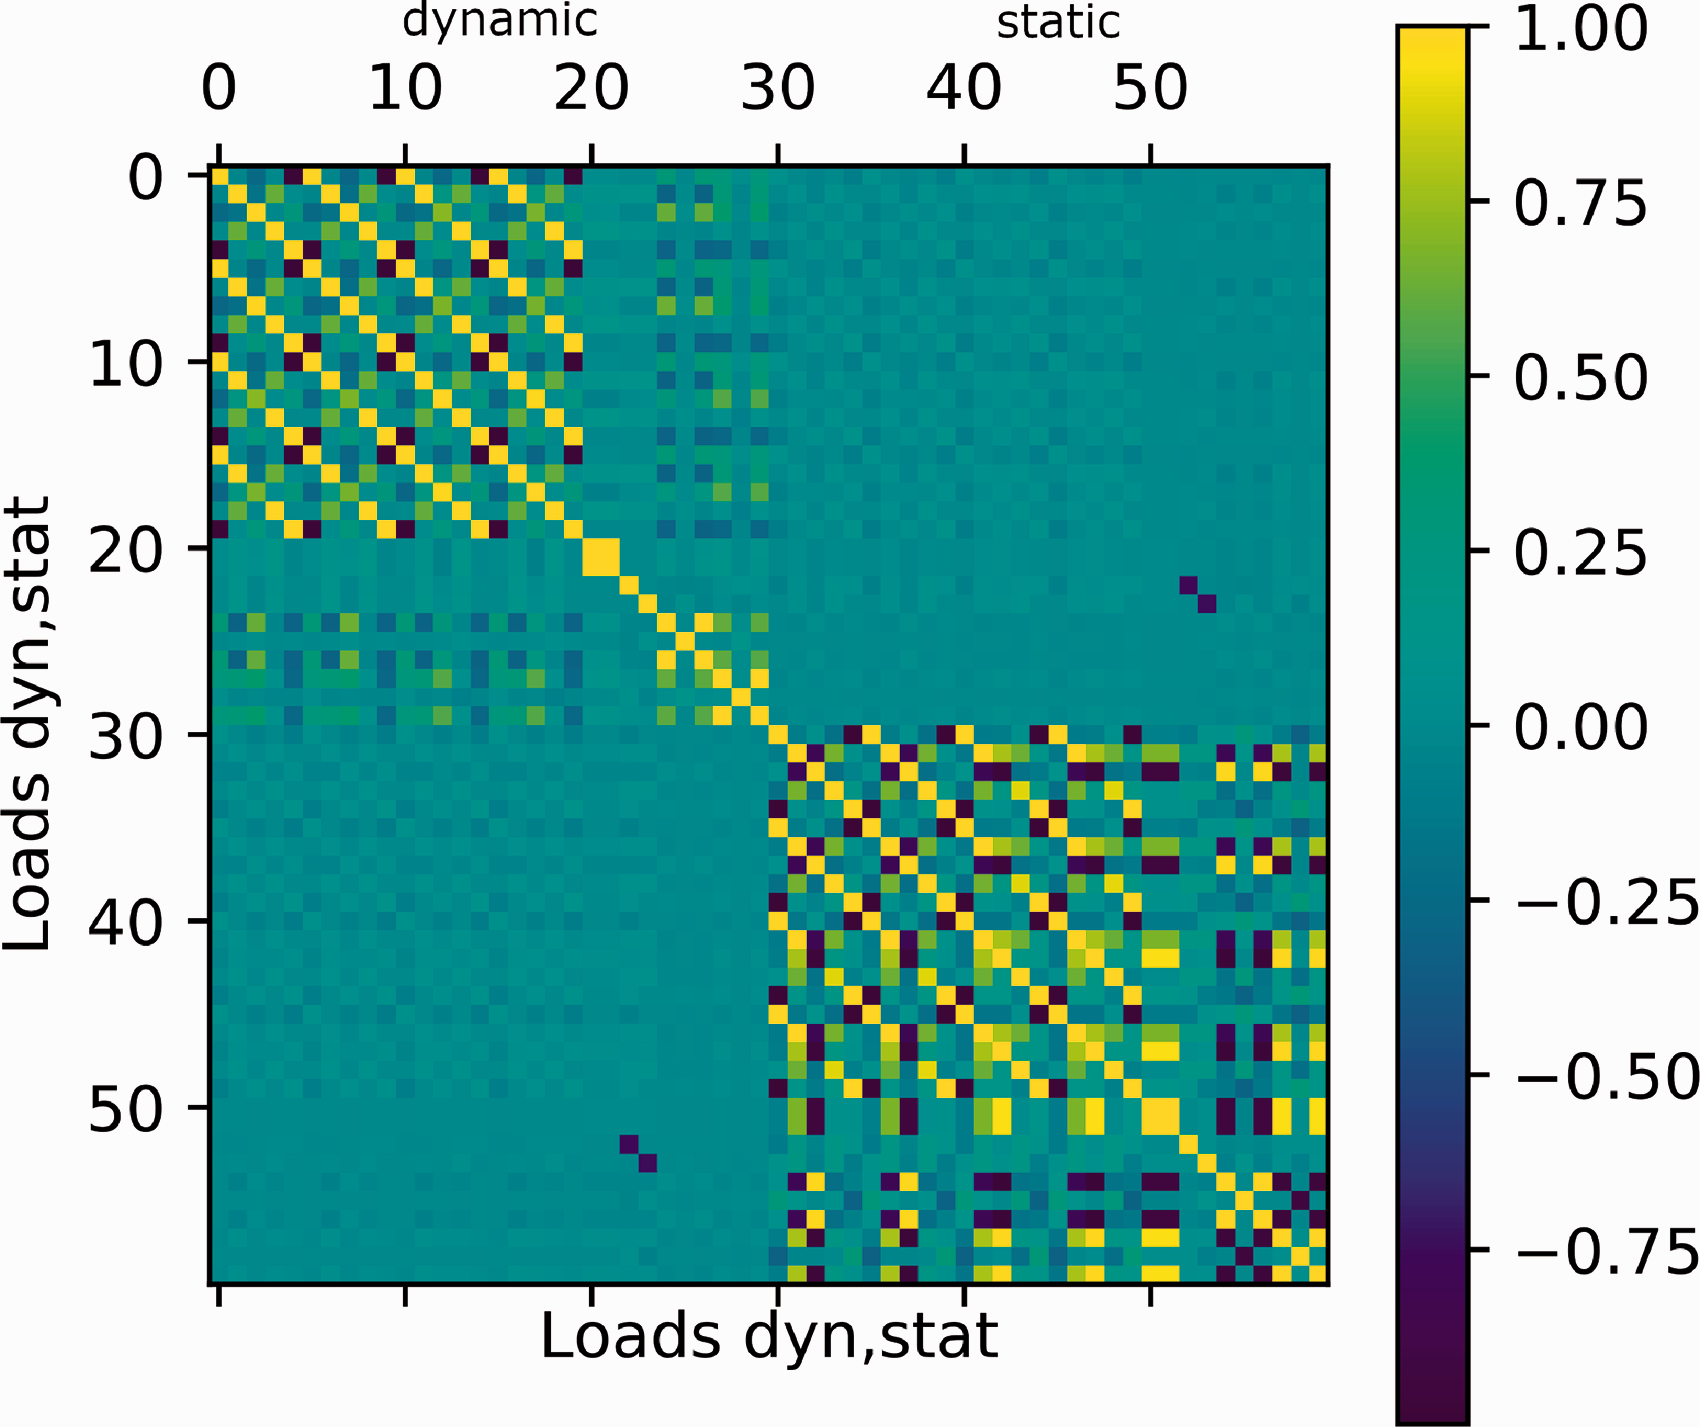
Correlation matrix between the dynamic and quasi-static loads acting on the car body.
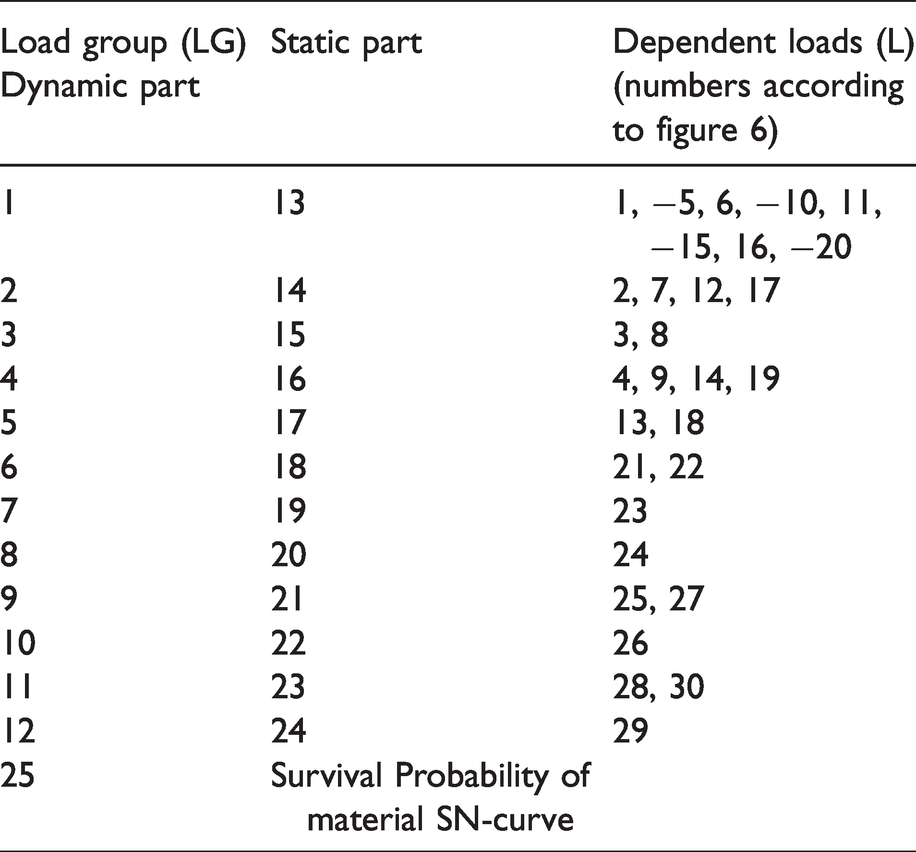
If the correlation of loads is close to one (≥0.9), they are merged to one input parameter in the sensitivity analysis. The result of the correlation analysis is summarized in Table 1. The 60 loads, considering both the dynamic and quasi-static part, are represented by 24 independent input parameters, each of them describing a group of dependent loads. Additionally, the material influence is considered by the survival probability of the material SN-curve.
Correlation analysis of input loads.
In the sensitivity analysis, the influence of the load amplitudes on the damage is investigated for sinusoidal vibrations with a uniformly defined number of cycles giving a multi-load component SN-curve analysis. This allows a simple comparison of the sensitivity coefficients. Since static FE-modelling is used, the damage depends only on the number of cycles and not on the frequency.
Variance-based sensitivity analysis for the loads
For the variance-based sensitivity analysis a sufficient number of samples has to be evaluated. For each model evaluation, a dynamic and quasi-static value is randomly selected from the distributions of the loads. The dynamic amplitude is used to scale the unit sine excitation while the quasi-static amplitude corresponds to the mean value. According to the SN-curve, the output parameter is defined as the logarithm of the damage.
Based on the sampling data a multi-linear regression analysis is performed first. The Standard Regression Coefficients (SRC) can be used as quantitative sensitivity indices, if the model has linear behaviour. However, weak nonlinear behaviour with an R2 value of 0.92 is observed for the complete input data set. If only the dynamic load components are used in the regression, the R2 value decreases slightly to 0.90, indicating that the damage is nearly completely determined by the dynamic load components.
In order to take both nonlinear and coupling effects into account the variance-based Sobol indices are computed. Considering the high computational cost of the physical modelling process, a meta-modelling approach is applied.
Use of a meta-model for the damage estimation
For the creation of meta-models, a Monte-Carlo simulation with 1100 samples is carried out. Then 600 samples are used for the identification of the model parameters (training) and 500 for the validation of the meta-model.
When applying a linear meta-model a R2 value of 0.92 is obtained in the validation, thus reproducing the result of the multi-linear regression.
Polynomial chaos models have been trained and validated for model orders from 1 to 3 and a variable number of training samples ranging from 100 to 600. The model qualities, expressed by the R2 determination coefficients between the physical and the meta-model result for the validation data set of 500 samples are given in Figure 8 and Table 2. For a sufficient number of at least 500 training samples the PCM model of order 3 gives a very good model quality with
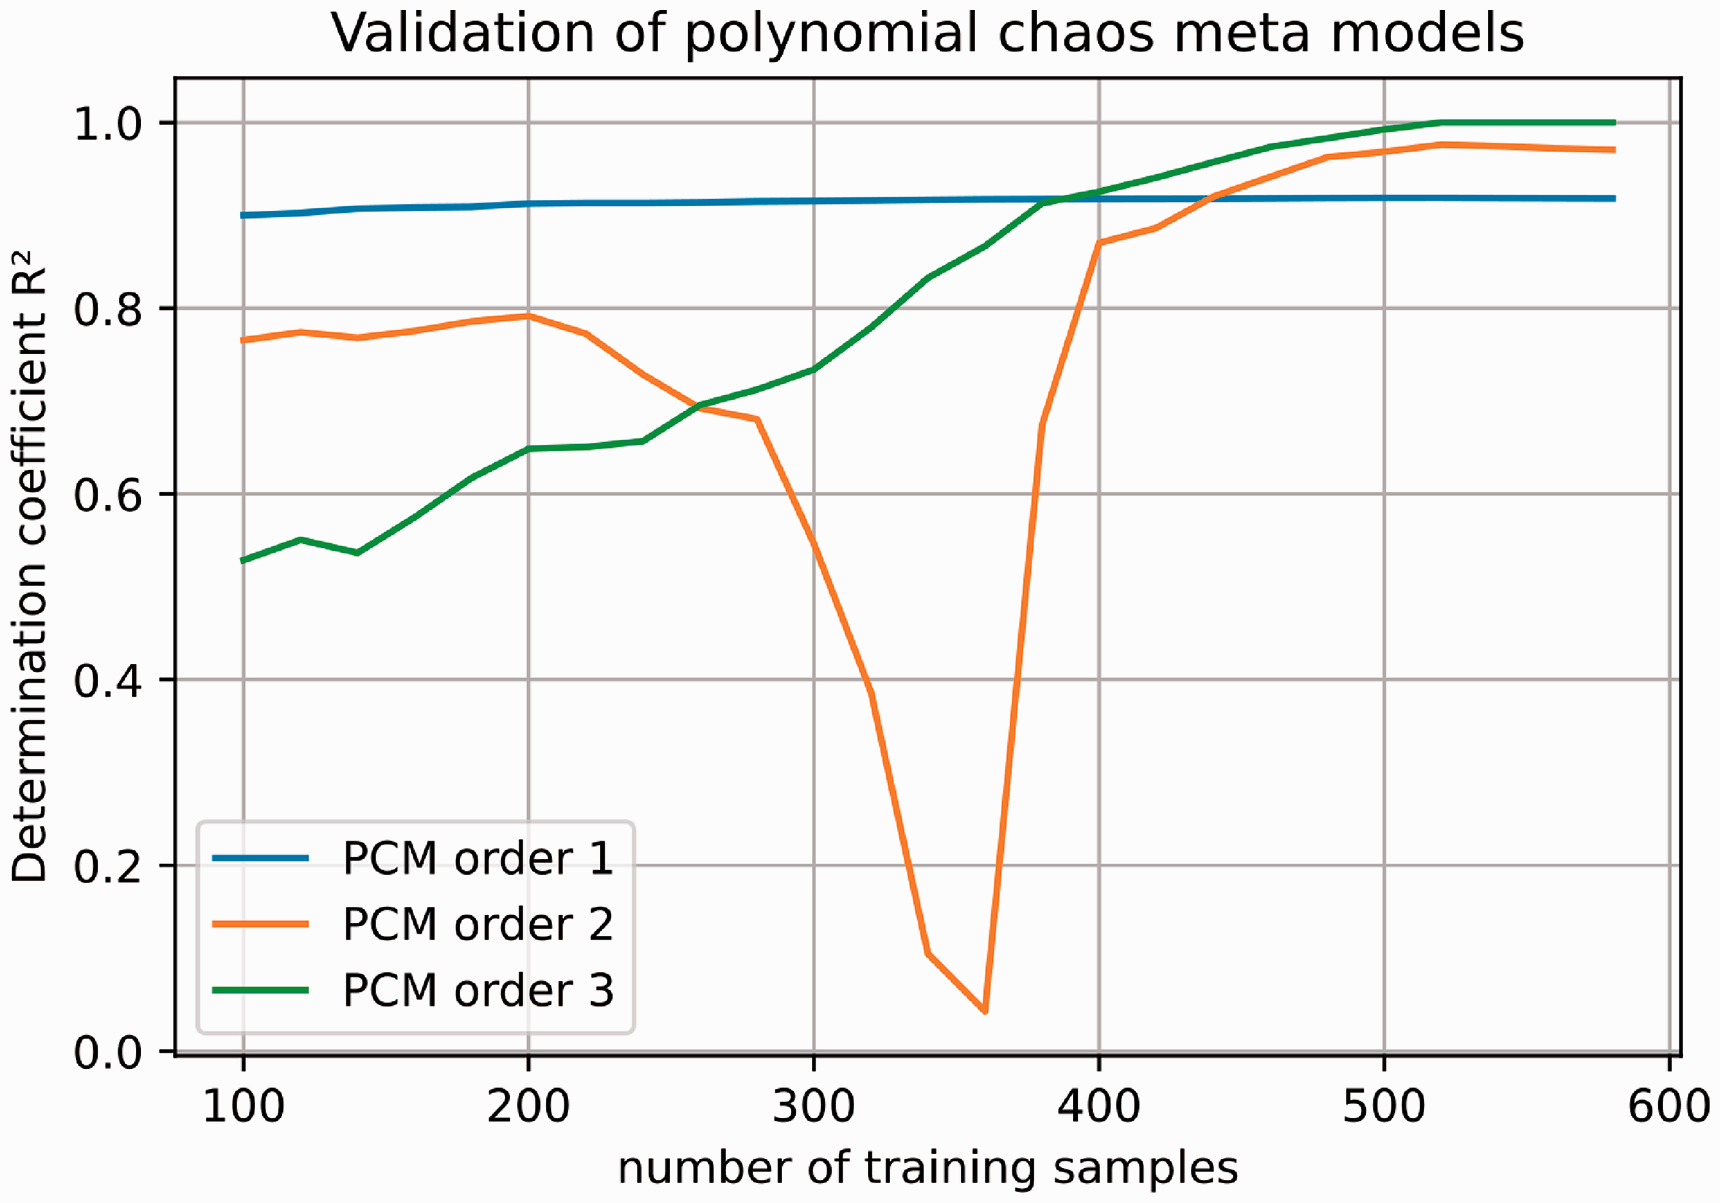
Performances of polynomial chaos models as a function of training samples and the model order. The validation is performed for 500 data samples.
Validation of meta models using 600 training samples.
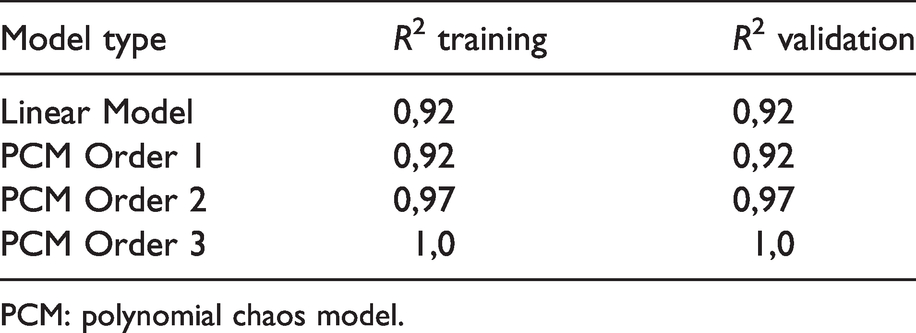
PCM: polynomial chaos model.
Finally, the Sobol indices are computed using the PCM with order 3 and represented in Figure 9. The input parameter groups 3 and 5, including vertical airspring forces, have the highest influence.
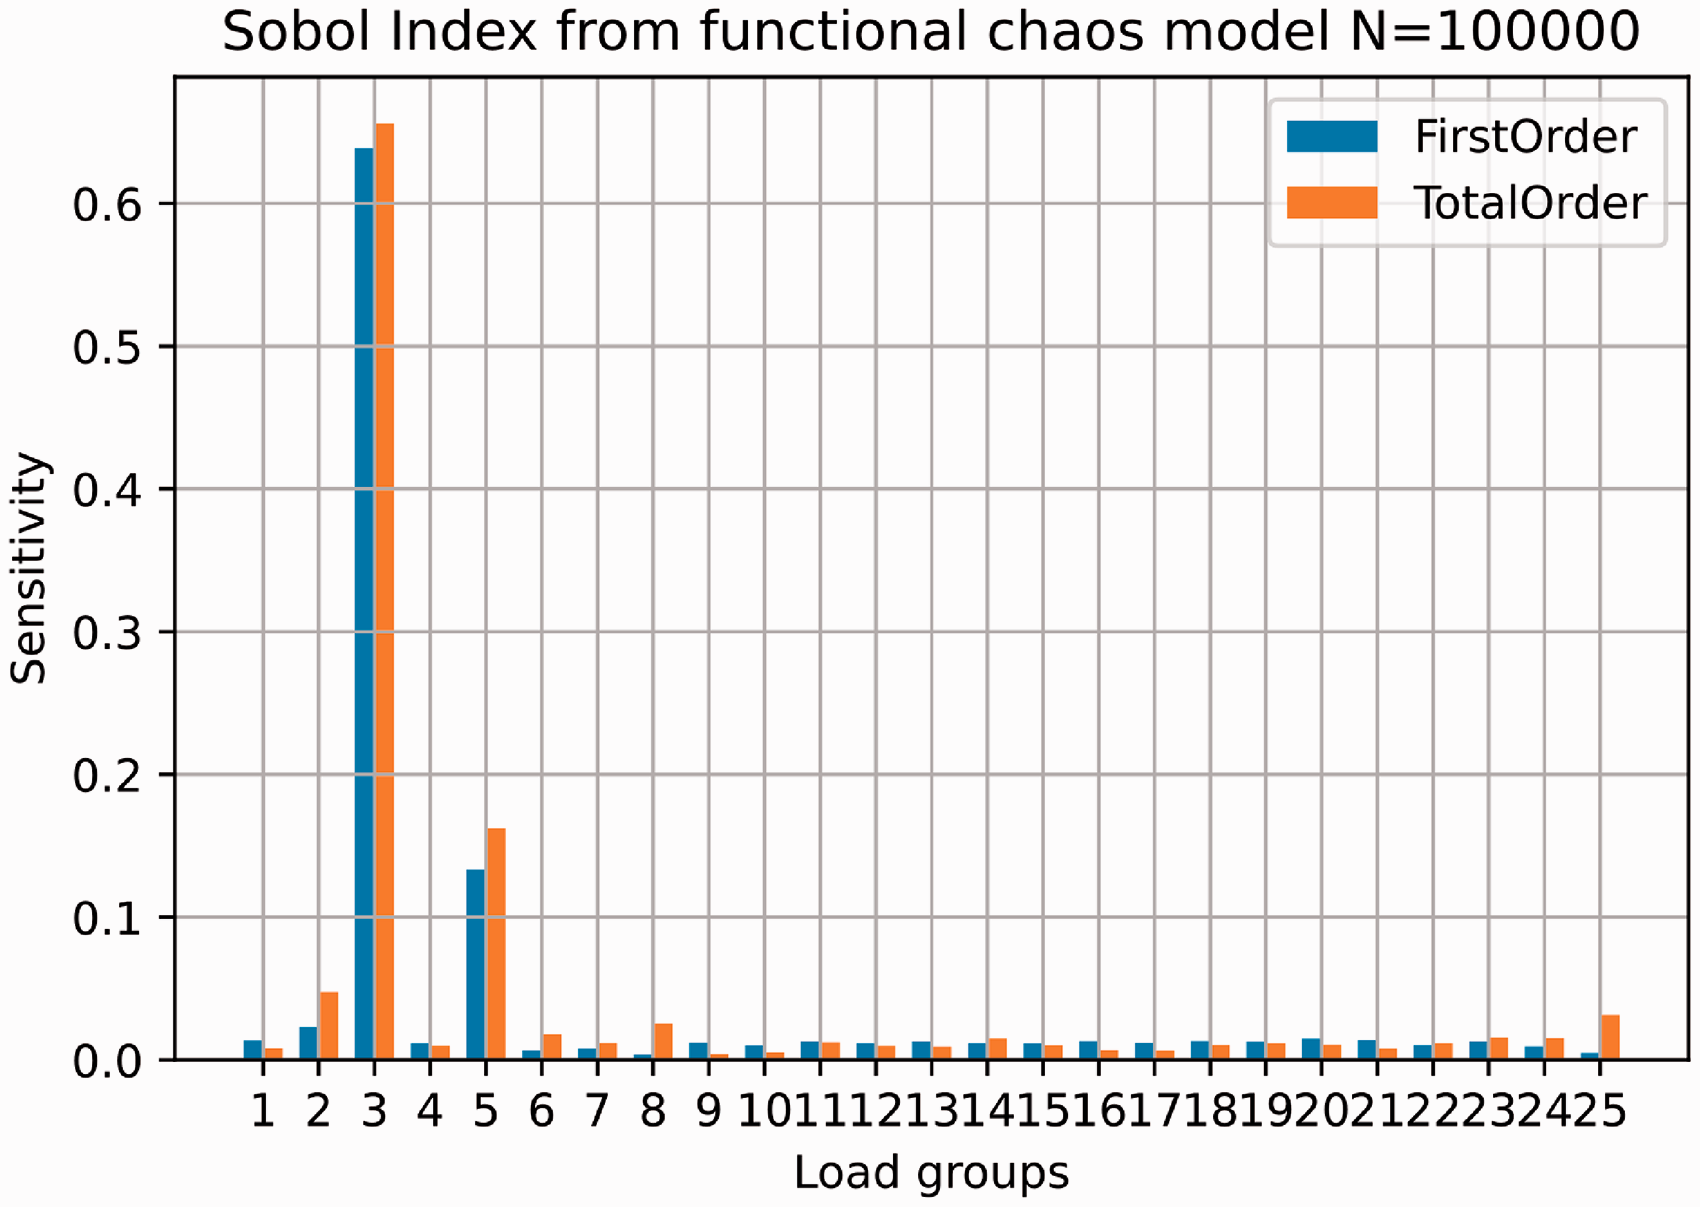
First and total order Sobol indices of the input parameter groups obtained from the polynomial chaos model.
Sensitivity analysis for operating conditions
The loads acting on the car body are the result of the vehicle dynamic reactions and depend on the track layout, the track irregularities as well as the masses and suspension parameters of the vehicle. The influence of these operating parameters on the damage is analysed using statistical values per track section. Longitudinal dynamics, aerodynamics, crash cases and maintenance operations also lead to loads, but are not analysed in this study.
Influence of the track irregularities and the track layout
The track geometry, the load spectra and the resulting damage are evaluated per section of 300 m length as illustrated in Figure 10. The track layout is described by the mean values of the curvature, the cant and the variation of cant. The track irregularity parameters are represented by their standard deviations. Additionally, the passages of switches are considered as localised damage sources.
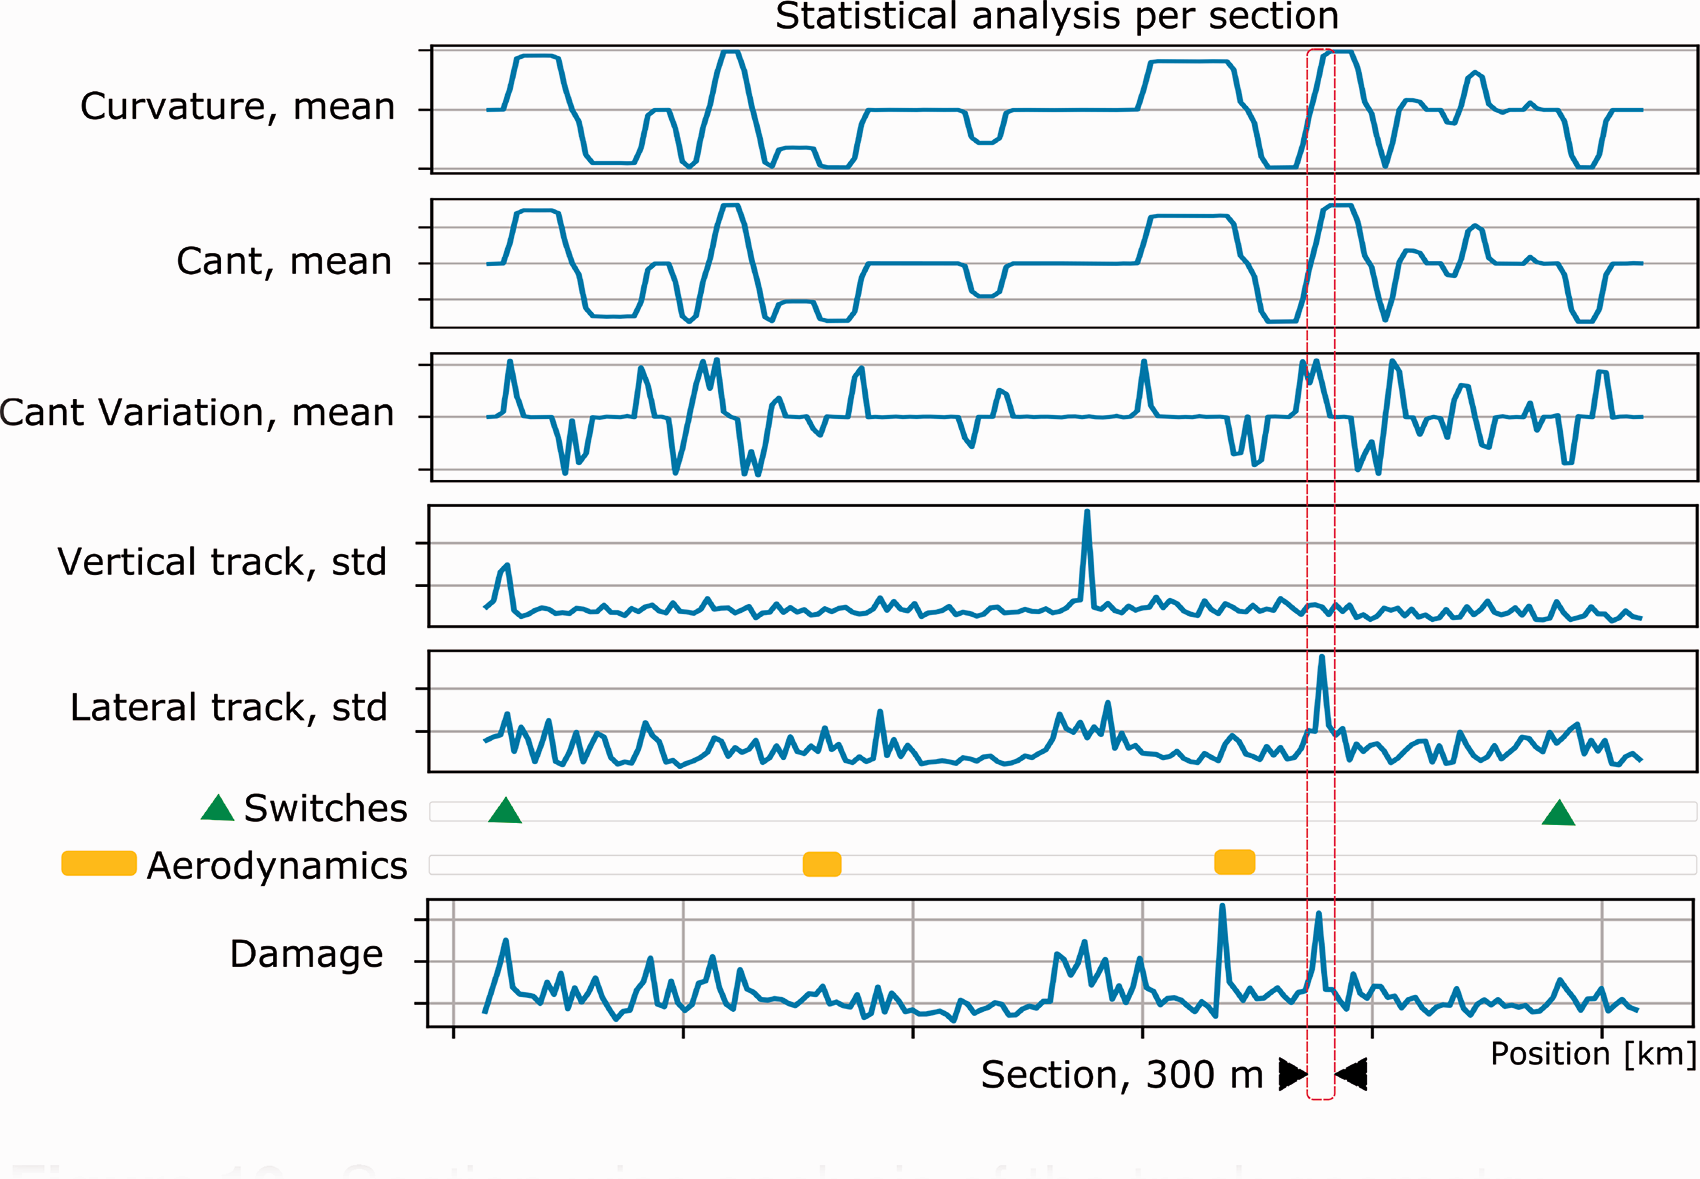
Section-wise analysis of the track geometry parameters and the associated damage for 50 km of high-speed line.
In order to understand the effect of the 7 independent track geometry parameters (mean value of curvature, cant and cant variation as well as standard deviation of the longitudinal levels and alignment per rail) on the damage, possible linear and nonlinear relations are sought.
The multi-linear regression between the track parameters and the damage gives a low correlation of
From the scatter plots between the track parameters and the damage for the 168 sections distinct effects of the vertical track geometry and the cant variation are observed in Figure 11. This is in accordance with the decisive influence of the vertical air spring loadgroups 3 (left side) and 5 (right side) of Table 1.
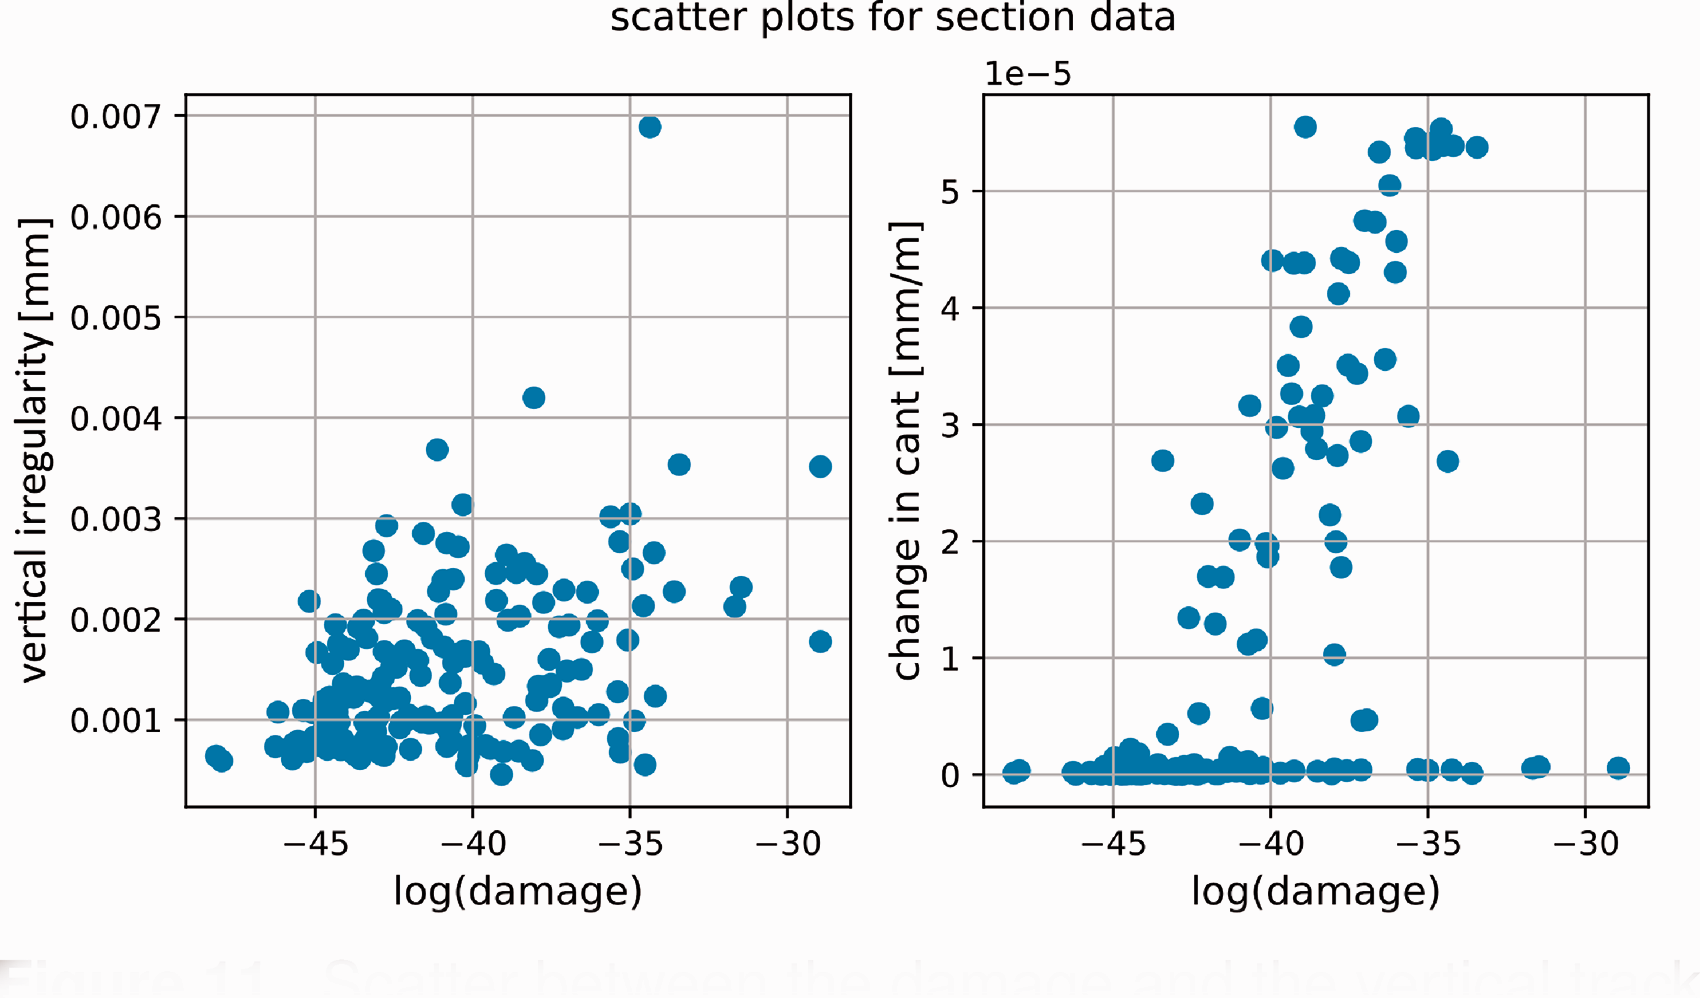
Scatter between the damage and the vertical track geometry (left) and the cant variation (right).
Considering the results of the sensitivity analysis for the loads, the observed low correlations are supposed to be the consequence of the highly nonlinear vehicle behaviour, including control systems. This is confirmed by evaluating the multi-linear regressions between the statistical values of the 12 load groups (Table 1) and the damages per section. The determination coefficients R2 have been analysed for the standard deviation, maximum value, mean value and the number of peaks per section for the load-time signals.
It is found that the standard deviations explain the damage widely with a determination coefficient of
In coherence with the first sensitivity analysis, the dynamic loads determine the damage. Their statistical influence is given for the load groups by the standard regression coefficients in Figure 12.
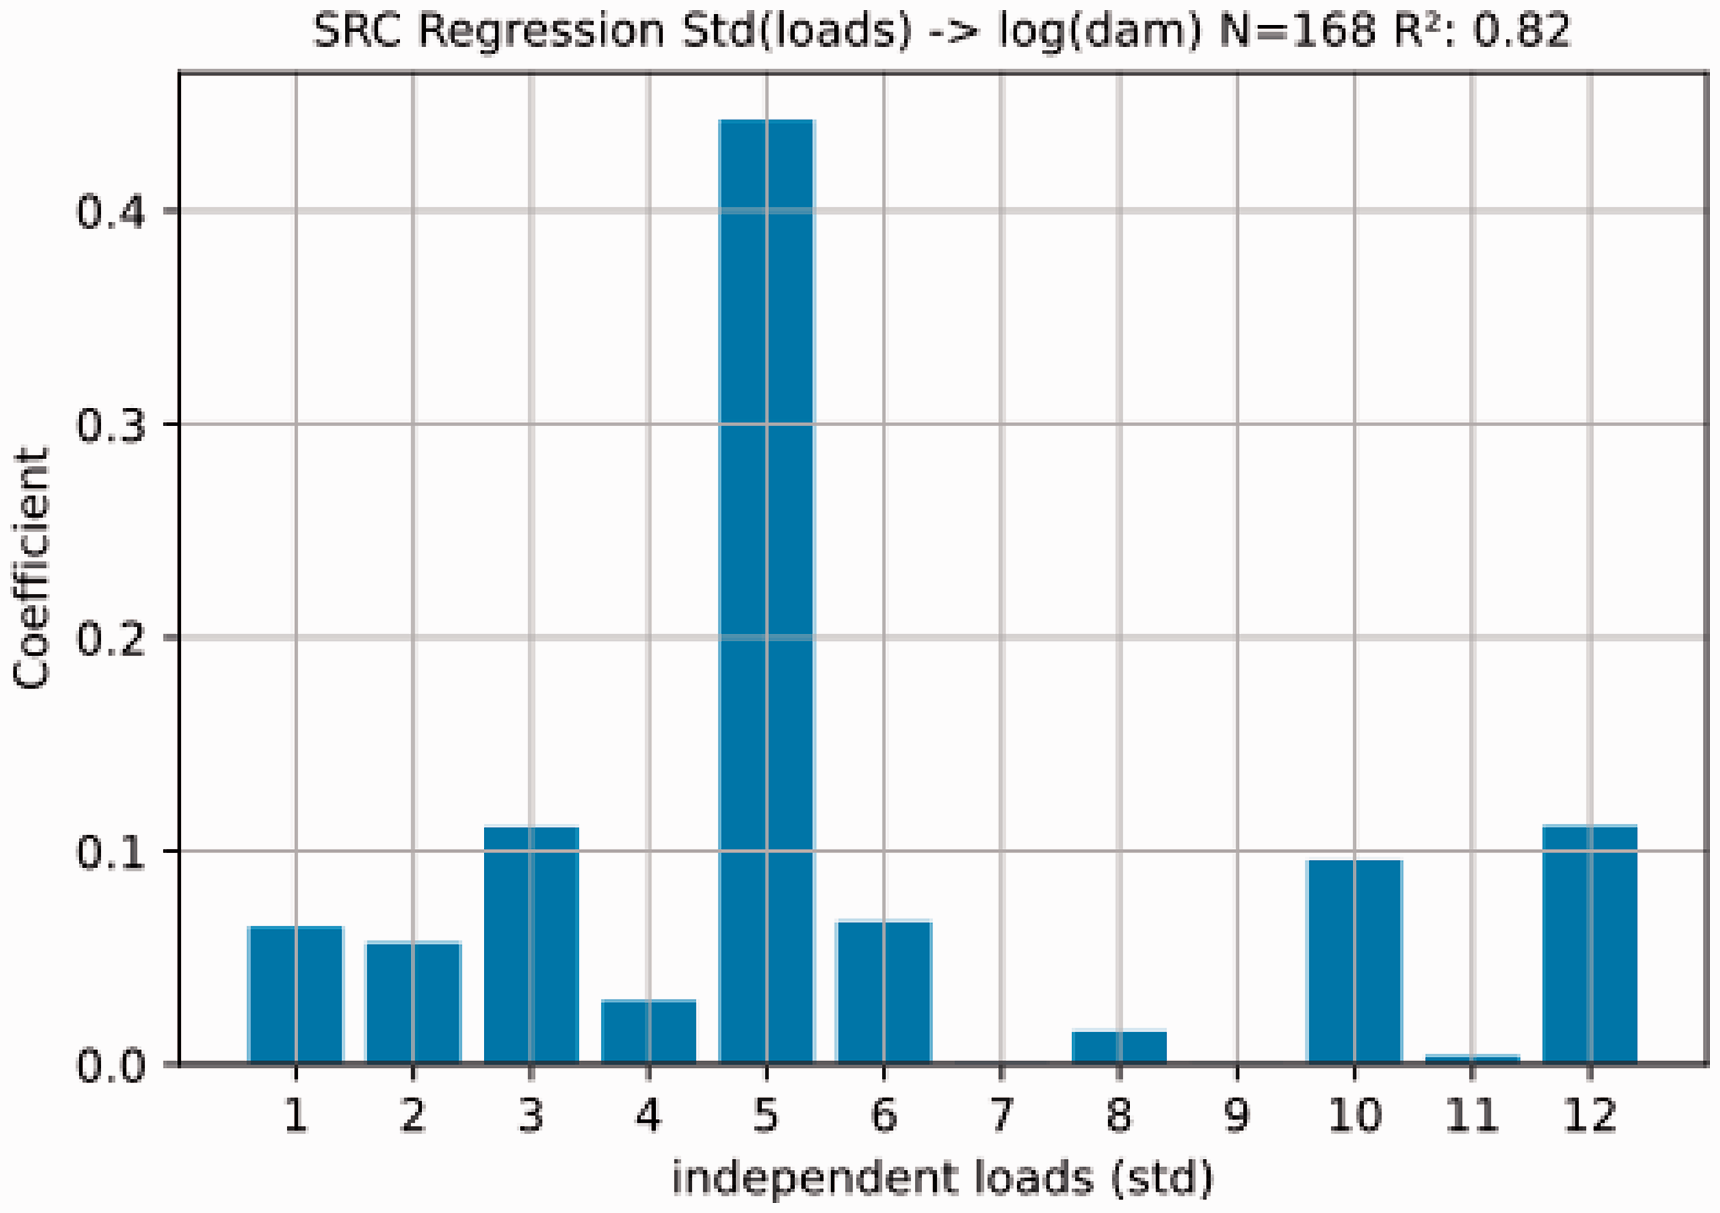
Standard regression coefficients (SRC) between the standard deviations of the dynamic load groups and the log(damage) per section.
Considering the required number of samples for training and validating the meta-models according to Figure 8, more track section data have to be obtained.
In conclusion, the results indicate the requirement of MBS models for a reliable load computation. Even though the relatively small number of samples prevents the training of non-linear meta models, the regression analysis shows, that the complexity of the vehicle-track system, in particular the strong nonlinearities of lateral vehicle dynamics, impede meta modelling approaches.
The variability of the statistical track geometry parameters and resulting damages per section, including values between
By using track sections for the design process, which reproduce the statistical properties of the operated network, simulation-based life span estimations can be performed by extrapolating the number of sections and superposing their damage effects. By modifying the distribution of section properties, effects of uncertainties in operating conditions e.g. the track quality level can be studied. Future work therefore aims at classifying track sections with respect to the geometry parameters and damages using clustering methods, thus providing a reference data base for the creation of the load collectives.
Conclusion and perspectives
For a reliable simulation-based fatigue design, the influence of loading and structural parameters on the life span is of crucial interest. Relevant parameters can be put in the focus of calibration and validation tests and uncertainties propagated through the system, allowing the estimation of failure probabilities.
In this work, sensitivity analyses have been applied for evaluating the influence of load parameters on the damage of the NGT car body. Two aspects have been studied: the influence of coupling forces acting on the car body and the influence of the track geometry
With the first approach the contributions of the coupling elements to the damage on the car body structure have been evaluated. It was found, that the vertical air spring forces, the lateral dampers and bump stops as well as the material properties have a significant impact. Based on the observed global sensitivities, the effects of design changes and uncertainties can be considered in the further design process.
The effect of operating conditions, focussing on the track geometry, was evaluated in the second step. The reliable representation of the operation conditions and their variability forms the basis for estimating the lifespan. The sensitivity analysis revealed the possible damage estimation using meta-models and available load-damage datasets for their training and validation. However, due to complex vehicle behaviour MBS modelling is currently required for computing the loads on the car body.
The significant variation of the loads and resulting damage outlines the importance of reliable input parameter distributions in the design process. Numerous uncertainty sources need to be considered: Track geometry quality, which can vary significantly Variable mechanical properties of the vehicle e.g. suspension elements, influencing vehicle dynamics Variable loading of the vehicle (vertical load) Variable material and weld properties
The process described in this work allows the systematic analysis of these influences. The aim of ongoing work is to quantify these uncertainty sources and to calibrate relevant input parameters using component fatigue tests. Since damage appears first in welds, in particular the calibration of weld geometry parameters is sought. Uncertainties due to modelling assumptions will be studied in more detail as well. By this, a contribution to a validated modelling process and reliability analysis for fatigue design is envisaged.
Footnotes
Declaration of Conflicting Interests
The author(s) declared no potential conflicts of interest with respect to the research, authorship, and/or publication of this article.
Funding
The author(s) received no financial support for the research, authorship, and/or publication of this article.