
Abstract
Theoretical thermal analysis of the barned livestock environment affords owners the opportunity to explore process efficiency, energy substitution and animal response ahead of costly and time-consuming field trials. In this article, a thermodynamic model is developed and experimentally validated against a homogeneous, cage-free, single-storey broiler barn. The simulation predictions agree well with the experimental results. The average root mean square error is 5.8% for the temperature prediction and 6.3% for the humidity prediction. The model further allows assessment of heating and ventilation efficiency, demonstrating the significant energy savings available to insulated barned structures, with such efficiency measures recommended ahead of any consideration for energy substitution.
Keywords
Introduction
Broilers (meat poultry) are commonly raised in barn, with short growth cycles suited to the closed barn environment. In an energy-intensive process, modern broilers grow to exceed 2 kg live weight in 35 days, 1 while refinement of genetics continuing to accelerate grow rates. 2 Bird weight is the primary determinant of a bird’s thermo neutral zone (TNZ), with faster growth rates requiring proportional increases in ventilation and barn energy demand. 3 Accordingly, historical broiler performance (growth and energy consumption) offers limited reliance of future performance.
Broiler chicks enter the barn environment as juvenile, 0.05 kg live weight, day-old chicks. Day-old chicks are introduced to a partitioned barn (brooding) environment to accommodate both their size and demand for supplementary heat. Such partitioning improves homogeneity during brood, with a homogeneous distribution assumed within the presented model. Brooding commences with an ambient barn temperature of 31°C, with temperature subsequently reducing by approximately 0.5°C per day. As the birds become able to self-regulate, the temperatures stabilise around 21°C. Brooding continues for between 4 and 11 days until the full barn span is made available to accommodate the larger birds. Around this juncture, a transition occurs as the process moves from endothermic to exothermic. Early broiler life is thus characterised by a large heating demand, with late broiler life characterised by a significant ventilation demand.
Feed and water are introduced into the barn ad libitum. Organic litter is spread as a bedding material across the barn floor, with excess water, largely from the poultry excrement, absorbed within this layer. Typical stocking densities of around 10–20 birds per square metre permit the litter to be maintained for the entire flock duration. The moisture content of the litter is an important measure of poultry welfare, with excess moisture promoting ammonia production and associated poultry illnesses. 4 Significant moisture is also returned to the system via respiration, with 70%–80% of water consumed returned via either respiration or excretion. 5 Accordingly, the ventilation cycle establishes a minimum ventilation rate, irrespective of internal temperature, to regulate the internal relative humidity for the control of barn moisture. Chickens are extremely sensitive to changes in their environment, in part given their relatively small body mass, with suboptimal ventilation risking whole flock mortality. 6
Modern broiler barns adopt high stocking densities, with broiler farms increasingly reliant on ventilation and heating of the barn to ensure acceptable bird welfare and development. 7 For this reason, ventilation and heating control represent the largest energy demand on the broiler farm. A typical 2 kg broiler can generate 10 W of sensible heat, with approximately 80% of this value retained within the barn. 8 Escalating energy demand within the broiler farm is the problem statement considered in this article. A barn thermodynamic model is presented to facilitate determination of the optimal barn design. From such a baseline, future work may explore alternative barn architectures, fuel sources and a move towards precision livestock farming. 9
Existing research
Numerous aspects of broiler incubation, physiology, breeding, nutrition and response continue to be studied in detail,7,10,11 with less examination afforded to energy efficiency. Research modelling the broiler environment includes McKibbin and Wilkins, 8 who define a whole of barn modelling methodology; Timmons et al., 12 who establish an improved time integrate temperature control approach and Kettlewell and Moran, 13 who explore individual bird response in confined crates. This article adds to such existing research to approach modelling from a heating and ventilation efficiency perspective (new). As with previous approaches, modelling complexity is avoided for ease of implementation. It is intended for this research to bridge the divide between agricultural science and engineering, providing a foundation for consideration of improved heating and ventilation control, improved barn design, poultry litter processing and renewable energy integration.
Materials and methods
While a number of barn designs exist, this article focuses on single-storey cage-free architecture. Barns are typically cost optimised structures, constructed with consideration for local materials to suit the site environment. Barns typically adopt long and narrow stud frame constructions to facilitate tunnel-derived air movement/exchange and have historically been afforded little insulation. Floors can be either compacted earth or concrete slab, while pitched corrugated steel roofs are common.
Heating sources within the barn include the broilers, the heating system and the barn lighting. The heating system may adopt hot water piping, hot air blowers, gas burners or a combination of each. Ventilation sources are classified as either natural or forced. Natural ventilation systems use cross-flow ventilation to regulate the barn environment. Forced ventilation systems typically adopt a negative pressure gradient to draw air into the barn, while large exhaust fans expel air from one end (Figure 1). Given the higher degree of control afforded to forced ventilation schemes, moves to industrial scale agriculture have generally adopted forced ventilation solutions. Such trends have served to increase the energy demand, and subsequently the energy cost per barn, with increased expenditure on barn efficiency and automation becoming justified through high stocking densities. This article considers only force-ventilated systems.

Barn heat flows with an overview of the heating and ventilation control logic.
Thermodynamic model
A thermodynamic model was developed for a single-storey broiler barn. The external barn environment was represented by the site meteorological record, measured at a resolution of 10 min averages for wind speed, wind direction, temperature and relative humidity. The broilers mass (Mt) (growth and correlated parameters) was approximated by the Gompertz curve (equation 1) adopting B = 0.04 and d* = 39, 7 where d is the age of the broiler and d* is the age of the broiler at mature weight (Mm). The unit for both d and d* is days

Metabolic energy, ME, was calculated using equation (2), developed by Sakomora et al., 14 as representative of data reported by McKibbin and Wilkins 8

To approximate barn moisture flow, 75% of the broiler water intake is assumed returned to the environment.6,8 Half of all moisture returned to the system is liquid (manure) and half is vapour (respiration). The rate of water supplied to the barn, qwater (mL/h) is calculated using the theory developed by McKibbin and Wilkins 8 as in equation (3)

where F refers to the flock size, 18,600 for the shed under consideration.
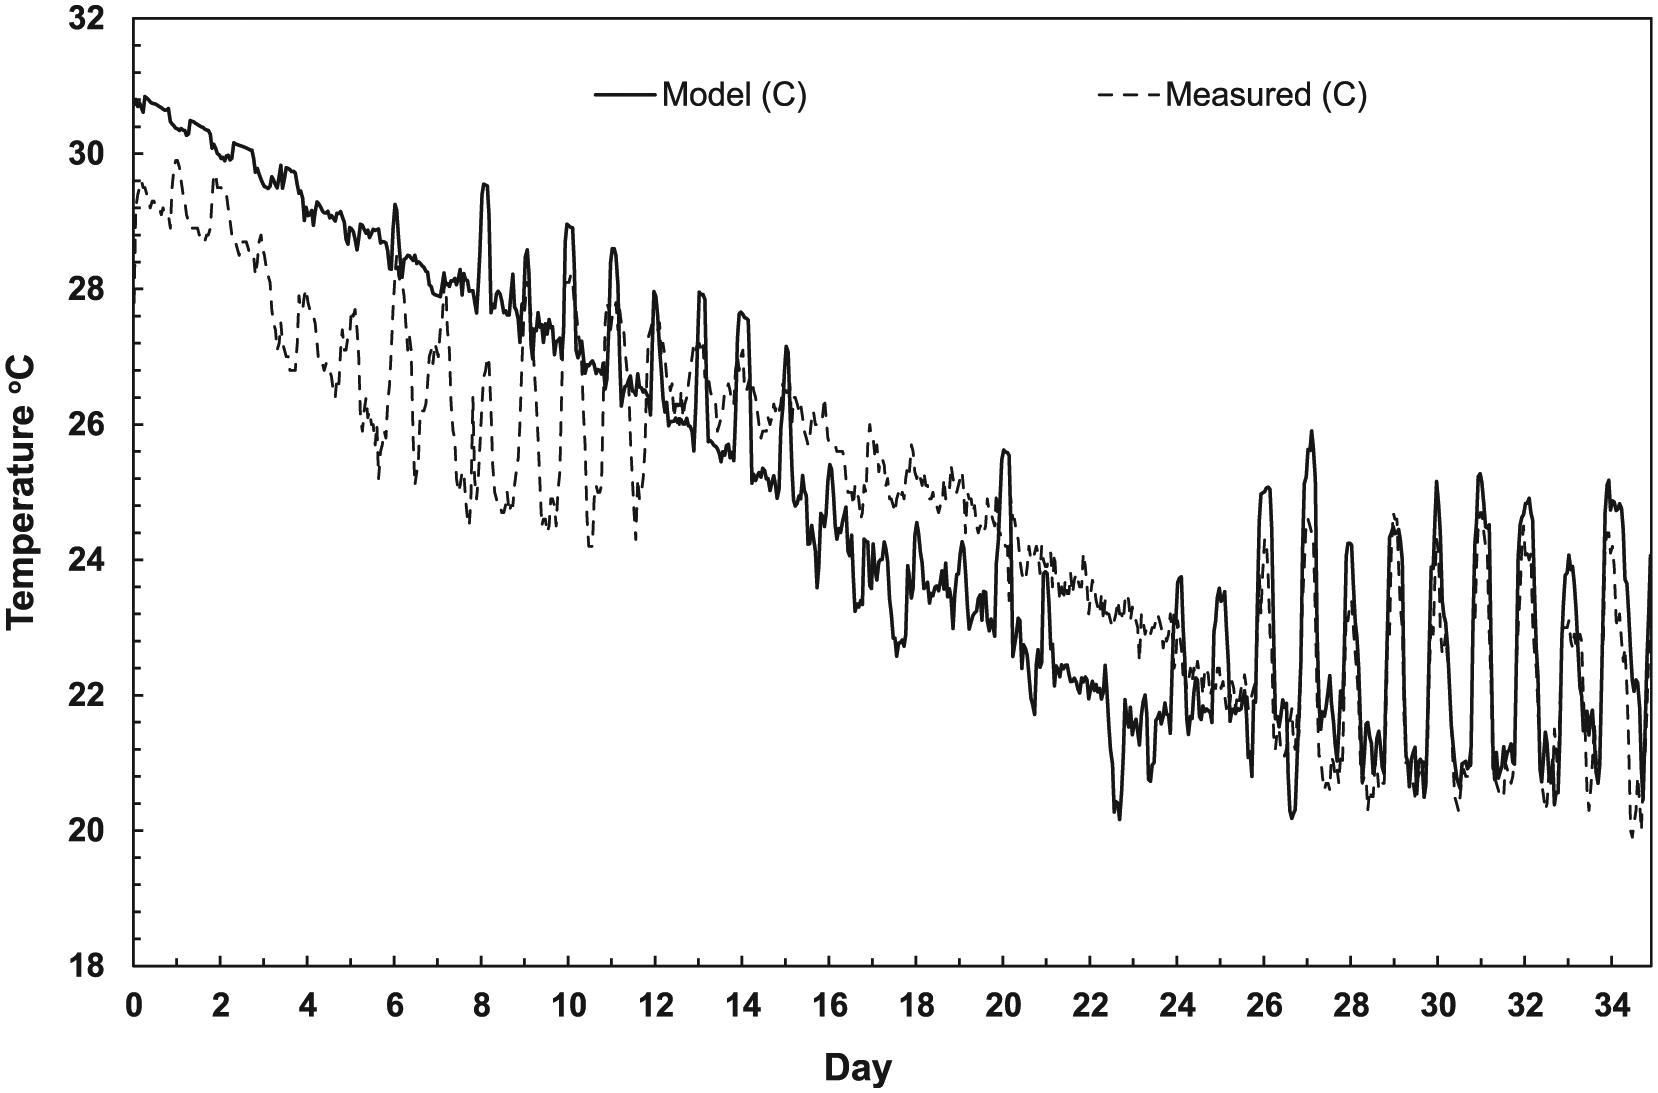
Approximations of the building heat loss, broiler growth rates and system moisture balance allowed consideration for the internal barn temperature and humidity. The model assumes both air and water vapour as ideal gases, with the barn environment at atmospheric pressure. The external dew point temperature (DPT) is represented as defined by McNoldy. 15 The relative humidity (RH) of air can be calculated from the DPT and the air temperature according by the following
The empirical fit of saturated vapour density (ρsat) versus air temperature is represented in equation (5)

where a = 0.32321, b = 8.1847 × 10⁻³ and c = 3.1243 × 10⁻⁴.
The saturation pressure (Psat) of water vapour in moist air varies with the temperature of the air vapour mixture and is expressed in equation (6)

where T is the dry bulb temperature of the moist air (K).
The humidity ratio (ω) is expressed with the partial pressure of water vapour in equation (7), where Pa and Pv represent the atmospheric pressure and partial pressure moist air, respectively

Heat loss or gain, Q, is the sum product of the broiler heat output, Qbroiler minus the sum of convective building loss, Qbuilding added to latent heat of vaporisation (hfg) for the available water, shown in equation (8)

Temperature rise ΔT is the heat loss or gain with consideration for the specific heat (Cp) and density (
Considering the ventilation and heating schemes, Figure 2 assumes that the ventilation system is triggered when the barn temperature exceeds TNZ plus a dynamic margin, or as defined by the minimum ventilation frequency required to exchange stale air. Minimum ventilation duration and frequency are defined according to the age of the broilers, with additional ventilation cycles permitted as the broilers age. The minimum air change is approximately half the barn volume per hour. As for barn heat contribution, this is assumed to be uniformly distributed across barn. The barn heating rate is variable and dependent on the difference between the set point and the measured internal temperature.

Modular components of the thermodynamic model.
In order to validate the thermodynamic model, a measurement campaign was conducted within a single-storey broiler barn during a 35-day growth cycle. The single-storey broiler barn, adopted a stocking density of ∼15 birds/m2, represented in Figure 3. Within the barn, a measurement grid of temperature and humidity sensors was deployed to define the internal environment.

(a) Internal barn site environment, feed and water lines run into the distance, and (b) typical sensor configuration. The low density clearing evident at foreground is a result of the barn door opening; at other times, a homogeneous density is assumed.
The temperature and humidity data loggers returned an accuracy of ±0.21°C and 2.5% for temperature and relative humidity, respectively. The temperature and humidity sensors were installed at broiler level onto the feed line tubing. Four motor on/off (change of state) data loggers were also deployed across the four 0.75 kW ventilation fans.
Results and discussion
Temperature measurements
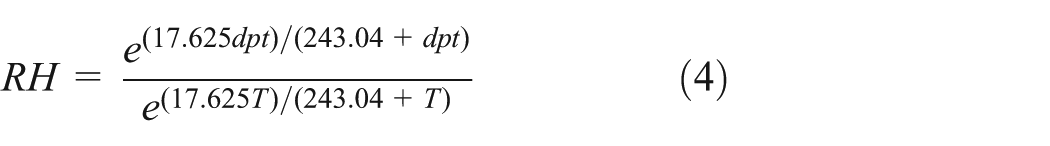
Figure 4 shows the measured external weather and internal barn temperature (averaged over all relevant sensors) during the broiler growth cycle. The external weather fluctuates from 5°C to 15°C, while the barn temperature varies from 20°C to 31°C.
Averaged internal and external temperature profiles as measured over the duration of the growth cycle.
A strong diurnal trend is evident within the external weather record, while a similar trend can be observed, during periods of high ventilation, across the internal temperature record. Accordingly, external temperature is a key driver to both the temperature and heat energy requirements of the barn. A higher correlation between the external and internal temperatures was observed during periods of higher ventilation (with more external air introduced into the barn). Periods of high ventilation occur towards the end of both the brood and growth cycles.
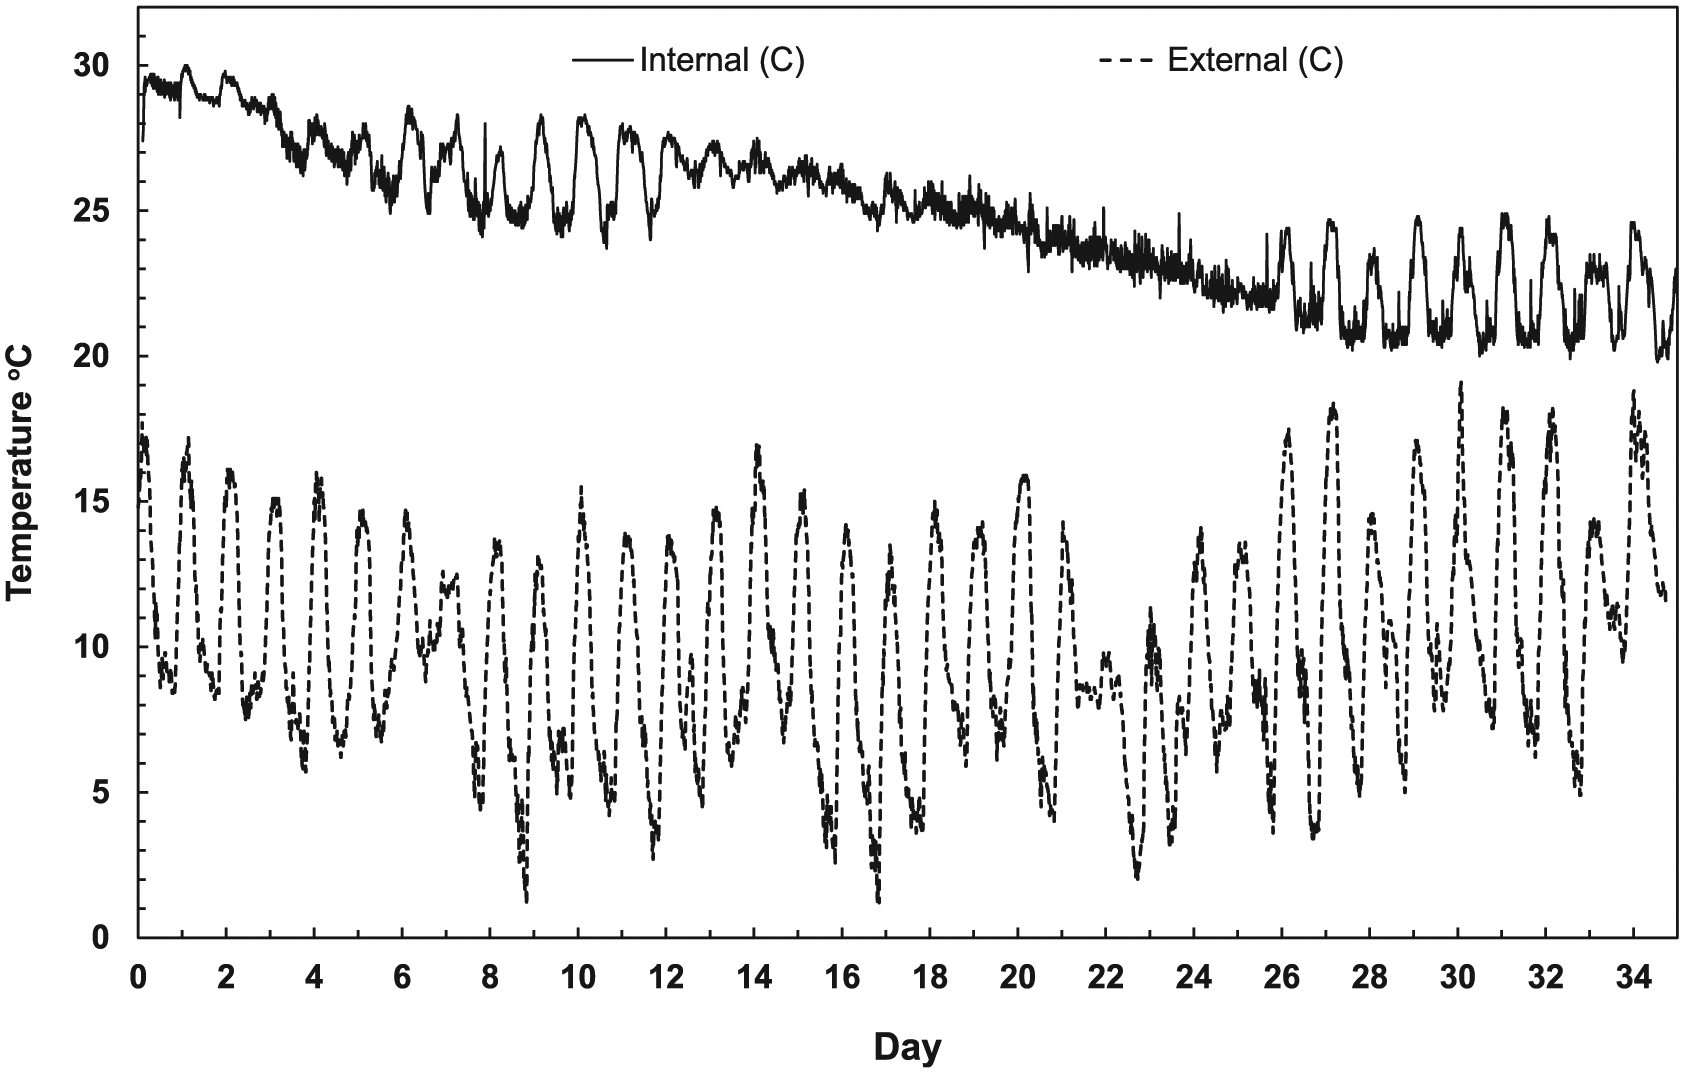
Across the brood cycle, the barn environment is endothermic, consistently sitting below the target temperature set point as shown in Figure 5 (TNZ is ±0.5°C). As the birds gain both bulk and feathers, the requirement for heat gradually decreases. Ventilation is thus kept to a minimum early in the brood cycle to conserve heat (note towards the end of the brood cycle ventilation rates peak). As the barn transitions from the brood cycle (day 7), the heat balance shifts to exothermic. Two significant milestones represent peak ventilation load, first during the transition from brood (day 7), then subsequently associated with ventilation load immediately prior to harvest (day 35).
Temperature set point (TNZ) used to control the heating and ventilation schemes within the barn. TNZ is ±0.5°C either side of the mean value shown.
Humidity measurements
Figure 6 shows the measured external and average barn relative humidity during the growth cycle. It is clear that the external relative humidity range is much larger than that in the barn, given the barn is a controlled environment.

Maximum internal and external relative humidity profiles as measured over the duration of the growth cycle.
Ventilation is used to control the barn’s humidity levels, with the observed humidity range sitting between 40% and 90%. Peak humidity occurs immediately prior to raising of the brood curtain (day 7). Relative humidity is inversely proportional to temperature, generally peaking overnight to coinciding with the daily minimum temperature.
Model results
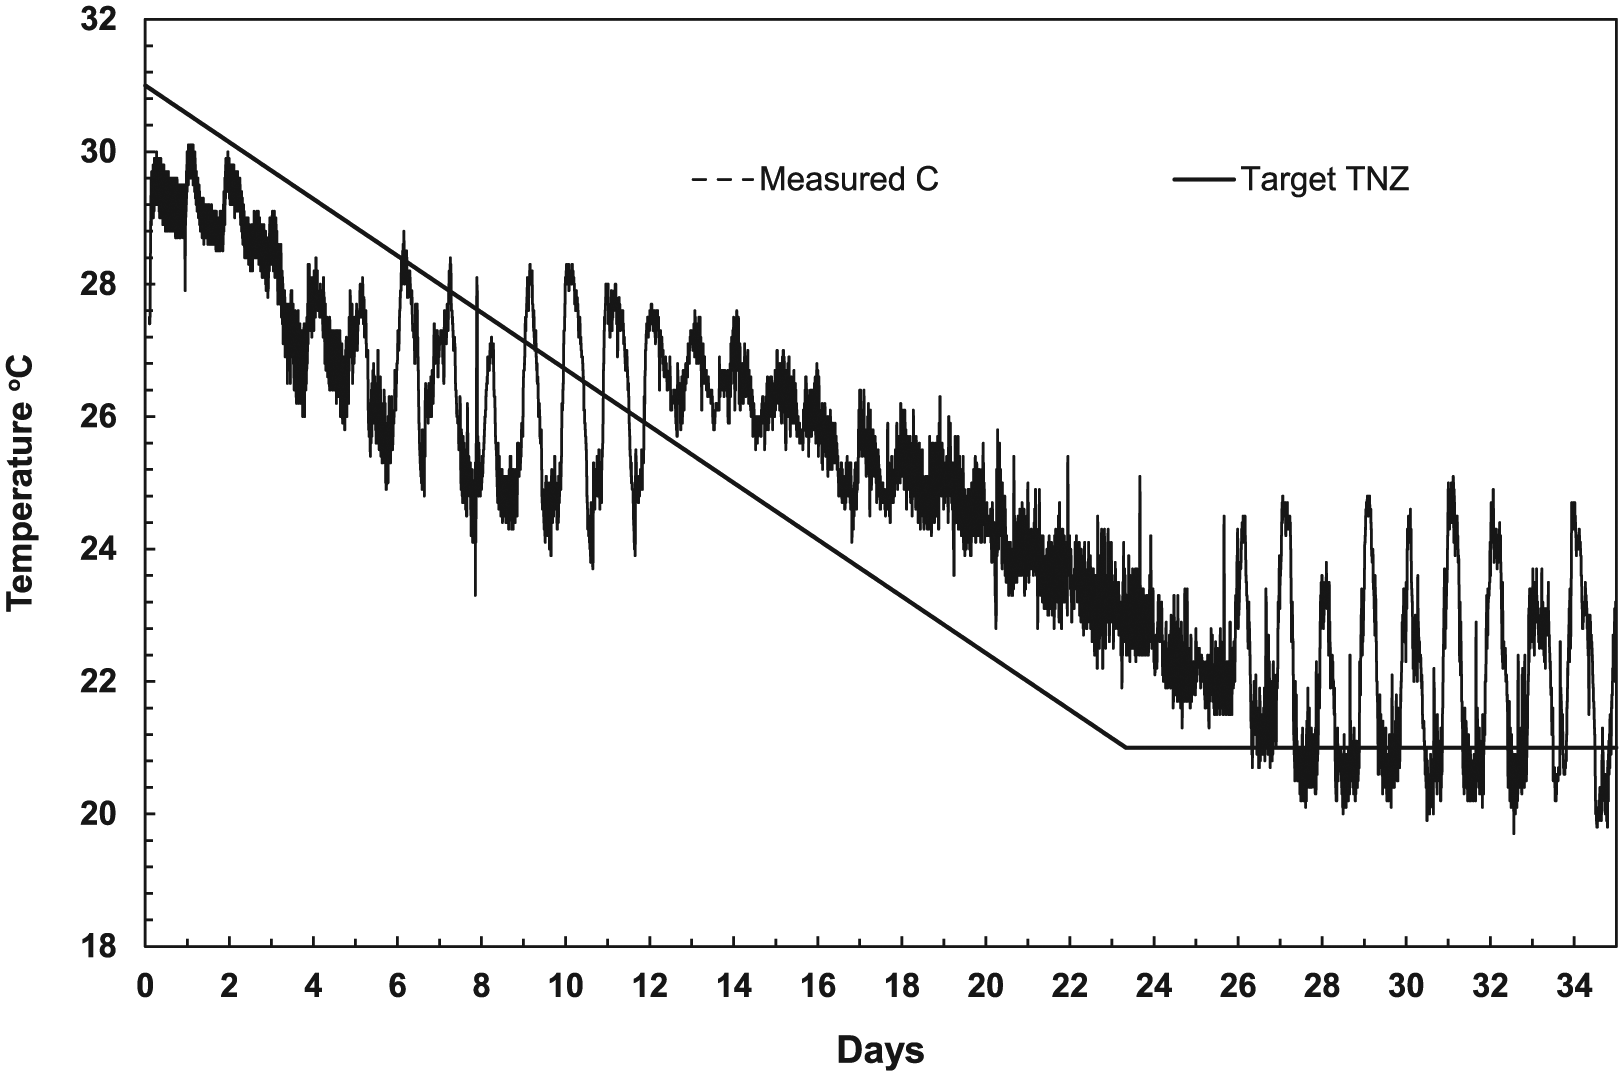
The presented thermodynamic model provides a simulated environment from which to base decisions around optimal energy use within the barn. Key measured parameters of barn temperature and relative humidity were used to validate the model across the full growth cycle. The modelled temperature profile, Figure 7, provides a good representation of the average measured temperature. While the model output appears to introduce a positive temperature bias (model high) during the brood, and a negative temperature bias (model low) post-brood, in reality, the early temperature bias is a result of heat loss to the non-brood side of the barn, with only a plastic divide separating the two. The later temperature bias is also likely to result from adjustment of the set point temperature, as routine practice during the growth cycle.
Hourly averaged modelled and measured barn internal temperature. An average root mean square error of 5.8% results from the modelled temperature profile.
Assessment of the modelled relative humidity output is presented in Figure 8, with the model providing good representation of the measured relative humidity. It is apparent from the comparison that the modelled output underpredicts the barn’s internal humidity as the barn transitions from brood (with the full barn area available to the flock). Importantly, the model sufficiently represents the peak humidity environment, which is of critical concern to the farmer.

Hourly averaged modelled and measured barn internal relative humidity over a typical 24-h cycle of high ventilation load. An average root mean square error of 6.3% results. Brood transition occurs at day 7.
The model provides good representation of the maximum internal relative humidity (the critical parameter of interest to the farmer); however, future refinement to the model would benefit from a focus on the brood cycle performance. The current model considers the brood cycle via manipulation of the broiler density. Deviation between the model and measurements has been partially attributed to energy transfer between the brood and non-brood sections of the barn, not considered within the simulation.
From Figures 7 and 8, it is apparent that the modelled results are in general agreement with the experimental data. Using the root mean square error (RMSE) to define the deviation between the measured and predicted data, the average RMSE for temperature and relative humidity is 1.4°C (5.8%) and 6.3%, respectively. The resultant error validates the barn thermodynamic model for thermal evaluation.
Heating load
Using the developed temperature and humidity model, the accumulated heating load (the thermal energy input to maintain TNZ) within the barn environment can be generated and assessed. Given variation to the insulation properties of the barn, a comparison of insulated and uninsulated barn structures can be undertaken, as displayed in Figure 9. For the scenario’s considered, insulation to the barn reduced the heat load by 60% over the 35-day cycle. Given such a heavy heating reliance, particularly during the brood, adoption of insulated barn structures holds the potential to significantly reduce the fuel usage.

Accumulated heating load (GJ) over the duration of the flock cycle for an uninsulated and insulated barn structure.
Conclusion
A thermodynamic model was developed to investigate brood humidity and barn mean temperature. The model was experimentally validated via measurement of a single-storey broiler barn. The predictions agreed well with the experimental data, to the extent that the model could be reliably used to analyse the thermal performance of the broiler barn. However, in contrast to previous studies, assumed barn homogeneity was found to be an invalid assumption for modelling applications involving broiler response. Upon review of the measured farm data, increased investment in barn insulation is recommended to achieve significant reductions in heating demand. Importantly, validation of the barn model provides the ability to approximate the resultant energy savings, with a reduction in heating demand of over 60% available to insulated structures.
Footnotes
Appendix 1
Academic Editor: Chin-Lung Chen
Declaration of conflicting interests
The author(s) declared no potential conflicts of interest with respect to the research, authorship and/or publication of this article.
Funding
The author(s) disclosed receipt of the following financial support for the research, authorship and/or publication of this article: This work was supported by the Rural Industries Research & Development Corporation (grant no. 009570) and Nichols Poultry (grant no. 003471).