
Abstract
Factor analysis refers to a collection of statistical methods for reducing correlational data into a smaller number of dimensions or factors. In this study, factor analysis theory was used to determine the main influential factors of road traffic crashes with massive casualties. Twenty variables related to personnel, vehicles, roads, and environment were collected, and the significance of their correlations was tested for validity. A correlation coefficient matrix R was calculated, and its latent root
Introduction
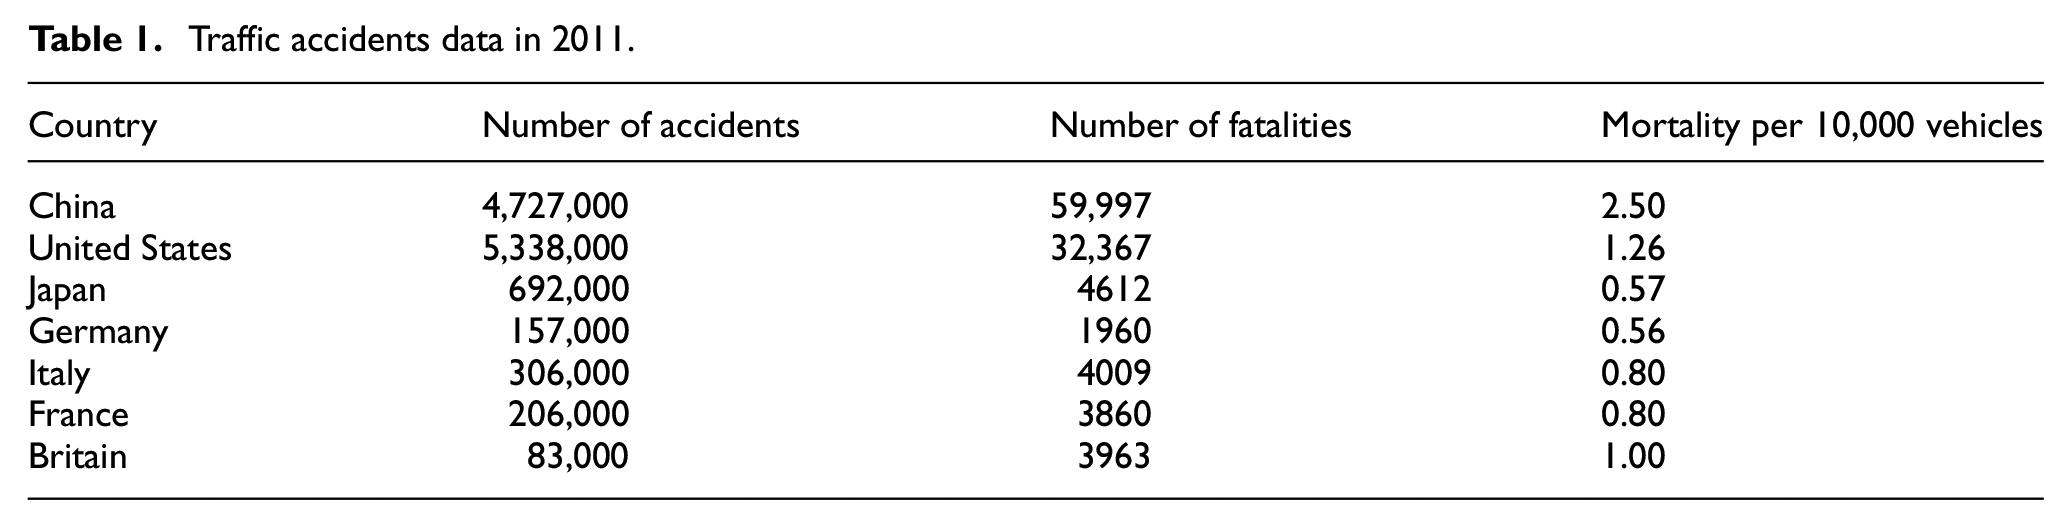
With increasing vehicle ownership in China, transport infrastructure weakness has become a growing problem, and traffic safety is very important. How to reduce road traffic accidents has become a significant issue. Road traffic accident statistics of some countries are summarized in Table 1. This table shows that the mortality per 10,000 vehicles in China is much higher than that in other developed countries. 1 Serious traffic accidents are those that involve more than 3 deaths or 11 serious injuries, cause 1 person to die or injure more than 8 persons seriously, or cause 2 persons to die and injure more than 5 persons seriously. The mortality of road traffic crashes with massive casualties (CMCs) (more than 10 deaths in 1 crash) is around 50% in China. 2 With such high mortality and serious consequences, more attention should be paid to CMCs. A CMCs database should be established to master the characteristics and distribution of CMCs accurately and put forward prevention measures to alleviate the severity of CMCs.
Traffic accidents data in 2011.
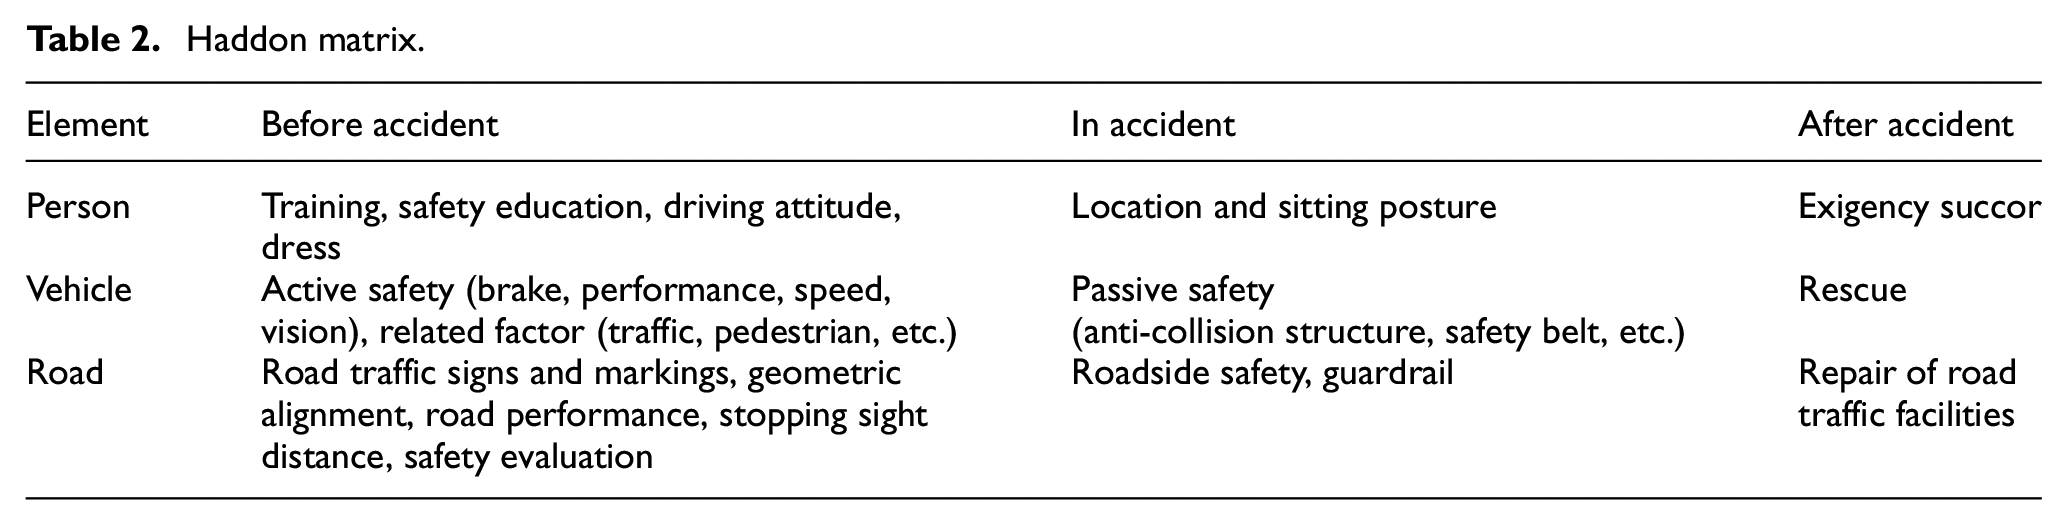
Many studies have been conducted to study CMCs, and the Haddon matrix was developed to express the correlation of driver–vehicle–road in traffic accidents. 3 The Haddon matrix is summarized in Table 2. The National Highway Traffic Safety Administration (NHTSA) established the Fatality Analysis Reporting System (FARS) to conduct in-depth analysis of accidents that resulted in a security evaluation in 1975. 4 In 1992, the Traffic Accident Research and Analysis Center was established in Japan to collect information on road traffic accidents in Japan and build a road traffic accident analysis system based on geographic information system (GIS). 5 The European Transport Safety Council (ETSC) 6 focused on the application of traffic accident data mining and determined the main influence factors of accidents since 1993; reports for the most recent 10 years were issued in 2001. In 2008, a questionnaire by Japanese scholars was completed by 1987 drivers to study the effects of driving behavior on traffic accidents. The results showed that there was a significant relationship between illegal driving behaviors and accidents. 7 Hassan and Al-Faleh 8 explored the risk factors associated with the size and severity of roadway crashes in Riyadh. The results revealed that crash reason, damage to public property, day of week, crash location, and point of collision were the significant variables affecting the binary target variable (fatal and non-fatal crashes).
Haddon matrix.
The Traffic Accident Information System developed by China’s Ministry of Public Security is used by the Traffic Police Department for road traffic accident analysis in China and has certain superficial data processing functions. 9 Ma et al. 10 reviewed four national-level data sources used to estimate the burden of road traffic injuries, including mortality, injury, and crashes in China. Zhou et al. 11 investigated road traffic safety in the mountain areas of Southwest China and suggested that the high incidence of severe crashes closely relates to imperfect road design, defective execution of traffic laws, imperfect management, and environmental factors. Wang et al. 12 developed a driver safety approach behavioral model based on driver human factors analysis to prevent rear-end collisions in car-following situations. Xu et al. 13 studied the speed distribution of mixed bicycle traffic for highway systems. Jiang et al.14,15 investigated intercultural differences of time-to-collision (TTC) distribution and relationships between TTC and vehicle–pedestrian (VEH-PED) conflicts to improve vehicle and pedestrian safety in critical situations. Pedestrian behavior was analyzed in the conflict process to reduce accident frequency and severity for pedestrians. Li et al. 16 presented an improved cellular automata model to analyze traffic congestion propagation properties to evaluate the effectiveness of traffic control strategies.
Xu 17 studied data mining methods such as correlation analysis, cluster analysis, and decision tree analysis to analyze road traffic accident data. Sun et al. 18 proposed the concept of driver safety margin and built an analytic hierarchy process (AHP) model considering causes and the influence of people, vehicles, road, and environment on traffic accidents. Cheng 19 collected traffic accident data in Kunming from 1997 to 2001 and analyzed the correlation between 11 factors and road traffic accidents; the results showed that the number of motor vehicles, drivers, and population had a significant correlation with accidents. Deng 20 put forward the concept of accident background factors and set up an index system of background factors. The background factors system of China was built based on the Oracle database.
The data mining method of factor analysis was used in this article to analyze influential factors of CMCs. A total of 250 cases of CMCs in China from 2005 to 2012 were collected to analyze the influential factors. A factor analysis model based on personnel, vehicles, roads, and environmental elements was developed, and common factors were obtained through factor analysis. The weight of common factor elements was determined by the weighted model to determine the main influential factors of accidents.
Method
Database
Fatal road traffic CMCs are discussed in this article (more than 10 deaths in 1 crash). A total of 250 accident cases from 2005 to 2012 in China are summarized in Table 3. The accident type and modality distribution of fatal road traffic accidents with massive casualties are summarized in Table 4. The percentage of single-vehicle accidents was 51.6%, and most of the accidents were dropping accidents; vehicle–vehicle accidents accounted for 32.8% and mainly were caused by frontal impact.
Data of CMC.

Relative proportion of accident type.

Basic principle of factor analysis
Factor analysis 21 is a kind of mining method aimed to study the correlation for each attribute, identify the underlying dimensions that explain these correlations, and group together the close attributes into one pattern. The attributes of each pattern are called “common factors.” The influential factors of CMCs are distributed in four aspects: personnel, vehicles, roads, and environment. Common factors were obtained through factor analysis, the weight of common factor elements was determined by the weighting model, and the main influential factors of accidents were determined.
The general model of factor analysis 22 is

where X is the observable random vector (original observed variables), F is the common factor of X, A is the coefficient of F (factor loading matrix), aij is the correlation coefficient, εi is the error factor, and B is a special factor of X. aij expresses the degree of linear relationship between the row and column variables of the matrix; the higher the correlation coefficient, the stronger the relationship. B is the special factor of X, ignore it when analyzing

Normalize the X matrix, making its mean value 0 and variance value 1. Assume F and εi are independent, the mean value is 0, and variance value is 1. X is called the factor model with m common factors. Then, the correlation coefficient matrix R = (rij)
p*p
and its latent root
Factor analysis
A total of 20 indexes of factors related to personnel, vehicles, roads, and environment are summarized in Table 5. Original data of the accident influential factors index are shown in Appendix 1.
Index of accident influential factor.

Data were normalized, and the correlation was analyzed before factor analysis. In the analysis of correlation, if most of the coefficients are larger than 0.3 and pass the correlation test, the results of factor analysis seem to be valid.
Normalize the original data by Z-score standard method. 23 The equation is

where
The following equation is used to calculate the correlation coefficient
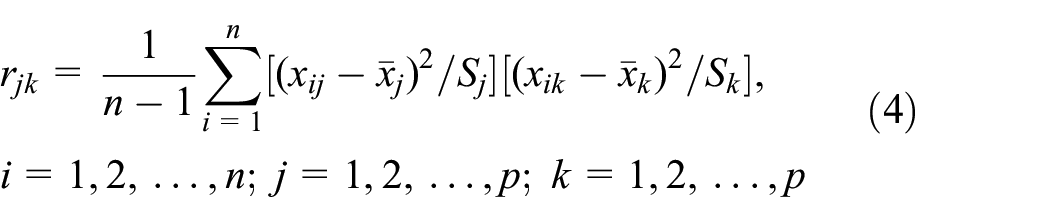

where rjk is the correlation coefficient of index, rii = 1, rjk = rkj. Correlation coefficient matrix R is shown in Appendix 3

According to characteristic equation
An index system model of CMCs influential factors based on the outcome of the rotating component matrix was built to calculate how secondary indexes rates on primary indexes, tertiary indexes rates on secondary indexes, and primary indexes. The results are shown in Table 9


where Ai is the weight value of secondary indexes out of primary indexes, n is the number of main factors, Ci is contribution percentage of main factor to primary index level, Aij is the weight value of tertiary indexes rate on secondary indexes, m is the amount of tertiary indexes in each main factor, and wj is the weight value of tertiary indexes rate on primary indexes.
Calculate the importance degree of each index based on the obtained index weight value and group the indexes into four patterns of “very important,”“important,”“less important,” and “unimportant” valued in 4, 3, 2, and 1, respectively, based on the effects in an accident. This research mainly focuses on the importance of tertiary indexes (the second layer of the factors hierarchical tree)

where Nj is the section value of the j tertiary indexes.
Classification formulas based on index importance are given by

where Tj is the importance degree of the j tertiary index.
Results and discussion
Common factors
Normalized indexes data from part of the cases are shown in Appendix 2. Appendix 3 shows the correlation coefficient matrix of the index data, and we can see that most of the matrix coefficients are higher than 0.3.
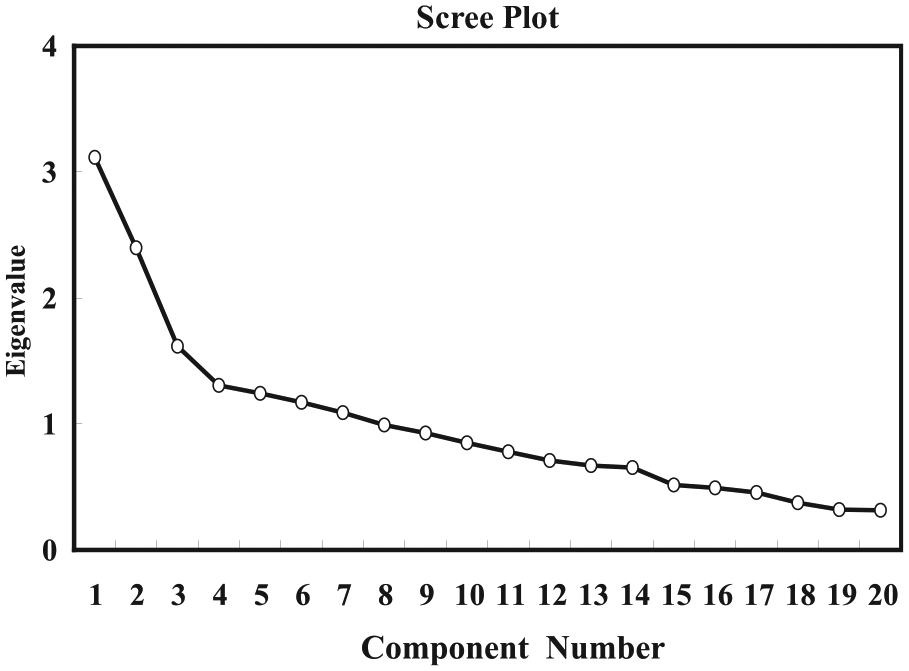
The explanation of total variance is shown in Table 6. We can see that there are seven factors whose latent root is not less than 1; thus, seven common factors were obtained. The scree test is shown in Figure 1, and we can see that the curves become smooth after the seventh point. Therefore, it was appropriate to select seven common factors. As X = AF, matrix A varies across the method of parameter estimation; therefore, principal component analysis was used to estimate factors. Varimax orthogonal rotation was also used to make the common factors more diffuse by factor rotation. 25 The rotational component matrix is shown in Table 7.
Total variance explained.

Characteristic value of scree test.
Rotational component matrix.
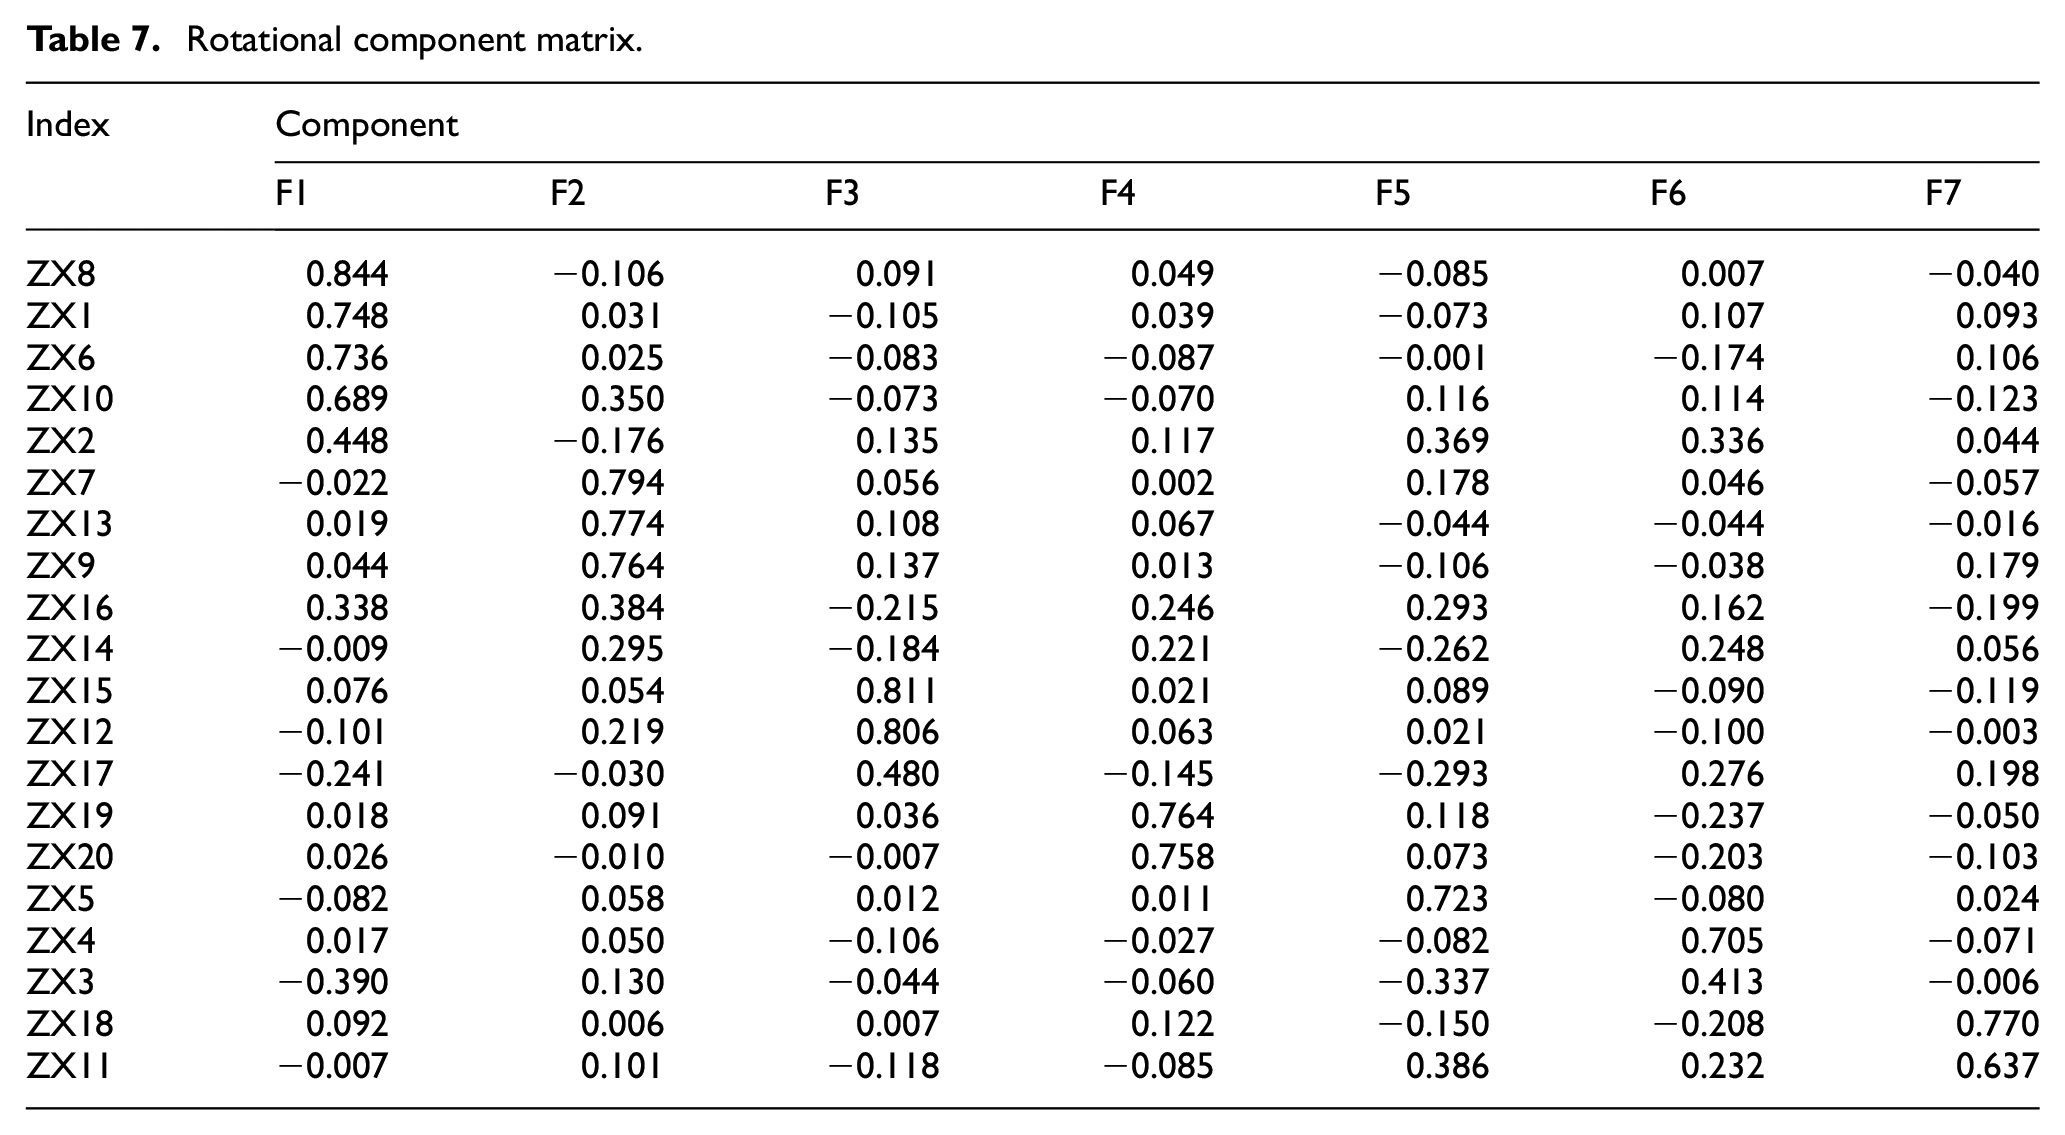
Table 7 shows that the seven common factors with which every index corresponds have a different load number. The factor of the maximum load numbers is the main factor. According to the results of the rotating component matrix, the structure of the CMCs’ influential factors was established and is shown in Table 8. The first floor is the target floor used as the first index floor, the second is the main factor floor used as the second index floor, and the third floor is the details floor used as the third index floor.
Index system of accident factors.

Factor weights calculation results
The system of CMCs’ influential factors shows that seven main factors were obtained according to the analysis of factors, and their accumulating contribution percentages are 59.703%; their values are 14.243%, 11.537%, 8.649%, 6.767%, 6.447%, 6.117%, and 5.943%. We acquired the weight Ai of second index through the first index, the same as the weight of third index, and the weight of third index through the second index. The results are shown in Table 9.
Weights of different index floors.

Results of factor importance
The index weight was calculated through the factor weight, which is shown in Table 10. Table 10 shows that the most important factors are personnel type, driving experience, and driver fault behavior. Vehicle safety conditions and purpose of vehicle are important factors for vehicles. Terrain and lighting condition are important factors for environment.
Factor weight.

The model provides factor weight values of personnel, vehicle, road, and environment. All the factors were ordered according to the rule of weight value; factors with a value of 4 or 3 are the main factors related to the CMCs shown in Table 11, where 1 refers to not important, 2 refers to less important, 3 refers to important, and 4 refers to very important.
Main influential factor of fatal traffic crashes with massive casualty.

Conclusion
This article used the analysis of 20 variables of CMCs to determine the main influential factors. According to the weight value, the main influential factors are fault behavior, driving experience, condition of vehicle safety, purpose of vehicle, road lighting, personnel type, road surface condition, roadside protection facilities, and road terrain.
Among these factors, personnel type, driving experience, and driver fault behavior are related to personnel, driver fault behavior, and driving experience, with a high weight value of 4, proving that driver is the most important role responsible for CMCs. It can be inferred that fatigued driving, speeding, and less driving experience are the main causes. Others factors, such as condition of vehicle, can infer that vehicles with safety problems such as brake fade can cause CMCs. Vehicles used for passengers or freight transport and drivers with a poor education background are more likely to be involved in CMCs. Rough surfaces and rugged terrain of roads can make it difficult to handle a vehicle and cause an accident. Dim road lighting is the main cause for night CMCs. Roads with no roadside protection facilities may have a higher CMCs rate.
This analysis of the main influential factors shows that to prevent CMCs, first, educating drivers, especially those who drive for passenger or freight transport, should be improved to reduce fault behavior and improve the driving experience. Second, vehicles should be inspected and maintained periodically to eliminate any mechanical breakdowns. Third, road surfaces and lighting conditions should be perfected, and roadside protection facilities should be implemented to improve traffic safety.
Footnotes
Appendix
Correlation coefficient matrix.

| Correlation coefficient | ZX1 | ZX2 | ZX3 | ZX4 | ZX5 | ZX6 | ZX7 | ZX8 | ZX9 | ZX10 | ZX11 | ZX12 | ZX13 | ZX14 | ZX15 | ZX16 | ZX17 | ZX18 | ZX19 | ZX20 |
|---|---|---|---|---|---|---|---|---|---|---|---|---|---|---|---|---|---|---|---|---|
| ZX1 | 1.000 | 0.256 | 0.621 | 0.772 | 0.478 | 0.402 | 0.378 | 0.721 | 0.690 | 0.367 | 0.406 | 0.556 | 0.991 | 0.365 | 0.378 | 0.298 | 0.467 | 0.496 | 0.691 | −0.389 |
| ZX2 | 0.256 | 1.000 | 0.562 | 0.367 | 0.411 | 0.521 | −0.706 | 0.490 | 0.731 | 0.692 | 0.496 | 0.307 | 0.658 | −0.489 | 0.444 | 0.571 | 0.397 | 0.662 | 0.502 | 0.481 |
| ZX3 | 0.621 | 0.562 | 1.000 | −0.211 | 0.572 | 0.598 | 0.762 | 0.821 | 0.602 | −0.554 | 0.474 | 0.503 | 0.449 | 0.630 | 0.581 | 0.388 | 0.489 | 0.770 | 0.631 | 0.550 |
| ZX4 | 0.772 | 0.367 | −0.211 | 1.000 | 0.366 | 0.788 | 0.492 | 0.551 | 0.720 | 0.833 | 0.466 | 0.910 | 0.820 | 0.599 | 0.481 | 0.637 | 0.672 | 0.811 | 0.709 | 0.766 |
| ZX5 | 0.478 | 0.411 | 0.572 | 0.366 | 1.000 | 0.554 | 0.592 | 0.737 | 0.658 | 0.440 | 0.580 | 0.433 | 0.529 | 0.641 | 0.638 | −0.692 | 0.578 | 0.829 | 0.434 | 0.541 |
| ZX6 | 0.402 | 0.521 | 0.598 | 0.788 | 0.554 | 1.000 | 0.772 | 0.824 | 0.765 | 0.683 | 0.429 | 0.478 | 0.361 | 0.542 | −0.773 | 0.429 | 0.589 | 0.678 | 0.663 | 0.673 |
| ZX7 | 0.378 | −0.706 | 0.762 | 0.492 | 0.592 | 0.772 | 1.000 | 0.286 | 0.476 | 0.775 | 0.674 | 0.772 | 0.456 | 0.463 | 0.551 | 0.893 | 0.782 | 0.397 | 0.833 | 0.782 |
| ZX8 | 0.721 | 0.490 | 0.821 | 0.551 | 0.737 | 0.824 | 0.286 | 1.000 | 0.551 | 0.458 | 0.492 | 0.770 | 0.498 | 0.588 | 0.678 | 0.323 | 0.495 | 0.664 | 0.529 | 0.558 |
| ZX9 | 0.690 | 0.731 | 0.602 | 0.720 | 0.658 | 0.765 | 0.476 | 0.551 | 1.000 | 0.677 | 0.453 | 0.820 | 0.782 | 0.699 | 0.481 | 0.321 | 0.287 | 0.445 | 0.762 | 0.558 |
| ZX10 | 0.367 | 0.692 | −0.554 | 0.833 | 0.440 | 0.683 | 0.775 | 0.458 | 0.677 | 1.000 | 0.338 | 0.769 | 0.652 | 0.477 | 0.489 | 0.580 | 0.527 | 0.668 | 0.629 | 0.881 |
| ZX11 | 0.406 | 0.496 | 0.474 | 0.466 | 0.580 | 0.429 | 0.674 | 0.492 | 0.453 | 0.338 | 1.000 | 0.592 | 0.661 | 0.739 | 0.487 | 0.524 | 0.583 | 0.763 | 0.748 | 0.553 |
| ZX12 | 0.556 | 0.307 | 0.503 | 0.910 | 0.433 | 0.478 | 0.772 | 0.770 | 0.820 | 0.769 | 0.592 | 1.000 | 0.372 | 0.469 | 0.583 | −0.477 | 0.781 | 0.685 | 0.774 | 0.674 |
| ZX13 | 0.991 | 0.658 | 0.449 | 0.820 | 0.529 | 0.361 | 0.456 | 0.498 | 0.782 | 0.652 | 0.661 | 0.372 | 1.000 | 0.772 | 0.594 | 0.755 | 0.287 | 0.466 | 0.409 | 0.588 |
| ZX14 | 0.365 | −0.489 | 0.630 | 0.599 | 0.641 | 0.542 | 0.463 | 0.588 | 0.699 | 0.477 | 0.739 | 0.469 | 0.772 | 1.000 | 0.659 | 0.439 | 0.622 | 0.478 | 0.578 | 0.543 |
| ZX15 | 0.378 | 0.444 | 0.581 | 0.481 | 0.638 | −0.773 | 0.551 | 0.678 | 0.481 | 0.489 | 0.487 | 0.583 | 0.594 | 0.659 | 1.000 | 0.773 | 0.585 | 0.542 | 0.343 | 0.663 |
| ZX16 | 0.298 | 0.571 | 0.388 | 0.637 | −0.692 | 0.429 | 0.893 | 0.323 | 0.321 | 0.580 | 0.524 | −0.477 | 0.755 | 0.439 | 0.773 | 1.000 | 0.598 | 0.676 | 0.337 | 0.462 |
| ZX17 | 0.467 | 0.397 | 0.489 | 0.672 | 0.578 | 0.589 | 0.782 | 0.495 | 0.287 | 0.527 | 0.583 | 0.781 | 0.287 | 0.622 | 0.585 | 0.598 | 1.000 | 0.369 | 0.467 | 0.664 |
| ZX18 | 0.496 | 0.662 | 0.770 | 0.811 | 0.829 | 0.678 | 0.397 | 0.664 | 0.445 | 0.668 | 0.763 | 0.685 | 0.466 | 0.478 | 0.542 | 0.676 | 0.369 | 1.000 | 0.773 | 0.659 |
| ZX19 | 0.691 | 0.502 | 0.631 | 0.709 | 0.434 | 0.663 | 0.833 | 0.529 | 0.762 | 0.629 | 0.748 | 0.774 | 0.409 | 0.578 | 0.343 | 0.337 | 0.467 | 0.773 | 1.000 | 0.884 |
| ZX20 | −0.389 | 0.481 | 0.550 | 0.766 | 0.541 | 0.673 | 0.782 | 0.558 | 0.558 | 0.881 | 0.553 | 0.674 | 0.588 | 0.543 | 0.663 | 0.462 | 0.664 | 0.659 | 0.884 | 1.000 |
Academic Editor: Xiaobei Jiang
Declaration of conflicting interests
The author(s) declared no potential conflicts of interest with respect to the research, authorship, and/or publication of this article.
Funding
The author(s) disclosed receipt of the following financial support for the research, authorship, and/or publication of this article: This work was partially supported by Science Foundation of Chinese Ministry of Transport (2015319812200), the Open Project Program of the Key Laboratory of Road Traffic Safety of the Ministry of Public Security in China (2015ZDSYSKFKT07), Chinese Universities Scientific Fund (310822162018), and Program for Changjiang Scholars and Innovative Research Team in University (IRT1286).