
Abstract
A staggered intersection is a special type of intersection in a road network. Its geographical characteristics consist of two T-legged intersections that cause the lost time per cycle to become longer than at cross intersections under conventional signal control, thus leading to low intersection efficiency. This article shows that the problem can be eliminated at the left–right type of staggered intersection by channelization and signal phasing, based on a sorting strategy and pre-signal, which reduce the amount of lost time during the signal cycle using the split distance as the sorting area. VISSIM was used to model and analyze the proposed method as well as the conventional method for comparison purposes. The simulation revealed that the proposed method reduced the average delays and maximum queue lengths in each movement and for the entire intersection, both in the peak hours and in the off-peak hour.
Introduction
A staggered intersection is a special type of intersection in a road network. Generally, a staggered intersection is made up of two T-legged intersections with a distance between them, and can be divided into two types, namely the left–right “(LR) type” and the right–left “(RL) type,” according to the order in which the driver encounters the branches when driving down the main road (LR or RL), 1 as shown in Figure 1. Two traffic flows can be discerned in the staggered intersection: one is the traffic flow on the main road, whose traffic volume is higher, and the other is that on the minor road, which is crossing the main flow of traffic.

Schematic diagrams of RL-type and LR-type staggered intersection.
A staggered intersection should not be confused with a split intersection. The latter splits a major intersection into two sub-intersections by dividing the major road into two separate roadways just before the crossroads, thus forming two smaller intersections with the crossroads, each sub-intersection having the geometry of a cross-shaped (four-legged) intersection. 2
Much of the existing literature on staggered intersections focuses on their safety and performance when there is no signal control. Mahalel et al. analyzed the safety and operational characteristics of two types of staggered intersections in comparison with those of a four-legged cross intersection without signal control. The results showed that the non-signal-controlled staggered intersection, especially the RL type, has advantages in delays, number of stops, and capacities. Ceder and Eldar 3 analyzed how the distance between two T-intersections influences queue length, carrying capacity, and accident probability at non-signal-controlled RL-type staggered intersections, and provided an approach for determining the optimal distance.
As with common cross intersections, staggered intersections are not signal-controlled when the traffic flow is small. As the traffic flow of the major road grows, the gaps for minor traffic to cross the intersection become insufficient. Thus, a signal control is needed to distribute the right of way. Designing the signal timing plan of a staggered intersection is rather difficult due to its special geographical characteristics.
The signal timing plan of a staggered intersection is related to the stagger type and the distance between the two T-legged intersections. Ma et al. 4 advanced a liner control method, which made the main traffic flow go through the stagger intersection without being broken down and was a synchronous signal control method in essence. Wu et al. 5 proposed a method for RL type of staggered intersection by banning and re-routing the left-turns of the minor road, which forces left-turns to go through the intersection multiple times. Both of the above methods are based on empiricism, for the particular situation, and without theoretical analysis. Zeng et al. 6 pointed out that a three-phase signal control method has proven effective for the RL type of staggered intersection. However, it is inappropriate for the LR type because the left-turns from minor roads will conflict with each other, which does not happen in the RL type.
According to the Specification for Setting and Installation of Road Traffic Signals (GB14886-2006), 7 a staggered intersection should be seen as two separate T-legged intersections to be controlled when the split distance is more than 50 m (Figure 2) and otherwise as a single intersection. Isolated fixed time signalized intersections usually adopt four phases of control (Figure 3) in practice, and the inter-green time (yellow time plus all-red clearance intervals) is used to segment conflicting traffic between phases. However, in staggered intersections, the inter-green time increases greatly due to the existence of the split distance, which has a significant impact on intersection delay when the intersection is operating close to capacity. 8

Geometrical description of the LR-type staggered intersection.

Signal phase schemes for the LR-type staggered intersection.
This work attempts to find a suitable signal control method for the LR type of staggered intersection as an isolated intersection. Recently, the sorting strategy has emerged as a promising new way to lower the delays of the intersections. Xuan et al. 9 proposed a tandem sorting strategy, in which a sorting area is formed through the installation of a pre-signal upstream of the intersection signal (Figure 4). In the upstream of the pre-signal, lanes are marked so as to segregate left-turning vehicles (LVs) and through vehicles (TVs) into separate sets of lanes. Yan et al. 10 used the phase swap sorting strategy for most traffic lanes to discharge vehicles and increase intersection capacity. These studies increased the capacity of intersections by increasing the number of vehicles released during the green signal, 10 while the problem of the staggered intersection is the extremely long inter-green time. The proposed design for the LR type of staggered intersection is similar in essence, but overcomes that problem.

The sorting strategy concept: (a) Phase 1 and (b) Phase 2.
The rest of the article is organized as follows. In section “Sorting strategy for the LR-type staggered intersection,” the proposed method, including the intersection channelization and signal phasing, is described in detail. In section “Analysis of lost time with and without a sorting area,” the difference in lost time per cycle between the conventional signal control method and the proposed method is analyzed. In section “Case study with VISSIM simulation,” the VISSIM software is used to model and analyze the performance of the proposed method as well as the conventional method for comparison purposes. Finally, conclusions are presented.
Sorting strategy for the LR-type staggered intersection
The goal of this article is to reduce the lost time per cycle using a sorting strategy for the staggered intersection, including the traffic channelization and corresponding signal phase schemes.
Traffic channelization and signal phase schemes
An example of an LR-type staggered intersection in Hangzhou, China is illustrated in Figure 2, and with signal phase schemes in Figure 3. This example serves as the case study for this research. Figure 2 includes the geometry of the intersection, with eight vehicle movements and four pedestrian movements. Note the signal and its stop line. In the upstream of the signal, lanes are marked according to the direction in which the vehicle is traveling. These markings segregate LVs and TVs into separate sets of lanes. In the downstream of the signal, there are no markings until the vehicles reach the opposite approach, which is the same as a cross intersection. This not only reduces the restraints on the traffic flow but also wastes space at the intersection. Now, we channelize the LR type of staggered intersection, as shown in Figure 5, to make full use of the intersection’s space resources. We allocate the section between the two T-intersections as the “sorting area” by adding road markings and stop lines and setting signal lamps. This area is used to contain the relocated traffic queue of LVs from the minor road and TVs from the major road upstream. The intersection has a total of 10 vehicle movements after this channelization. We denote the signals for movements 2 and 6 as the pre-signals and the others as the intersection signals.
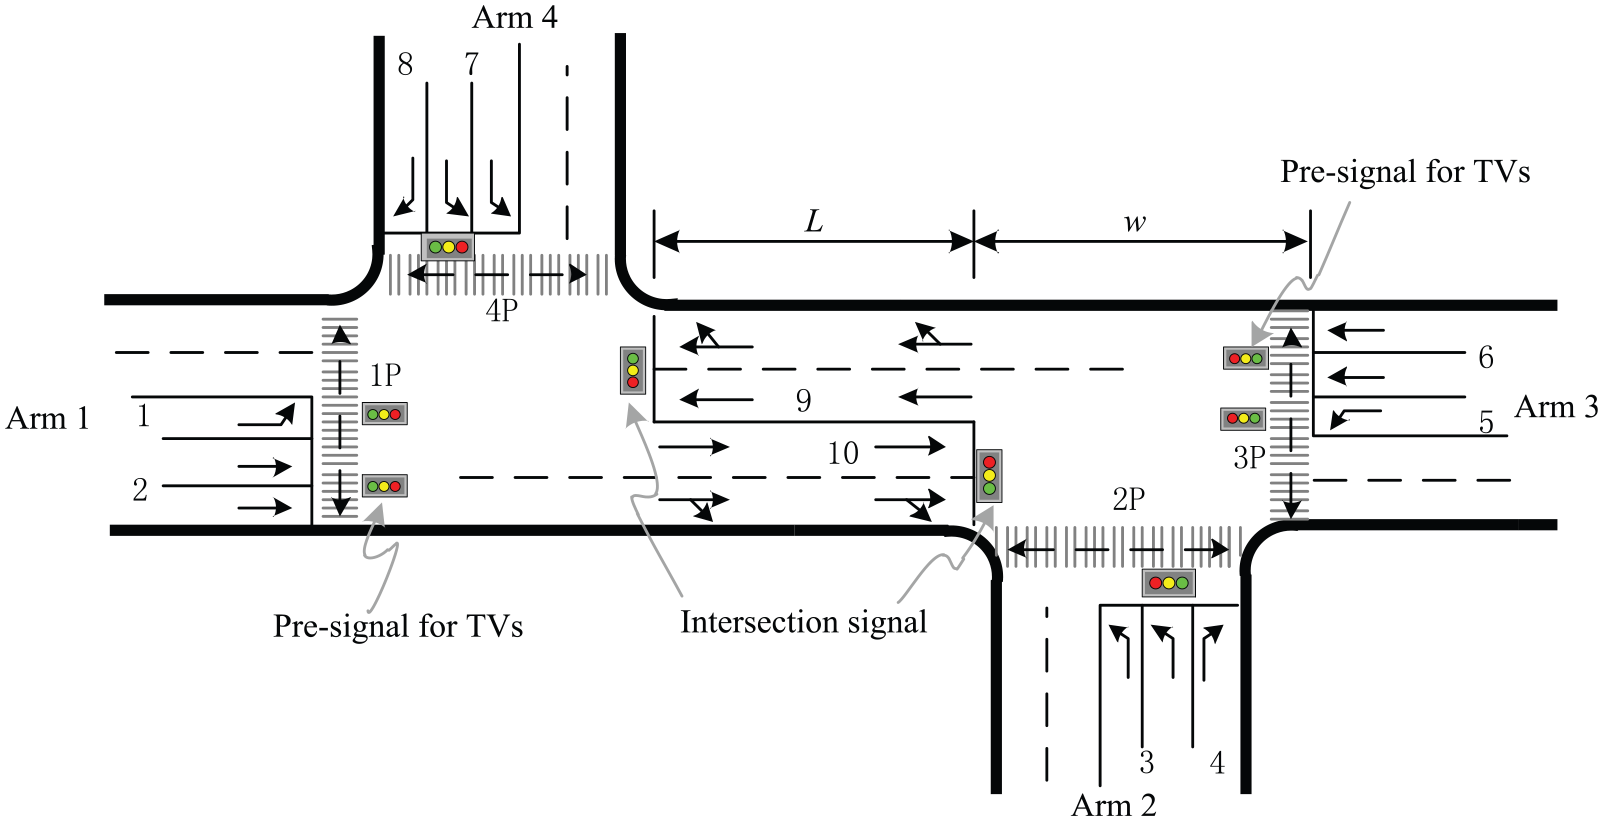
Geometrical description of the LR-type staggered intersection after channelization.
Figure 5 shows how the system would operate for one cycle. We want to use the “sorting area” for the TVs of the major streets, so the LVs of the major streets should lead the TVs. The operation is illustrated in Figure 6. The symbol

Signal phase and sequence for LR-type staggered intersection.
Phase 1 shows that movements 1 and 5 on the major road have the green light. At the same time, the pre-signals on arms 1 and 3 give the green signal to TVs entering the storing area and queuing at the stop lines of the sorting area. In Phase 2, the signals of the storing area are green, and movements 9 and 10 have the right of way. Pre-signals remain green and turn red a little earlier before the green lights of the storing area end. Phase 3 shows that movements 3 and 7 are green and the LVs of the minor roads enter the storing area. In Phase 4, the signals of the storing area are green, releasing the left-turning traffic of the minor stream, which entered the storing area in the previous phase.
Therefore, the traffic demands of Phase 2 and Phase 4 are the TVs released by the pre-signals and the LVs of the minor road that accumulated in Phase 3, respectively.
Pre-signal timing and intersection signal constraints
Two potential problems need to be guarded against when one is designing the pre-signals and sorting area. The first is the potential waste of green time at the main junction if traffic is not released from the pre-signals sufficiently early, 11 which is related to the split distance and signal timing. The second is that the relocated traffic queues of LVs from the minor roads may queue back and block the traffic going in the opposite direction, which is related to the split distance, signal timing, and the traffic demand of the minor roads.
To ensure that no potential capacity is wasted at the junction, the signal timing should satisfy the following constraint conditions:
1. Vehicles must be released sufficiently early from the pre-signal stop line so that they can arrive at the signal stop line of the downstream sorting area before the sorting area green signal starts. The green pre-signal should end early, before the sorting area green signal ends so that the vehicles released from the pre-signal stop line can pass the intersection. This is ensured by


where t1 = the interval between the start time of the green pre-signal and the start time of the sorting area green signal and t2 = the interval between the end time of the green pre-signal and the end time of the sorting area green signal, as shown in Figure 7, in seconds, s, D = the distance from the pre-signal stop line to the sorting area stop line downstream, in meters, m, and v = the speed of the vehicle through the intersection, in m/s.

Description of t1, t2, and t3 in the signal timing process.
Similarly, because the vehicles released at Phase 4 are the LVs from the minor street released in Phase 3, the interval between the start time of Phase 3 and the start time of Phase 4, that is, t3 in Figure 7, should be short enough that the vehicles released in Phase 3 can arrive at the sorting area stop line before Phase 4 starts, as shown in equation (3), where D′ = the distance from the minor approach stop line to the sorting area stop line downstream, in m.

2. The sorting area is required to hold relocated traffic queues of LVs from the minor street without spilling and blocking the traffic moving in the opposite direction. This is ensured by

where L = the length of the sorting area, in m; n = the number of lines in one direction of the sorting area; kj = the density of the queue, in veh/m/ln; q3 and q7 = the rates of vehicle flow for movements 3 and 7, respectively, in veh/s; and Cw = the cycle time, in s.
The cycle of the pre-signal is the same as that of the intersection signal. Here, we use Webster’s 12 famous formulation and principle for determining the optimal cycle length and green split allocation for isolated staggered intersections. The rationale behind Webster’s formulations is simple and straightforward for both practitioners and researchers to follow.
Analysis of lost time with and without a sorting area
Lost time cannot be available for vehicular service. The more is the lost time, the lower is the efficiency of the signalized intersection. The 2010 edition of the Highway Capacity Manual (HCM 2010) 13 indicates that lost time varies with the length of the inter-green time (i.e. yellow and all-red intervals) in the signal timing. Lost time per phase can be estimated as follows


where lt is the total lost time, in s/phase;
The HCM recommends the use of the following default values for this calculation: start-up lost time

ITE’s Traffic Engineering Handbook 14 offers the following equations for computing the inter-green time (yellow change plus red clearance intervals)

where Y = length of yellow change interval (s); Rc = length of all-red clearance interval (s); t = perception-reaction time from the onset of a yellow signal (s); v = the speed of the vehicle through the intersection (m/s); a = the deceleration rate in response to the onset of a yellow signal (m/s2); g = acceleration due to gravity (m/s2); G = grade, with uphill positive and downhill negative (percent grade/100); w = the clearance distance (m); and l = the length of the vehicle (m). The handbook cites values of t = 1.0 s, a = 3.0 m/s2, and l = 6 m for use in equation (9).
There are variations in the selection of the value of speed and width of the intersection for use. 8 In this article, we use posted speed limits and the clearance distance is measured from the near-side stop line to the near-side of the pedestrian crosswalk on the far-side of the intersection for the through movement (i.e. wT in Figure 8) or to the near-side of the pedestrian crosswalk across the leg of the intersection, which the LVs are entering (i.e. wL in Figure 8), because the crosswalk has pedestrian signals. Here, we assume that the slope grade of the intersection is zero and the widths of the four approaches are the same, for convenience of computing. Then, the lost time under different situations can be derived as follows.
Case 1. The cross intersection under a conventional phase scheme is shown in Figure 3. The lost time per phase can be expressed as


Case 2. The staggered intersection (Figure 2) under a conventional phase scheme is shown in Figure 3. The lost time per phase can be expressed as follows and L is the splitting distance


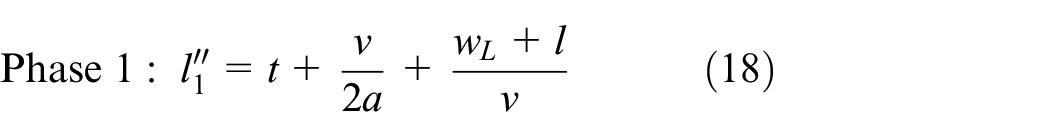
Case 3. The staggered intersection (Figure 2) under the proposed phase scheme is shown in Figure 6. The lost time per phase can be expressed as


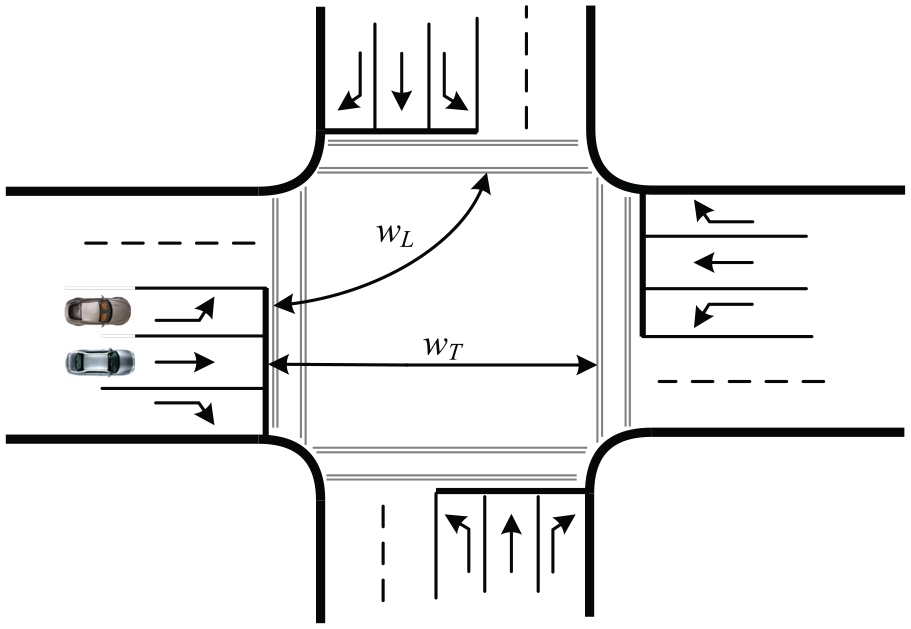
Definition of clearance distances for the calculation of inter-green intervals.
According to equations (10)–(17), the difference in the total lost time per cycle between the staggered intersection (Case 2) and the cross intersection (Case 1) under the same signal phase scheme can be expressed as
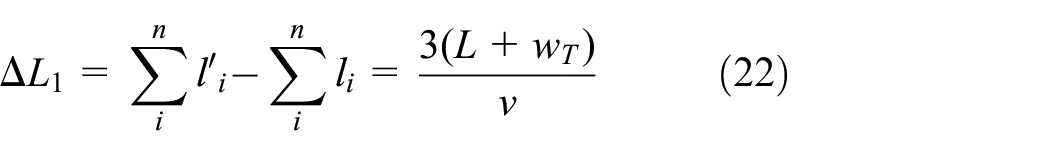
Equation (22) gives a positive value, which means that there is an increase in lost time per cycle for a staggered intersection. We also know that the increment is three times (L + wT)/v, which means that the longer is the split distance, the higher is the increase in lost time.
According to equations (14)–(21), the difference in total lost time per cycle between the staggered intersection under the proposed method (Case 3) and under the conventional method (Case 2) can be expressed as

Equation (23) produces a negative value, which means that there is a decrease in lost time per cycle when the proposed method is used for the staggered intersection and the decrease is three times (L + wL)/v. Compared with equation (22), we can conclude that the lost time per cycle of the proposed method is less than that of the conventional method and almost the same as that of the cross-shaped intersection because there is little difference between lengths wL and wT.
Case study with VISSIM simulation
In this section, we present a case study to demonstrate the application of the model developed above and to explore the difference in performance between the conventional and proposed methods. The VISSIM software is used to model the traffic performance of the LR-type intersection.
Traffic data
A traffic survey was carried out at the intersection of Shenhua Road and Zijinghua Road in the city of Hangzhou, China, for 1 h during the morning peak (7:00–8:00), evening peak (17:00–18:00), and off-peak hour (12:00–13:00) in a weekday, 2014. The channelization and signal phase schemes of the selected intersection are illustrated in Figures 2 and 3, respectively.
By field observation, the saturation flow rates and the hourly volumes of each movement during the morning and evening peak periods were obtained, as listed in Table 1.
Hourly volumes and saturation flow rates for each movement.
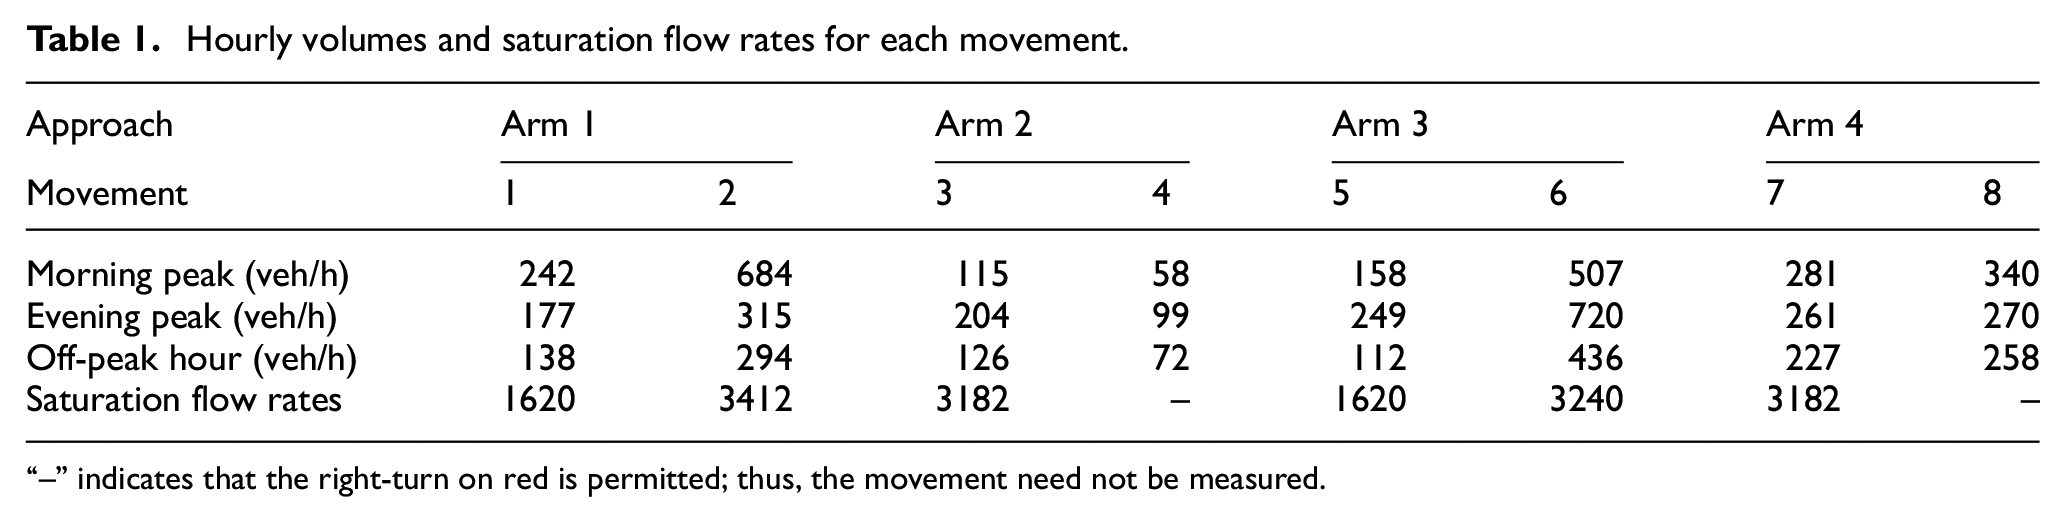
“–” indicates that the right-turn on red is permitted; thus, the movement need not be measured.
Calibration of VISSIM
Some parameters were calibrated for the VISSIM simulation based on field observations. The average traffic speed on the road section was set as 50 km/h. The speed limit at intersections is 40 km/h and trucks are banned from crossing, according to the policies established by the local traffic department. The average speed of through movements was set as 35 km/h because of the long split distances at intersections. LVs will slow down because of the need to be cautious at intersections, and the average speed for them is set as 30 km/h. The parameter kj in equation (4) is 134 veh/km/ln and the average standstill distance is 2.4 m.
Another important parameter is the lost time per phase. It is determined using equations (14)–(21). The clearance distances wT and wL, and the split distance L are set as 35, 31, and 46 m, respectively, based on field measurements.
We use Webster’s formulations to calculate the signal timing data for the conventional method and for the proposed method, and then make sure that the signal timing of the proposed method can satisfy the constraints of equations (1)–(4). The results are shown in Table 2.
Signal timing data for the conventional and proposed methods (in seconds).

Simulation analysis
The simulation was carried out over 10 runs with 10 different random seeds for each scenario. Each run lasted for 4200 s, the first 600 s of which were used for warming up the intersection and the next 3600 s for evaluating the traffic flow operations. The delay of each movement can be measured by the corresponding travel time sections set in the VISSIM, 15 and the maximum queue length is measured by the queue counters located at the stop lines of the approaches.
Table 3 lists the volumes and intersection performance indexes of the six scenarios. There is little difference in the vehicle import for all movements, between the conventional method and the proposed method in each period. Compared with the conventional method, the average delays for all movements with the proposed method were reduced by 26.4%, 29.7%, and 25.9%, respectively. The maximum queue length was measured every 3 min for all movements for a total of 10 × 60 min/3 min = 200 queue data points for each movement, and the maximum queue lengths for all movements of the proposed method were reduced by 21.6%, 26.9%, and 26.3%, respectively.
Volumes and intersection performance indexes of four scenarios.

Figure 9(a) shows the vehicle import for each movement under the six different scenarios. Obviously, the vehicle import for each movement under the conventional method is very close to that under the proposed method in each period. Figure 9(b) shows that the average delay for each movement of the proposed method is less than that of the conventional method. Figure 9(c) shows that the proposed method reduces the maximum queue length for each corresponding movement, and the maximum queue length of movement 9 of the proposed method is less than that of movement 2 of the conventional method in the same peak period, and similarly for movement 10 of the proposed method in comparison to movement 6 of the conventional method.
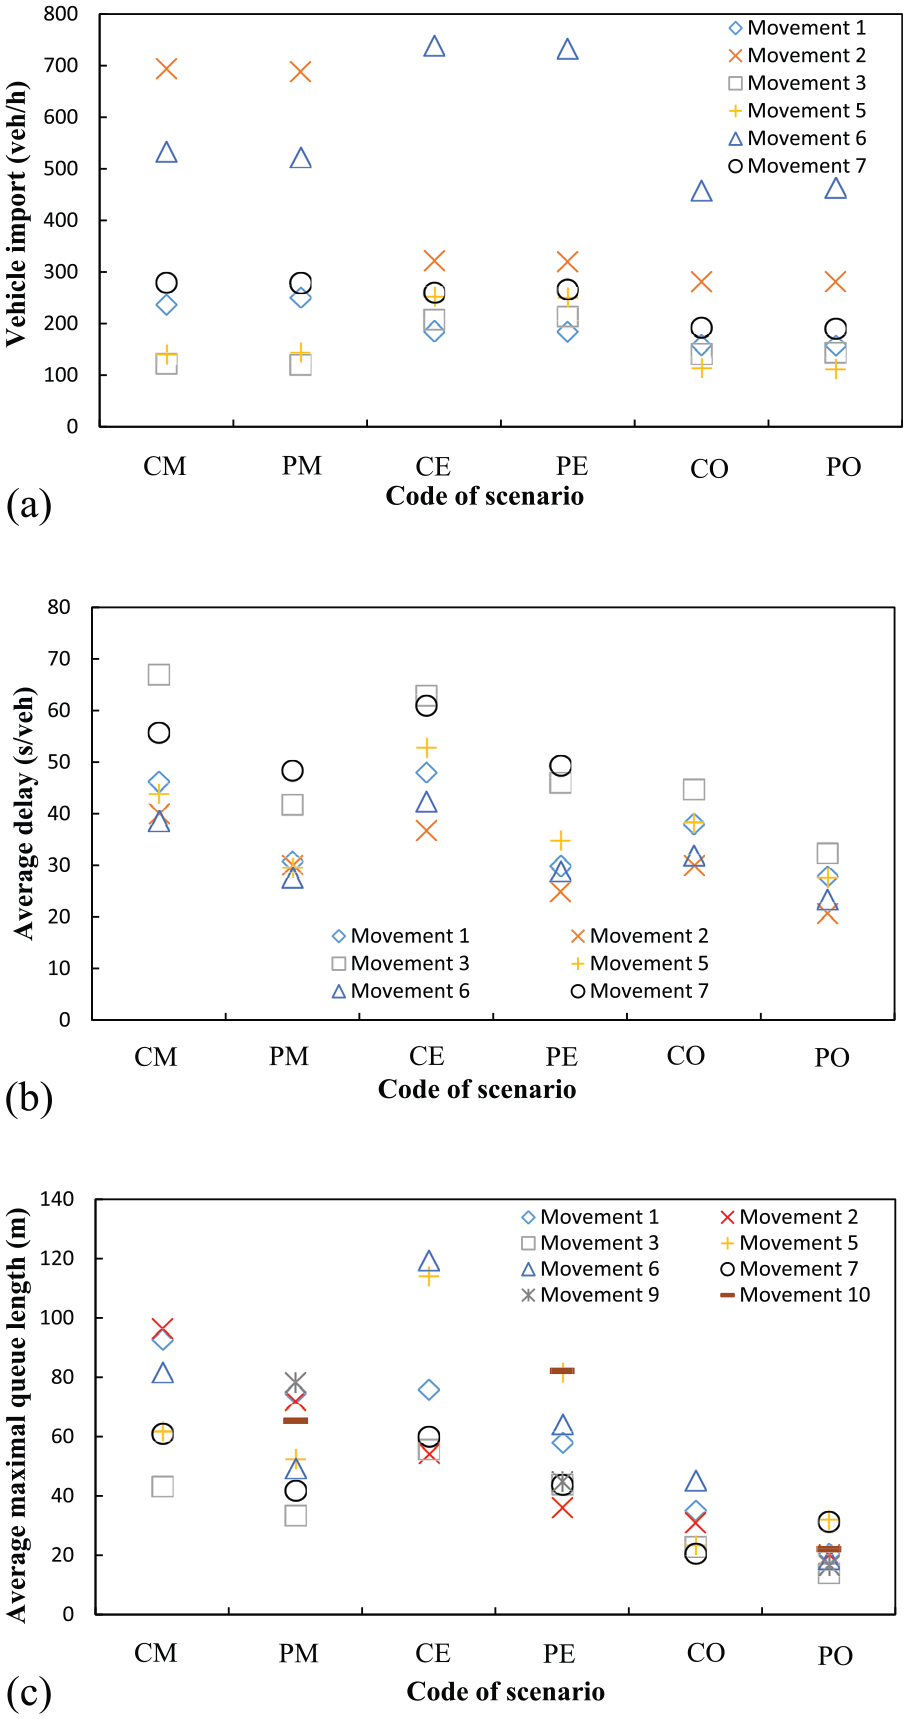
Vehicle import and intersection performance indexes under different scenarios for each movement: (a) vehicle import of each movement; (b) average delay of each movement; and (c) maximal queue length of each movement.
Conclusion and further research
This research has presented a signal control design for the LR type of staggered intersection, including intersection channelization and signal phasing based on a sorting area and pre-signal. This method reduces the lost time of the signal cycle using the split distance as a staggered area, which holds the transient queues of vehicles released into the sorting area. The sorting area is required to hold the relocated traffic queue of LVs from the minor road without queuing back, which depends on the length of the sorting area and the number of vehicles released during the green signal from the minor street. Thus, short cycles may be needed if the length of the sorting area is short. Fortunately, the sorting area allows cycles to be shortened by decreasing the lost time per cycle compared with the conventional method. When analyzed using a case study based on the VISSIM simulation, the proposed method shows promise in reducing the average delays and maximum queue lengths for each movement and the entire intersection, both in the off-peak hour and peak hours. The analysis in this article is conducted for a single length of sorting area. Further comparisons of the impact should be made using different sorting area lengths.
Footnotes
Acknowledgements
Kan Yuheng and Zheng Zhengfei helped in processing some of the data used in this article, and their assistance is gratefully acknowledged.
Academic Editor: Ling Zheng
Declaration of conflicting interests
The author(s) declared no potential conflicts of interest with respect to the research, authorship, and/or publication of this article.
Funding
The author(s) disclosed receipt of the following financial support for the research, authorship, and/or publication of this article: This research is supported by the National Natural Science Foundation of China under grant nos. 51338008 and 51278454.