
Abstract
In this research, the effect of utilizing semi-attached rib on heat transfer and liquid turbulent flow of nanofluid water–copper oxide in three-dimensional rectangular microchannel has been investigated. The results of numerical examination of this study in comparison to those of smooth channel have also been evaluated. The range of Reynolds numbers is between 10,000 and 60,000 and the volume fraction of copper oxide nanoparticle in 0%, 2%, and 4% was examined. In this numerical simulation, the effects of the changes in parameters such as dimensions of semi-attached rib, volume fraction of the nanoparticle, and Reynolds number were considered. The results of this study showed that utilizing semi-attached rib in microchannel with a ratio of 0 < R/W ≤ 0.325 in producing stronger vortices, which causes better mixture in fluid layers, is weaker than that with tooth mode of R/W = 0 ratio. However, the main advantage of using tooth with a ratio of 0 < R/W ≤ 0.325 in comparison to ordinary tooth is the increase in heat transfer and reduction in coefficient friction and pumping power.
Introduction
Nowadays, because of utilizing small-scale tools in industries such as electronic industries, aviation industries, medical industries, and laboratories, we need to apply a new and productive procedure in heat transfer of these tools. Creating new procedures and correcting the already existing ones to increase heat transfer in tools and industrial technologies is one of the active research areas. Because of low efficiency in heat transfer, previous procedures of heat transference are not responding anymore today. Using metal nanoparticle powder to increase the thermal conductivity of the cooling fluid, non-circular ducts to increase the surface-to-volume ratio, and rough surfaces to gain better turbulence of fluid flow and microchannels are new and productive ways in controlling heat transfer. Besides direct use of the newly defined methods, their heat conductivity can be increased by employing methods such as changing parameter dimensions and kind of teeth. In the last decades, many studies have been conducted on new methods of heat transfer and nanofluid flow in channels, microchannels, microchannel heat chambers, and motion transducers.1–12 Peyghambarzadeh et al. 13 carried out an empirical investigation on calm flow of nanofluid water–carbon oxide and water–aluminum oxide in microchannel heat chambers. They found that using nanofluid as a cooling fluid has more pressure reduction compared to pure water. Manca et al. 14 investigated the compulsory heat transfer of water–oxide aluminum nanofluid in tooth channels. They found that nanofluid density increase does not have a major effect on transfer. Having investigated the reaction of mandatory heat transfer in tooth channels with semi-attached rib, Liu and Wang 15 found out that designing different teeth would increase heat transfer and decrease pressure and coefficient of friction. The problem of pressure decrease and friction and creation of some parts with low heat transfer behind tooth is solved to some extent by designing semi-attached rib. Chai et al. 16 studied the optimizing behavior of heat transfer of calm water fluid flow in microchannel heat chambers with interrupted rectangular tooth. They found out that separation of vortices’ creation flow and failure of boundary layers had a salient effect on flow in these kinds of microchannels. Raisi et al. 17 examined the compulsory heat transfer of nanofluid water–oxide copper in rectangular microchannel with slip and non-slip boundary conditions. They understood that heat transfer is outstanding in higher Reynolds. Heidary and Kermani 18 studied the use of nanofluid in channels with wavy walls, concluding that heat transfer is increased about 50% using nanofluid and channel with wavy walls. Jung et al. 19 examined the heat transfer and coefficient of friction of nanofluid water–oxide aluminum in microchannel. Their study showed that with 1.8% increase in volume fraction of aluminum oxide nanoparticle, heat transfer will increase by about 32%.
By reviewing the presented articles, we understand the importance of applying microchannels to cool industrial tools in recent years; however, more research is needed on nanofluids.20,21 In addition, more attention is needed to investigate the heat operation of nanofluids inside tools with micro- and nano-dimensions. 22 In this article, the numerical study of the effect of the T-shaped semi-attached rib on turbulent heat flow and transfer parameters of fluid water–oxide copper with different nanoparticle volume fractions in a three-dimensional rectangular microchannel was carried out.
The obtained results were compared with the existing results of the previous studies in order to validate the research. This discussion applies to industrial and condensed cooling instruments such as microelectronics to cool integrated circuits with large dimensions (very-large-scale integrated (VLSI)) and micro-electro-mechanical industries.23–26 This article was a numerical study of turbulent flow of water–oxide copper in three-dimensional rectangular microchannels with semi-attached rib. Using inner ordinary tooth in microchannels and channels causes an increase in heat transfer coefficient. On the other hand, ordinary internal tooth causes some disadvantages such as increased pressure loss of friction coefficient and pumping power in heat transfer devices. Utilizing semi-attached rib design, one can enjoy the benefits of enhanced heat transfer with internal tooth. On the other hand, this tooth design minimizes the disadvantages of complete tooth design.
Statement of the problem
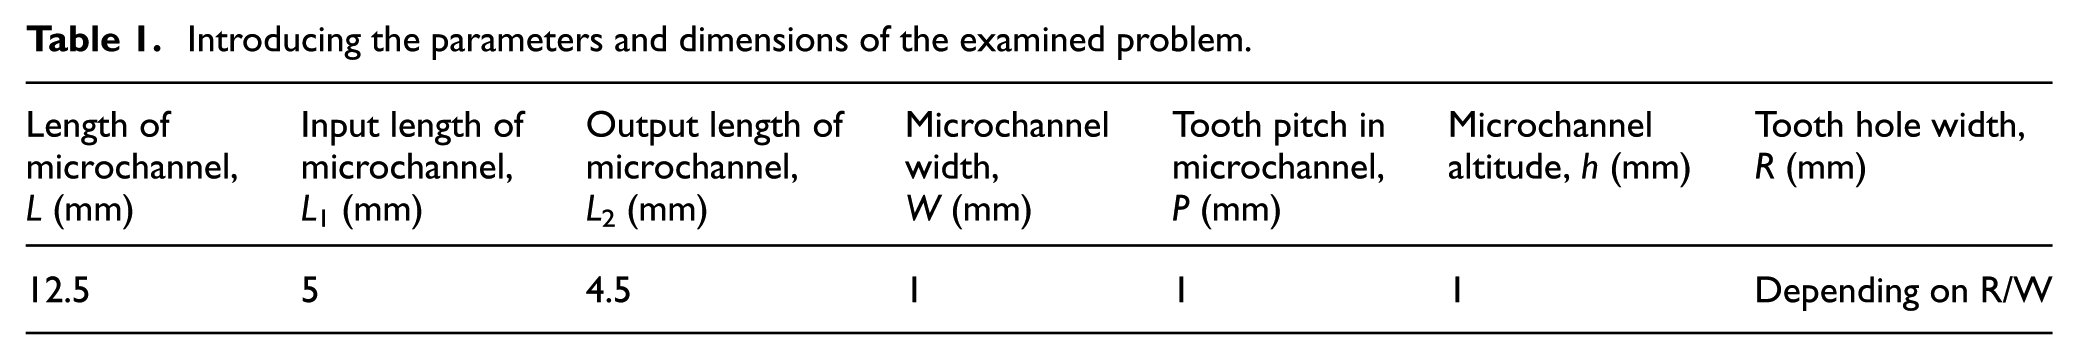
The analysis is made on a three-dimensional rectangular microchannel. In this research, the fluid flow and heat transfer of nanofluid water–oxide copper in a tooth microchannel with semi-attached rib at lower and upper walls of the microchannel are examined. There are two rectangular holes in tooth’s corner so that part of the cooling fluid can cross them. The characteristics of heat transfer and computational fluid dynamics for four different arrangements of teeth with tooth hole width ratio to channel width (R/W) for 0, 0.125, 0.25, and 0.325 R/Ws are examined. The range of Reynolds numbers in this research is 10,000 < Re < 16,000. In this examination, the nanofluid water–oxide copper with volume fraction of 0%, 2%, and 4% copper oxide nanoparticle is used. Figure 1 displays the schematic channel of teeth kinds and dimensions. The sizes and dimensions of the examined microchannels are presented in Table 1.

Schematic channel of teeth kinds and dimension of this study.
Introducing the parameters and dimensions of the examined problem.
Basic equations governing the threedimensional turbulent flow
Basic equations governing heat transfer and fluid flow include continuity momentum equations and conservation of energy. 14 The assumptions utilized to solve governing equations in heat transfer process in numerical analysis are as follows:
Newtonian fluid is incompressible. The property of the fluid is assumed fixed with the temperature. The flow is turbulent and hydro-dynamically developed. The condition of non-slip in walls is assumed. The fluid enters the microchannel input areas with a monotonous velocity. The shape of the nanoparticle is assumed to be monotonous and spherical. Constant heat flux is applied to walls. The second discretization is used for all parameters. The turbulent model of k–ω shear stress transport (sst) is used to model the turbulent flow. The simulation space is three dimensional.
Continuity equation

The momentum vector equations

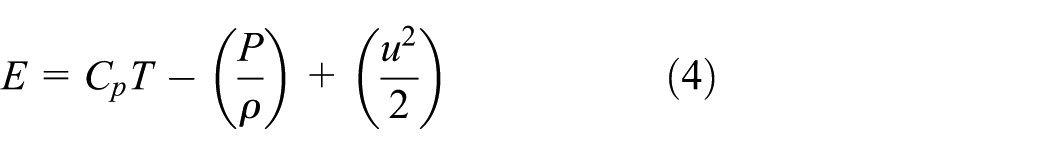
The energy equation

In the above equation, E is the total energy of deviatoric stress tensor (τij) eff which is defined as

The transfer equation for the shear stress transfer model k–ω is as follows 27
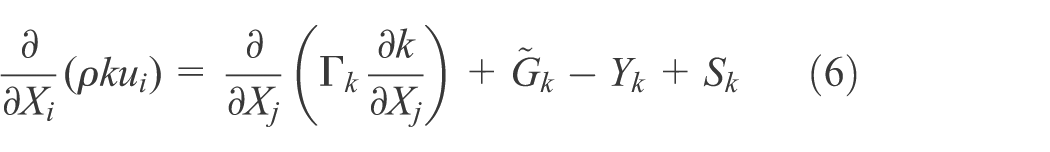

In the above equations, Gk is the turbulent kinetics energy from the medium velocity gradients and the Gω sentence states the production of this sentence from ω


In the above equation, νt is the turbulent viscosity, β* is the fixed model, and the amount of α is calculated from the following equation
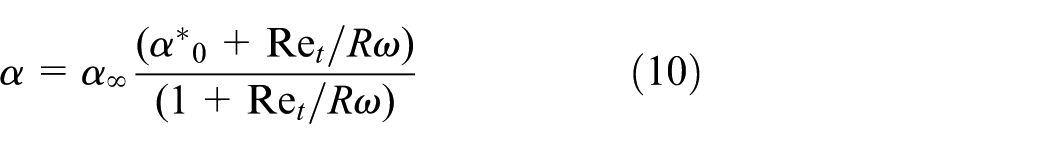
The amount of Rω = 2.59 and the α statement is stated as follows


In the above equation, κ = 0.41 and βi = 0.072. In the above Reynolds numbers, α = α∝ = 1. And in equations (6) and (7), the Γ ω and Γ k statements are the effective diffusions of k and ω and are stated as follows

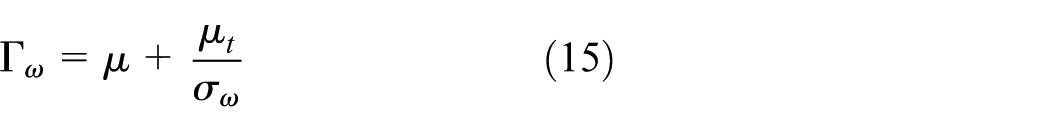
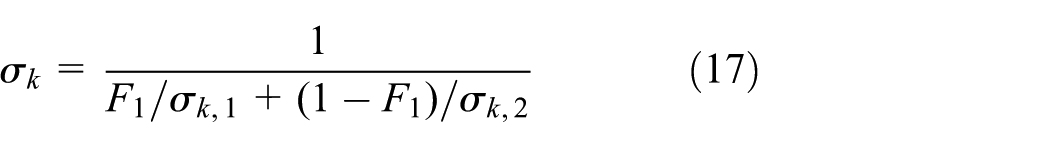
The expressions σω and σk state the turbulent portal numbers in k–ω model, which are stated as follows

µt is the turbulent viscosity and is stated as follows

And it is stated with the following equation

The F1 mixing equation equals


In equation (21), y is the distance to the next level of fluid and


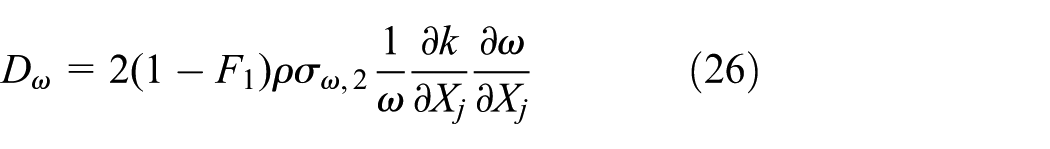
Dω reflects the influence in cross section, whereas Sk and Sω are the possible conditions of the source. Specifically, Dω equals
The model constants 14 are summarized in Table 2.
Constant shear stress transport turbulence model of k–ω.

Governing relationships to calculate properties of nanofluid and parameters
In this section, the governing relationships on nanofluid properties are introduced. The following equation is used to calculate the density of the nanofluid28,29

Thermal diffusivity of the nanofluid is calculated via the following equation 30

The specific heat capacity of the nanofluid is calculated with the following equation 31

To calculate dynamic viscosity of the nanofluid in a turbulent flow, the following equation32,33 is used

Patel et al.’s 34 equation is used to calculate the effective thermal conductivity of nanofluid for suspensions with spherical particles

In equation (31), the empirical constant is c = 36,000


In equations (32) and (33), the water molecule diameter is df = 2 Å and the nanoparticle molecule diameter is ds = 100 nm; the amount of us is the velocity of Brownian motion nanoparticles and is calculated by the following equation
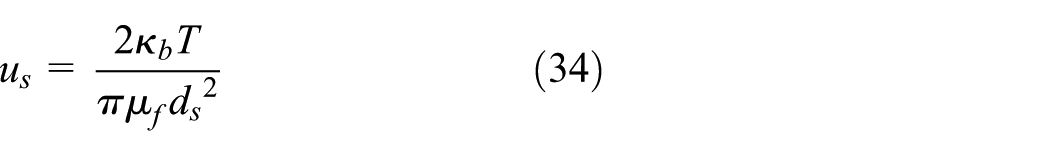
In equation (34), the amount of
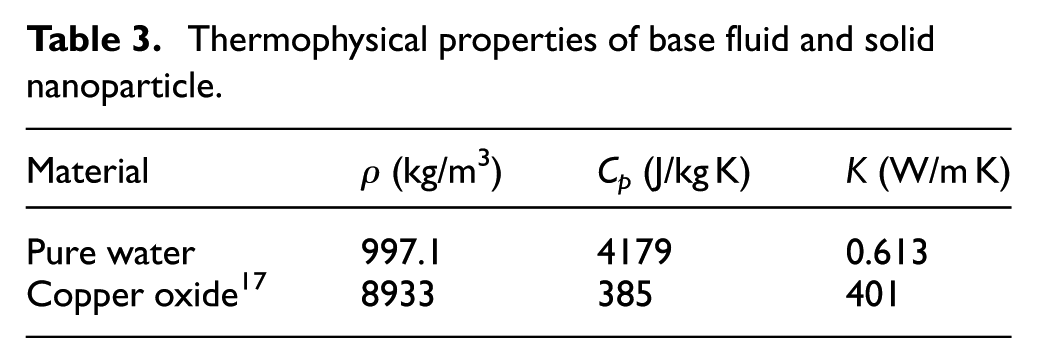
The nanofluid used in this suspension simulation is from copper oxide nanoparticles in basic fluid of water with volume fraction of 0%, 2%, and 4% of the nanoparticle. The thermophysical properties of base fluid and copper oxide nanoparticle powder are displayed in Table 3.
Thermophysical properties of base fluid and solid nanoparticle.
The molecular diameter of solid nanoparticles and base fluid is presented in Table 4.
Molecule diameter of used base fluid and nanoparticle powder in the examined problem.

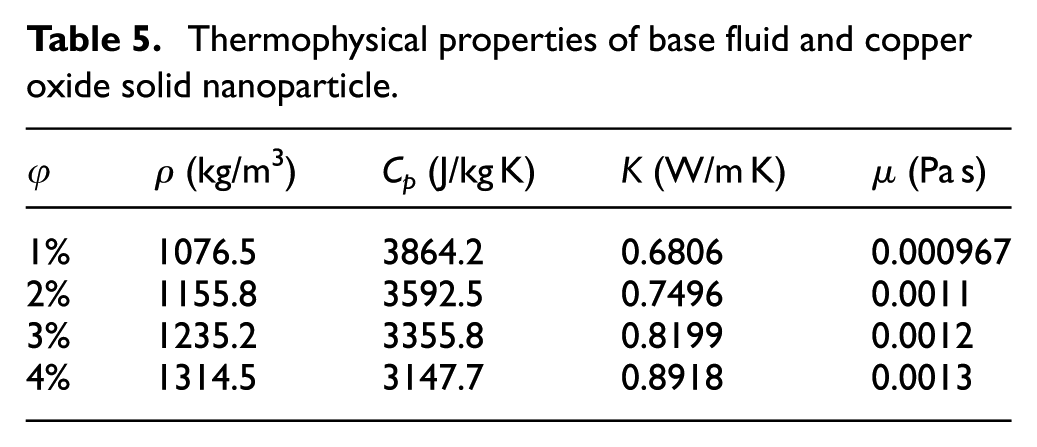
The properties of the utilized nanofluid for the volume fractions of 0%, 2%, and 4% of solid nanoparticle are presented in Table 5. Equations (27)–(34) are used to calculate these properties.
Thermophysical properties of base fluid and copper oxide solid nanoparticle.
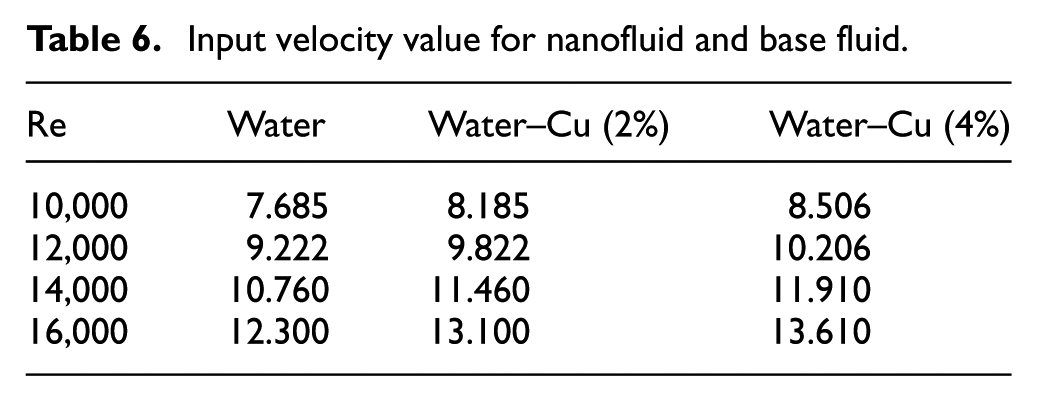
The input velocity values for the nanofluid and base fluid in Reynolds numbers and different volume fractions of nanoparticles are calculated in Table 6.
Input velocity value for nanofluid and base fluid.
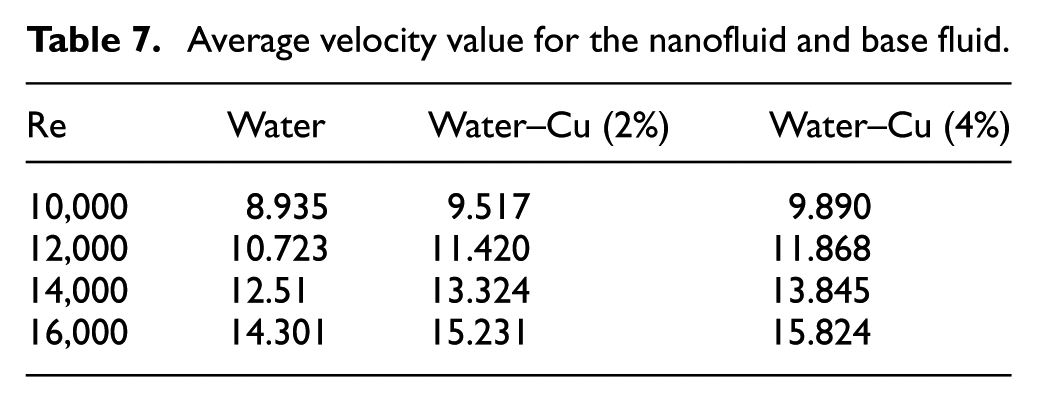
The average velocity values for the nanofluid and base fluid in Reynolds numbers and volume fractions of different nanoparticles are calculated in Table 7 according to equation (37).
Average velocity value for the nanofluid and base fluid.
In this section, the equations to calculate the desired parameters in simulation results are introduced. The pumping power (Pp) is one of the parameters of determination of microchannel operation and is the needed power to pump fluid into the channel, and the relationship between this parameter and pressure decrease ΔP in microchannel length is obtained by the following equation15,35–38

In the above equation, uin is the input velocity and Ac is the cross-sectional area. Hydraulic diameter of the microchannel is also one of the physical properties of the microchannel, which is defined as follows39,40

In equation (36), Ac is the cross-sectional area of microchannel and p is the wet environment of the microchannel. Reynolds number in this problem is calculated by the following equation 14

The following equation is used 41 to calculate the average coefficient of fraction

The average Nusselt number is obtained with the following equation 42
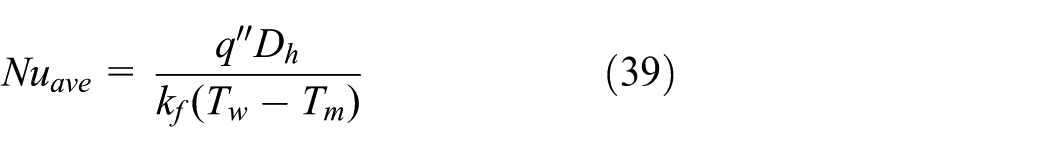
In the above equation, Tw is the temperature of microchannel wall and Tm is the average bulk temperature. To evaluate the thermal and fluid function of three-dimensional tooth microchannel, the parameter performance evaluation criterion (PEC) as the thermal efficiency is defined as follows 43

The Poiseuille number is calculated as follows44,45

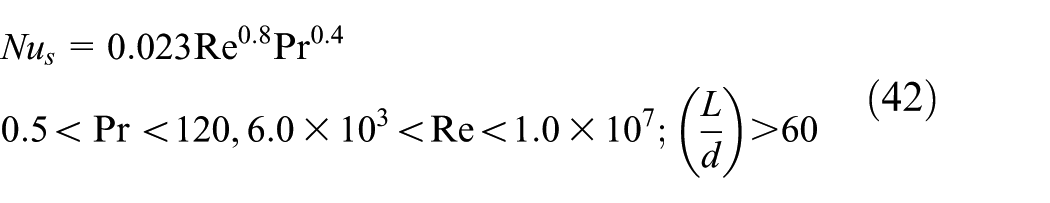
In turbulent flow analysis section, empirical relationships were used for validation and comparison of the results. The Dittus–Boelter relationship and Petukhov relationship are used to calculate the Nusselt number in smooth channel. Considering the parameters, the range of validity of results is as follows:
The Dittus–Boelter relationship 14
Petukhov relationship 14

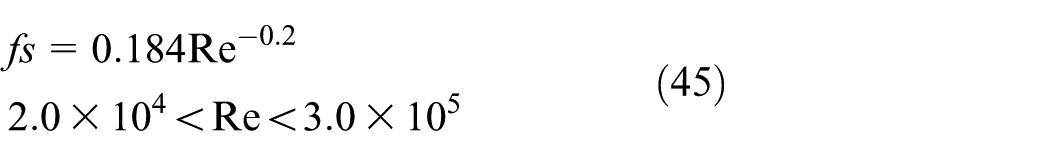
The Petukhov and McAdams relationships are used to calculate coefficient of friction in smooth channel and validation with empirical relations, defined as follows:
Petukhov relationship 14

McAdams relationship 14
Boundary conditions for the governing equations
The boundary conditions are as follows:
In input

The input velocity is presented according to Table 6. The fluid temperature in the input equals 293 K.
In output

In microchannel walls

It is worth mentioning that the fluid temperature in the input equals 293 K, constant heat flux is applied to all microchannel walls, and the amount of applied heat flux to microchannel walls equals q// = 20,000 W/m2.
Numerical solving procedure
The control volume method is used46,47 to solve the governing Navier–Stokes equations on turbulent flow in this problem. In the controlled volume method, conservation equations are integrated on cell and they are established for all computational domains. This property is true for different numbers of nodes, even if there are few nodes.48–50 The second-order upwind method is used to discretize all the equation terms, and SIMPLE algorithm is used to couple pressure–velocity.51,52 When the residuals of all parameters are less than 10−6, the problem solving becomes convergent and the calculations reach a result.
Grid independency
The number of grid cells in R/W = 0 mode and Reynolds number of 16,000 and for the pure water fluid were examined to numerically simulate this problem. The number of grid points change between 350,000 and 750,000, and the effect of these changes on the average Nusselt parameters and coefficient of friction was investigated. The result of this investigation is shown in Table 8.
Suitable grid number to solve this problem.
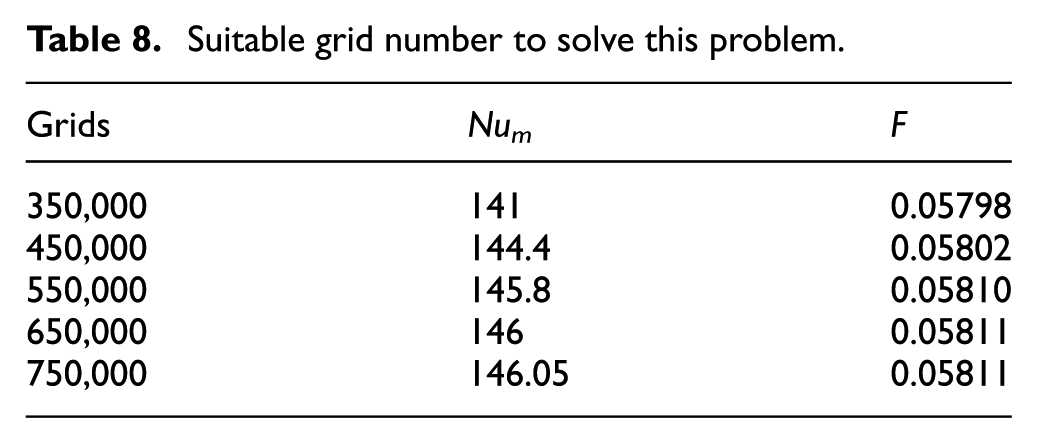
As it was obvious, after the increase in cell numbers to a specific number, there was not any outstanding change in the average Nusselt and coefficient friction. Therefore, the optimum number of cells is chosen, which is 550,000 in this research. The calculation error in the number of cells is less than 1%. Therefore, the numerical simulation in this research is done with this number of cells.
Discussion and conclusion
The results presented in this section are related to the examination of the effect of tooth hole width ratio to microchannel width (R/W). The presented results include the average Nusselt, the convection heat transfer coefficient, the PEC, the pumping power, the coefficient of friction, and the Poiseuille number. These results are for 0, 0.125, 0.250, and 0.325 R/Ws. The calculated amounts are measured for each fluid and heat transfer parameter of turbulent flow in each R/W mode to similar parameters in smooth microchannel (without tooth).
According to the above point, both smooth and tooth microchannels simulated with similar geometry and boundary conditions. The cooling fluid of pure water with empirical relationships of turbulent flow has been used to smooth microchannel. The results of this research are calculated for the Reynolds number of 10,000–16,000 and volume fractions of 0%, 2%, and 4% copper oxide nanoparticle.
Validation
In this section, the results of Manca et al. 14 and Salman et al. 53 are used for validation. Figure 2(a) and (b) shows the amounts of the average Nusselt number and coefficient of friction in smooth microchannel with the cooling fluid of pure water, respectively, and Figure 3 shows the validation with the research by Salman et al. 53 As it is obvious in the figures, the results of this study are in line with those of Manca et al. 14 and Liu and Wang 15 and have adequate precision.

Comparition between present work and Manca et al. 14 : (a) average Nusselt number and (b) friction factor versus Reynolds number.

Validation of this study with the research by Salman et al. 53
Figure 4 displays the average Nusselt number for the smooth and tooth microchannels with ratio of R/W = 0 and R/W = 0.25 for the pure water in Reynolds number range of 10,000–16,000. We can understand from the results obtained in Figure 4(a) that the average Nusselt number for R/W = 0 mode increases between 42% and 65%, and for R/W = 0.25 mode, it increases between 34% and 37% compared to smooth channel, and that is because of the vortices formed because of the obstacles. Figure 4(b) and (c) shows the average Nusselt number for the smooth and tooth microchannel with R/W = 0.25 and R/W = 0 in volume fractions of 0%, 2%, and 4% nanoparticle. It is obvious from the obtained results that in the volume fraction of 2% of nanoparticle in R/W = 0 mode, the average Nusselt number increases between 16% and 17%, and in the R/W = 0.25, the average Nusselt number increases between 14.5% and 15%. In the volume fraction of 4% in R/W = 0 mode, the average Nusselt number increases between 31% and 32%, and for the R/W = 0.25 mode, the average Nusselt number increases between 28% and 29%, and the evaluation for the channel with similar R/W and pure water fluid is performed. The reason for the increase in Nusselt number in higher nanoparticle volume fractions compared to pure water fluid is the existence of nanoparticle in the working fluid, which increases the thermal conductivity and enhances the heat transfer mechanisms.

Ratio amounts of the average Nusselt number based on Reynolds number in smooth and tooth microchannels with different nanoparticle volume fractions.
Figure 5 displays the average coefficient of friction for the tooth microchannel with R/W = 0.25 and R/W = 0 and smooth microchannel for pure water fluid in Reynolds number range of 10,000–16,000. From the results obtained in Figure 5(a), the average coefficient of friction for R/W = 0 is between 2.16 and 2.50 times the smooth channel, and for R/W = 0.25, the coefficient friction increase is about 1.9–1.96 times smooth channel. The reason for this is the existence of tooth on fluid path. The reasons for higher coefficient of friction in R/W = 0 compared to R/W = 0.25 are the flow of fluid from holes of teeth edges and the reduction in path blocking of fluid flow by tooth in R/W = 0.25. Figure 5(b) and (c) displays the average coefficient of friction in volume fractions of 2% and 4% nanoparticle. According to Figure 5(b), in volume fraction of 2% nanoparticle in R/W = 0, the average coefficient of friction has increased between 15.8% and 16% compared to pure water fluid in tooth R/W = 0 mode. At R/W = 0.25, the average coefficient of friction has increased about 14.6% and 15.9% compared to pure water fluid in R/W = 0.25 tooth mode. In Figure 5(c), in fraction volume of 4% nanoparticle in tooth modes of R/W = 0.25 and R/W = 0, the average coefficient of friction increases about 30.6%–31.9% and 32%–32.1%, respectively, compared to similar R/W mode pure water fluid. The reason is an increase in the nanoparticle volume fraction, which leads to increased shear stress in wall and viscosity increase. The average coefficient of friction in R/W = 0 is higher compared to that in R/W = 0.25, and the reason is the lower pressure drop in R/W = 0.25.

Average coefficient of friction based on Reynolds numbers in smooth and tooth microchannels with different nanoparticle volume frictions.
Figure 6 displays the average values of convection heat transfer coefficient for the microchannel with different R/W tooth in volume fractions of 0%, 2%, and 4% nanoparticle and Reynolds number range of 10,000–16,000. It can be concluded from the obtained results that with an increase in Reynolds numbers and volume fraction of solid nanoparticle, the average value of convection heat transfer coefficient increases. In R/W = 0, the value of this coefficient is the highest value between different volume fractions of nanoparticle, and different Reynolds numbers are similar to other R/W modes. The reason is the better distribution of temperature between layers of fluid close to microchannel surface and creation of stronger vortices than other R/Ws. Among the examined modes, R/W = 0.325, compared to R/W = 0.25 and R/W = 0.125, has higher average values of convection heat transfer coefficient, and the better access of fluid to back of the tooth, correction, and reduction in areas with lower heat transfer behind the tooth are the reasons for this issue.

Average values of convection heat transfer coefficient based on Reynolds numbers in microchannel with R/W ratios and different nanoparticle volume fractions.
Figure 7 shows the ratio of pumping power in tooth microchannel compared to smooth microchannel in different Reynolds and different solid nanoparticle volume fractions. In the above figures, with a reduction in R/W ratio, the pumping power decreases. In the displayed modes, the slope of diagram R/W = 0 compared to other R/W diagrams has the highest value, and the reason is the obstruction of moving path of fluid and further increase in pressure drop compared to other R/W modes. With an increase in volume percentage of solid nanoparticle, the ratio of pumping power increases and the increase in fluid viscosity is the reason. The more the viscosity of the fluid, the more power is needed to move in the microchannel. According to Figure 7(a), it is obvious that the pumping power in a tooth microchannel with R/W = 0 mode and highest viscosity can increase to 6.5 times a smooth channel. With an increase in Reynolds number, the pumping power also increases. The reason is the velocity increase in higher Reynolds. Velocity increase causes volumetric flow rate, which itself causes the increase in pumping power.
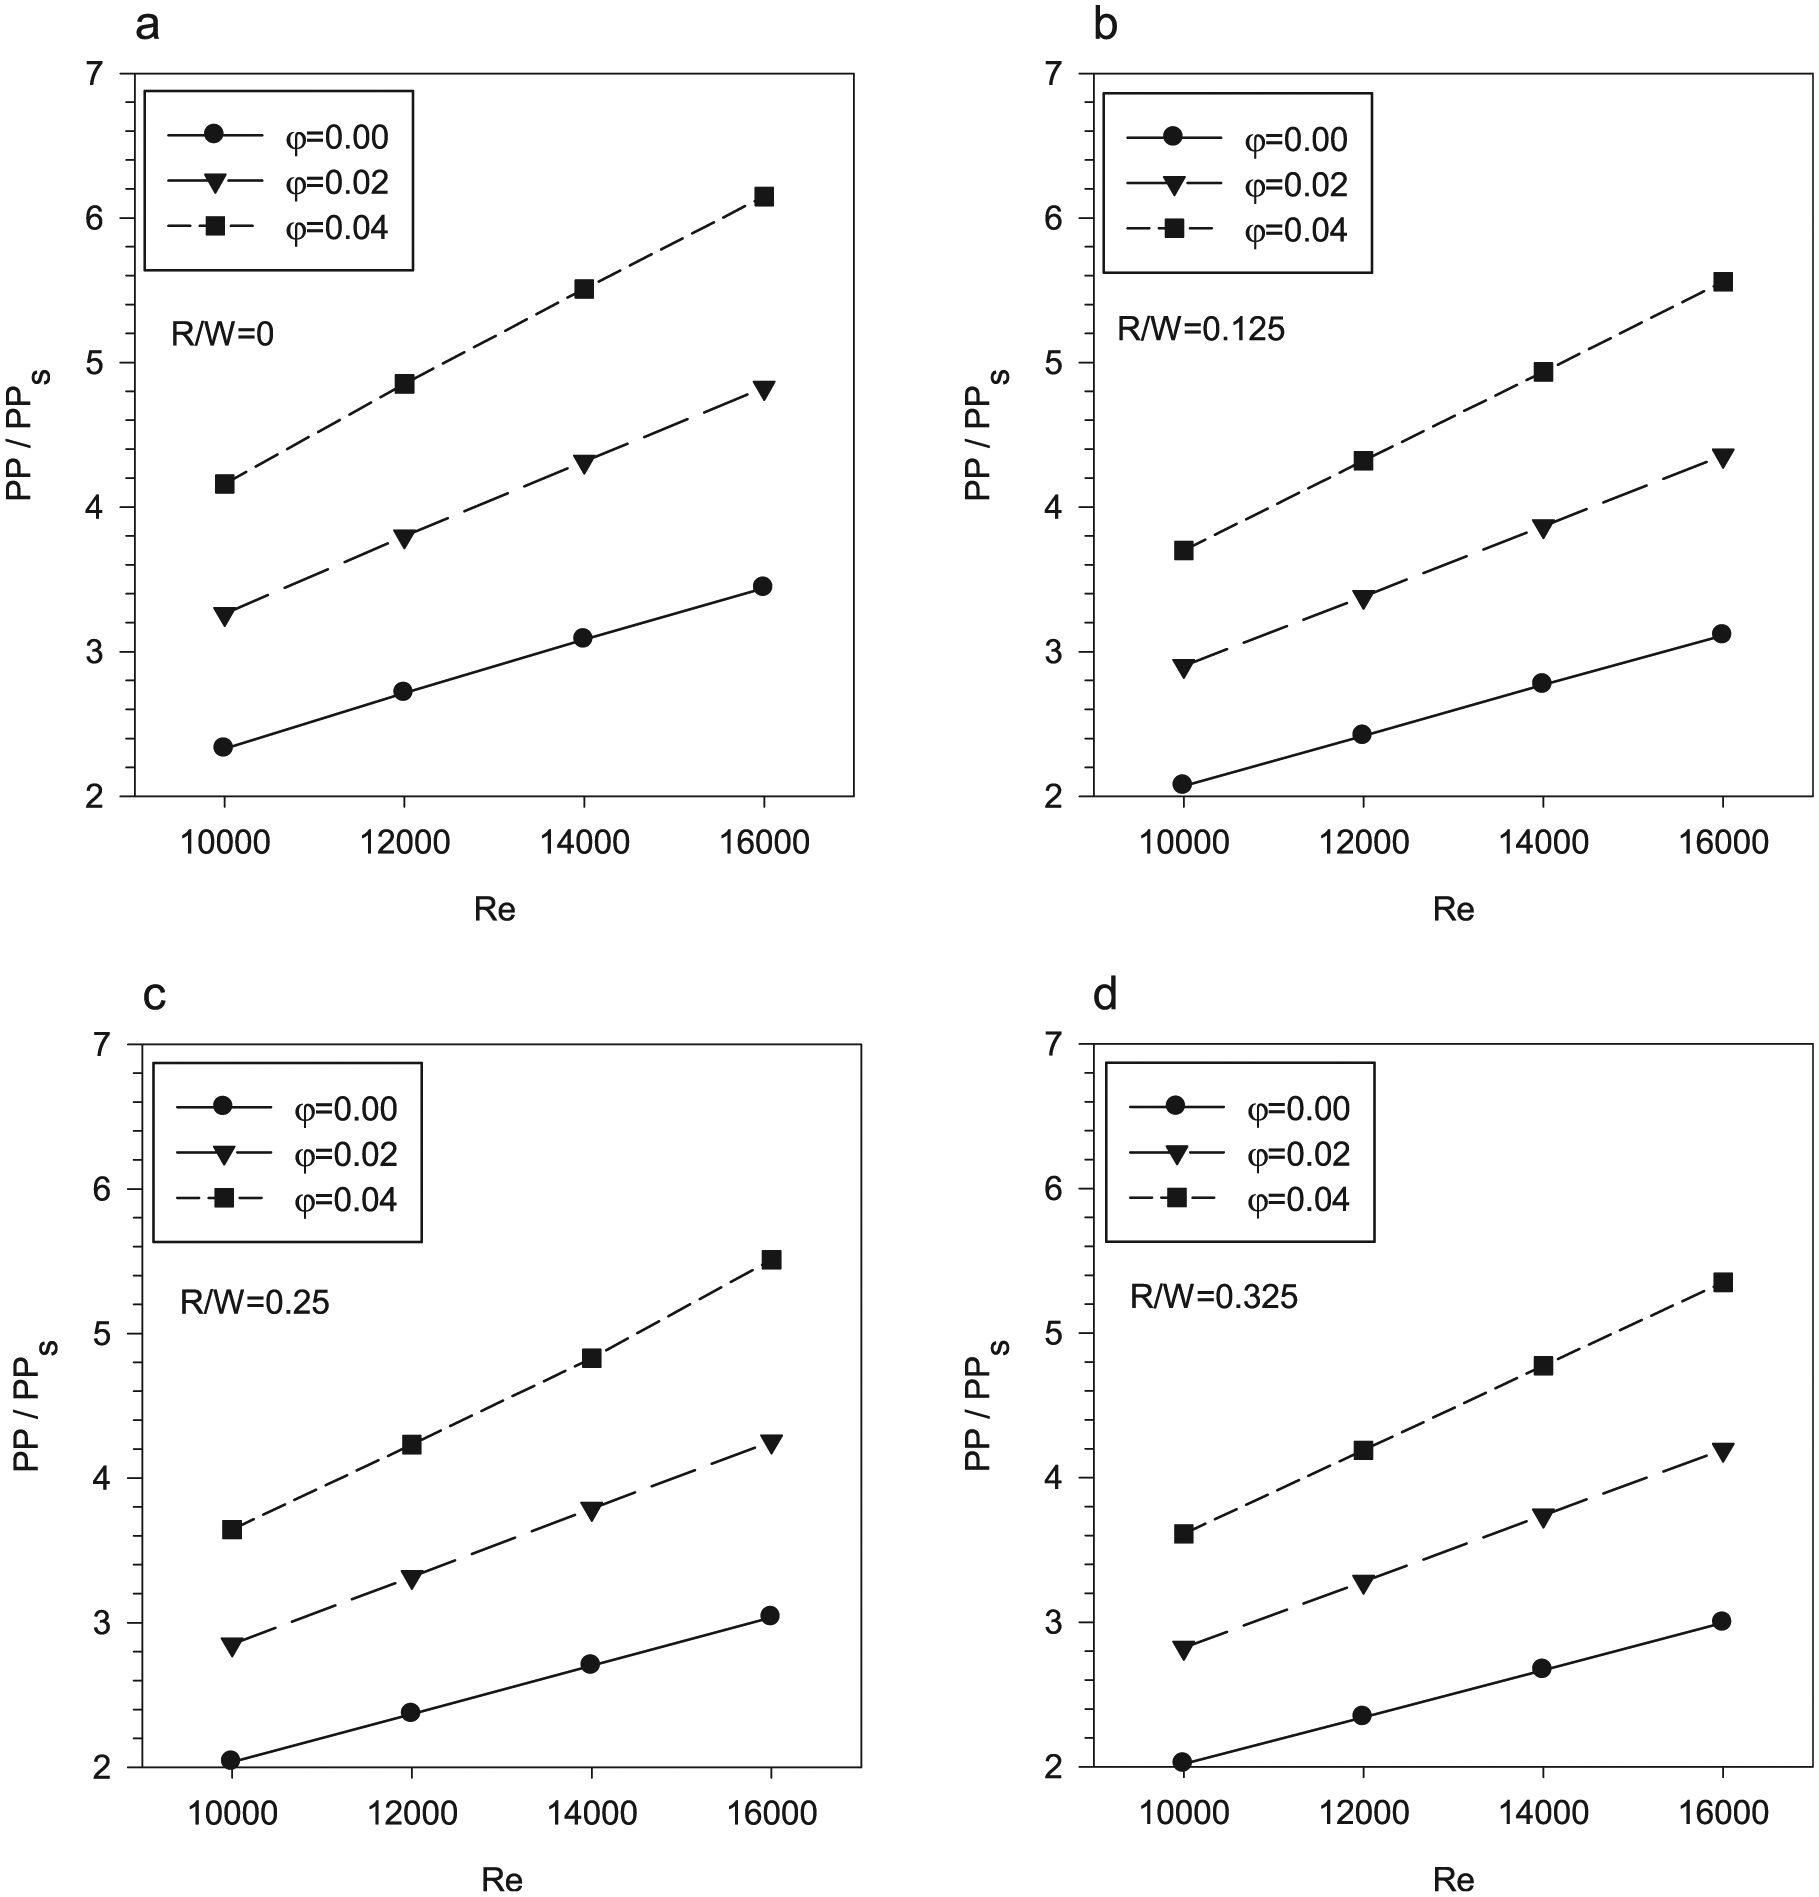
Diagram of pumping power ratio based on Reynolds number in tooth microchannel with different tooth R/W ratios and different volume fractions of solid nanoparticle.
Figure 8 demonstrates the Poiseuille values for the microchannel with different R/W tooth ratios in different volume fractions of 0%, 2%, and 4% nanoparticle and Reynolds number range of 10,000–16,000. In all R/W modes, with an increase in Reynolds number and nanoparticle volume fraction, the Poiseuille value increases. The reason for this phenomenon is the increase in volumetric percentage of nanoparticle that increases the shear rate in microchannel walls and increases the pressure drop and coefficient of friction that finally lead to an increase in Poiseuille number. It is seen that among the investigated R/Ws, with an increase in R/W ratio, the Poiseuille number decreases. Among the investigated R/Ws, the change slope of Poiseuille number in R/W = 0 mode for all nanoparticle volume fractions and Reynolds numbers is higher compared to other R/W modes. The reason is more obstruction of microchannel because of the existence of fully attached rib on fluid path, which leads to more increase in pressure drop and coefficient of friction that finally increases the Poiseuille number more compared to other modes.

Poiseuille number values based on Reynolds numbers in microchannel with different nanoparticle R/W ratios and volume fractions.
Among other modes of R/W, tooth with R/W = 0.325 ratio has the lowest Poiseuille. The reason is the flow of part of fluid from wider edges of teeth compared to other R/W modes, and that this kind of teeth has less resistance against fluid flow, which considerably affects the reduction in Poiseuille value in this tooth mode.
Figure 9 shows the average convection heat transfer coefficient in different R/W modes in various Reynolds. According to Figure 9(a)–(d), with an increase in Reynolds number in all R/W modes, the average convection heat transfer coefficient increases substantially, which is because of an increase in fluid velocity parameter. In all Reynolds numbers and examined R/W modes, R/W = 0 has a better trend in increase in the average convection heat transfer coefficient. There is less difference in the average convection heat transfer coefficient for all R/W ratios to R/W = 0 mode in Reynolds number of 16,000. On the other hand, with an increase in solid nanoparticle volume fraction in working fluid, because of strengthening the guidance mechanisms and other micrometer heat transfer mechanisms, the average convection heat transfer coefficient increases. In all Reynolds numbers, it can be observed that nanofluid with the highest nanoparticle volume fraction has the highest heat transfer coefficient.
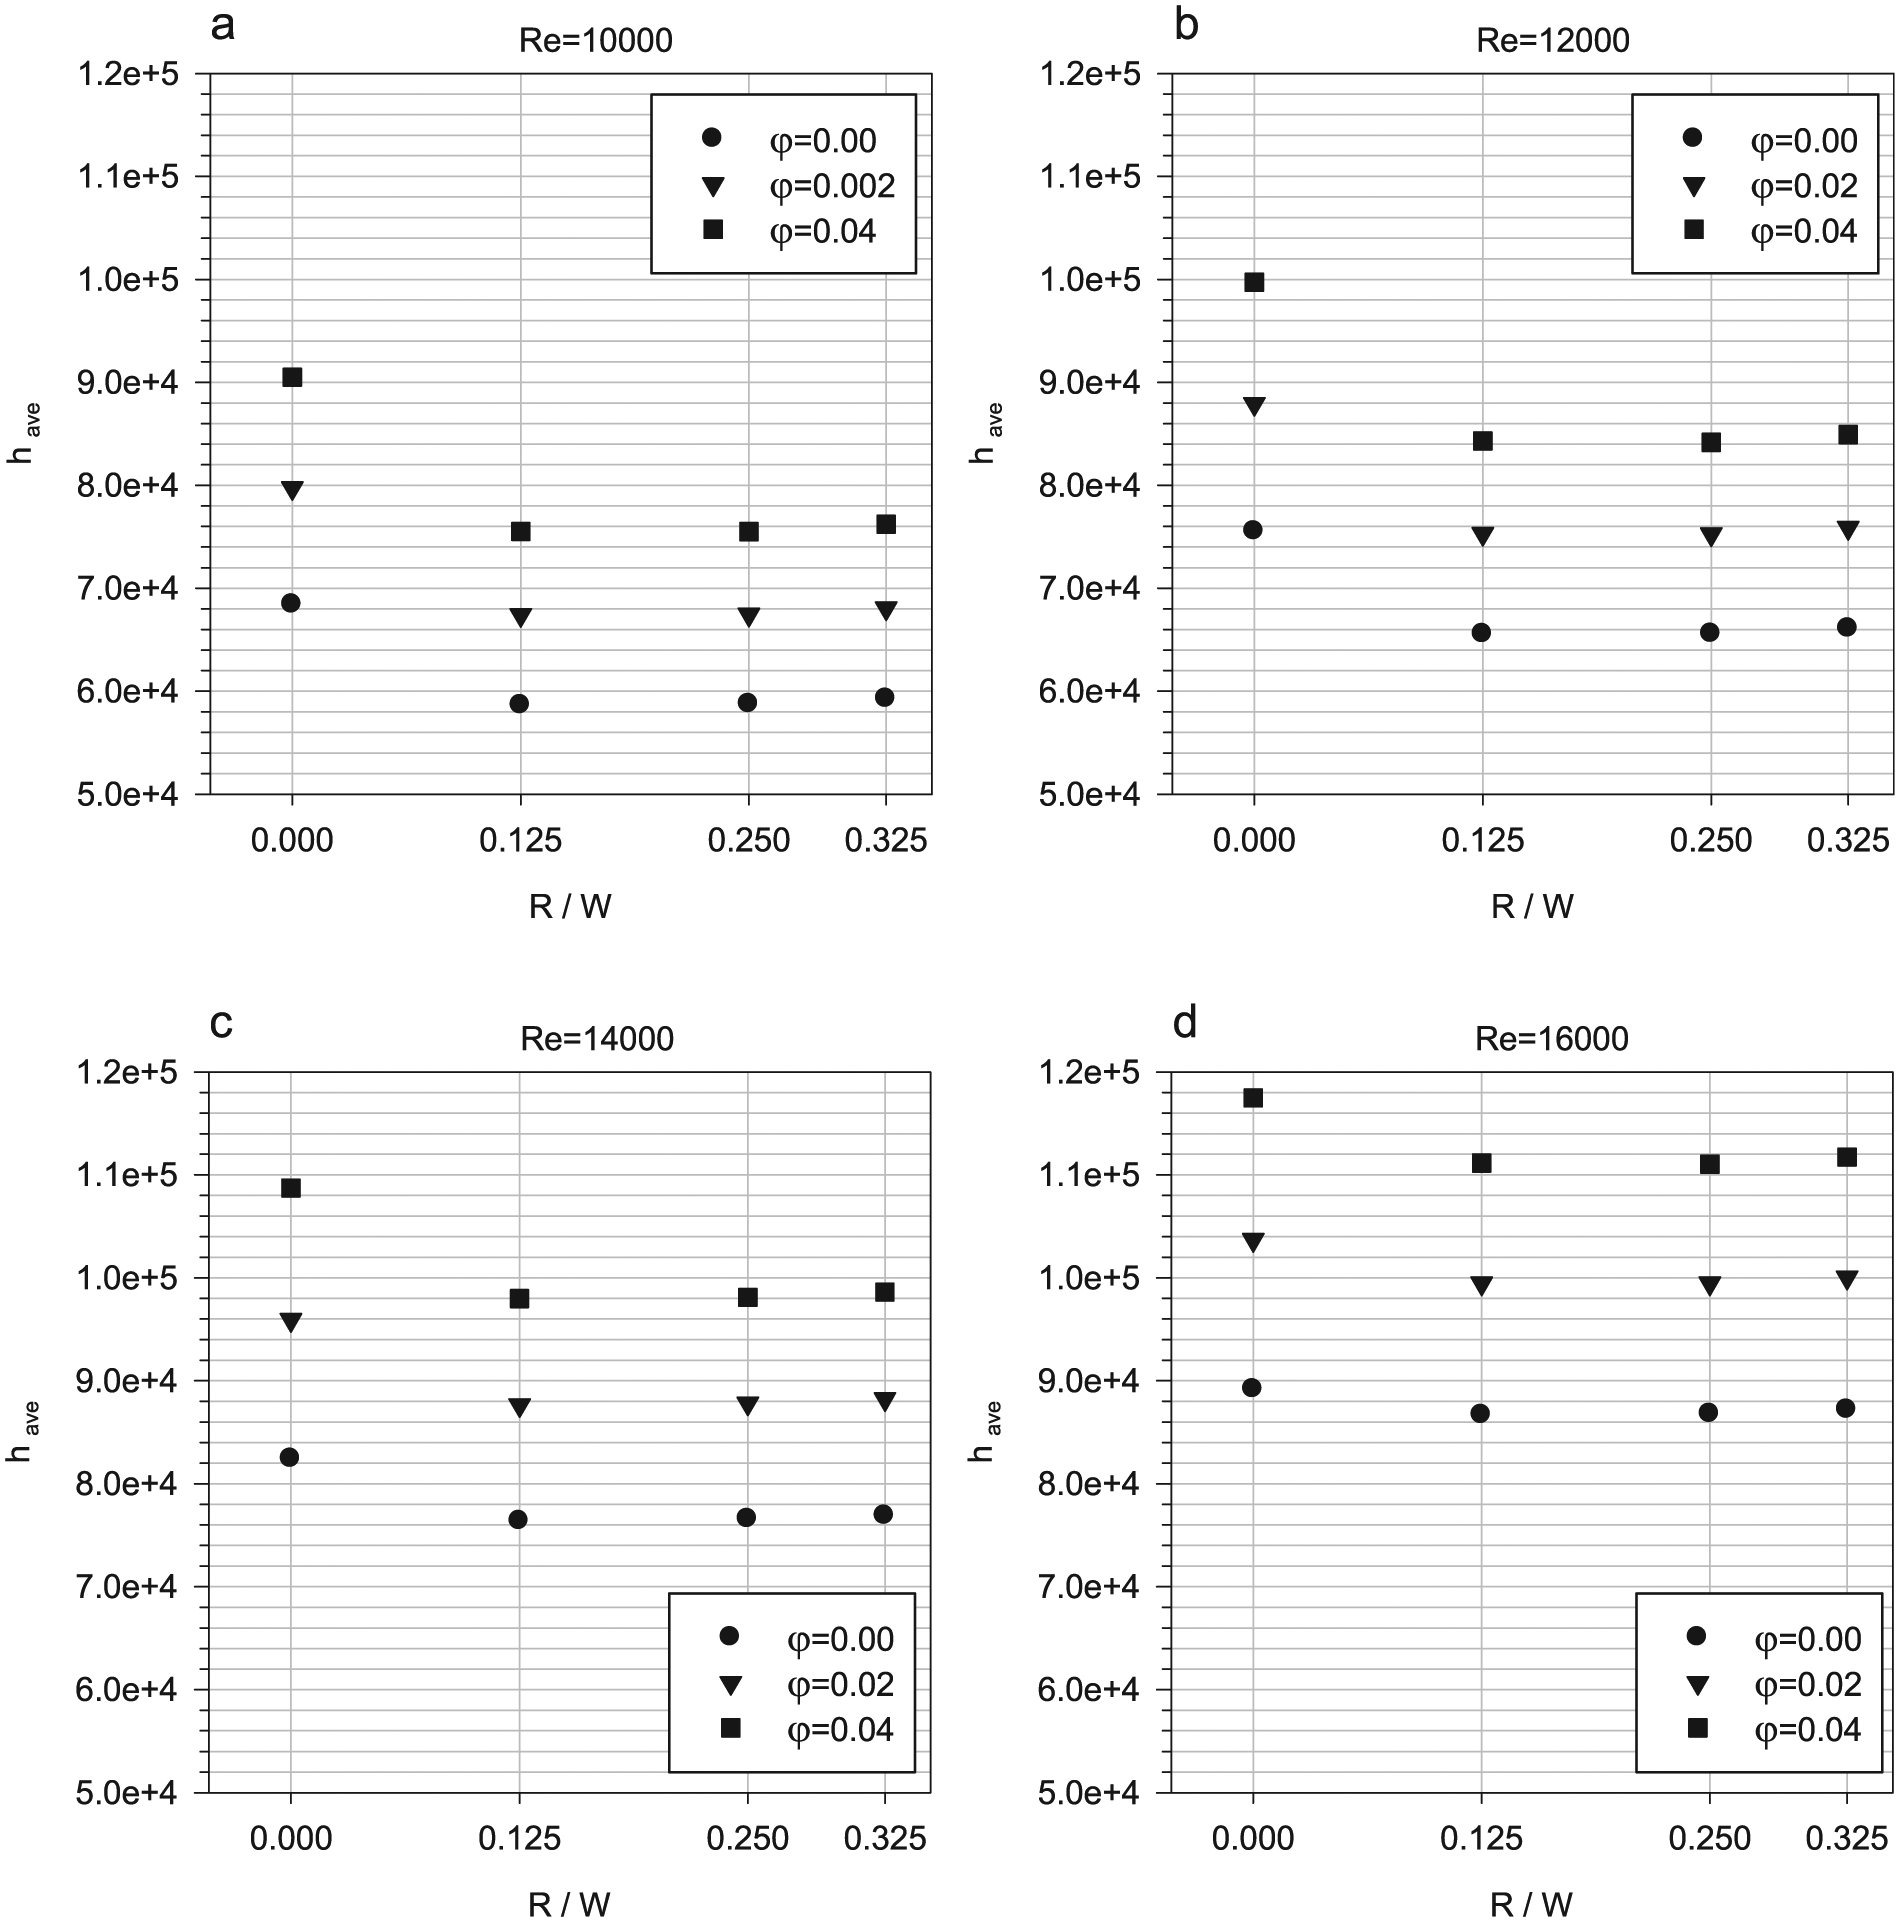
Diagram of the average convection heat transfer coefficient based on R/W ratio in Reynolds numbers and different nanoparticle volume fractions.
Figure 10(a)–(d) shows the average Nusselt values for smooth microchannel compared to tooth microchannel with different tooth R/W ratios in different volume fractions of 0%, 2%, and 4% nanoparticle and Reynolds number range of 10,000–16,000. It can be observed that the average Nusselt ratio in 10,000 Reynolds number has increased outstandingly compared to other Reynolds numbers. The reason is the effect of creation of vortices and the effects of turbulence made by flow turbulence in lower Reynolds compared to higher Reynolds numbers. The comparison of average Nusselt value in R/W = 0 mode with other R/W modes in each Reynolds number shows the superiority of Nusselt number in R/W = 0 over other modes. The reason is the creation of stronger vortices by completely sticky tooth (R/W = 0) on microchannel surface, which itself causes better flow mixture in different layers of fluid and improves the Reynolds number. Among other examined modes of R/W, it is seen that in R/W = 0.325 mode, the average Nusselt ratio in comparison to R/W = 0.25 and R/W = 0.125 ratio in all Reynolds numbers is high. The reason is the improvement and reduction in areas with low heat transfer and better distribution of heat transfer in areas at the back of the tooth and the junction of the tooth and microchannel surface. For all R/W modes, with an increase in Reynolds number, the value of Nusselt decreases, and in higher Reynolds numbers, it is expected that the effects of rise in fluid momentum of created vortices by roughness and obstacles in the fluid damp the cooler. The creation of these vortices rises the heat transfer and damping of the vortices because of momentum increase in the cooling fluid in higher Reynolds numbers and closes the tooth microchannel behavior to smooth microchannel. According to the results presented in diagrams of Figure 10, it can be concluded that this unsuitable behavior can be improved, to some extent, using the tooth with more R/W.

Average Nusselt values based on Reynolds numbers in tooth microchannel with R/W ratios and different nanoparticle volume fractions.
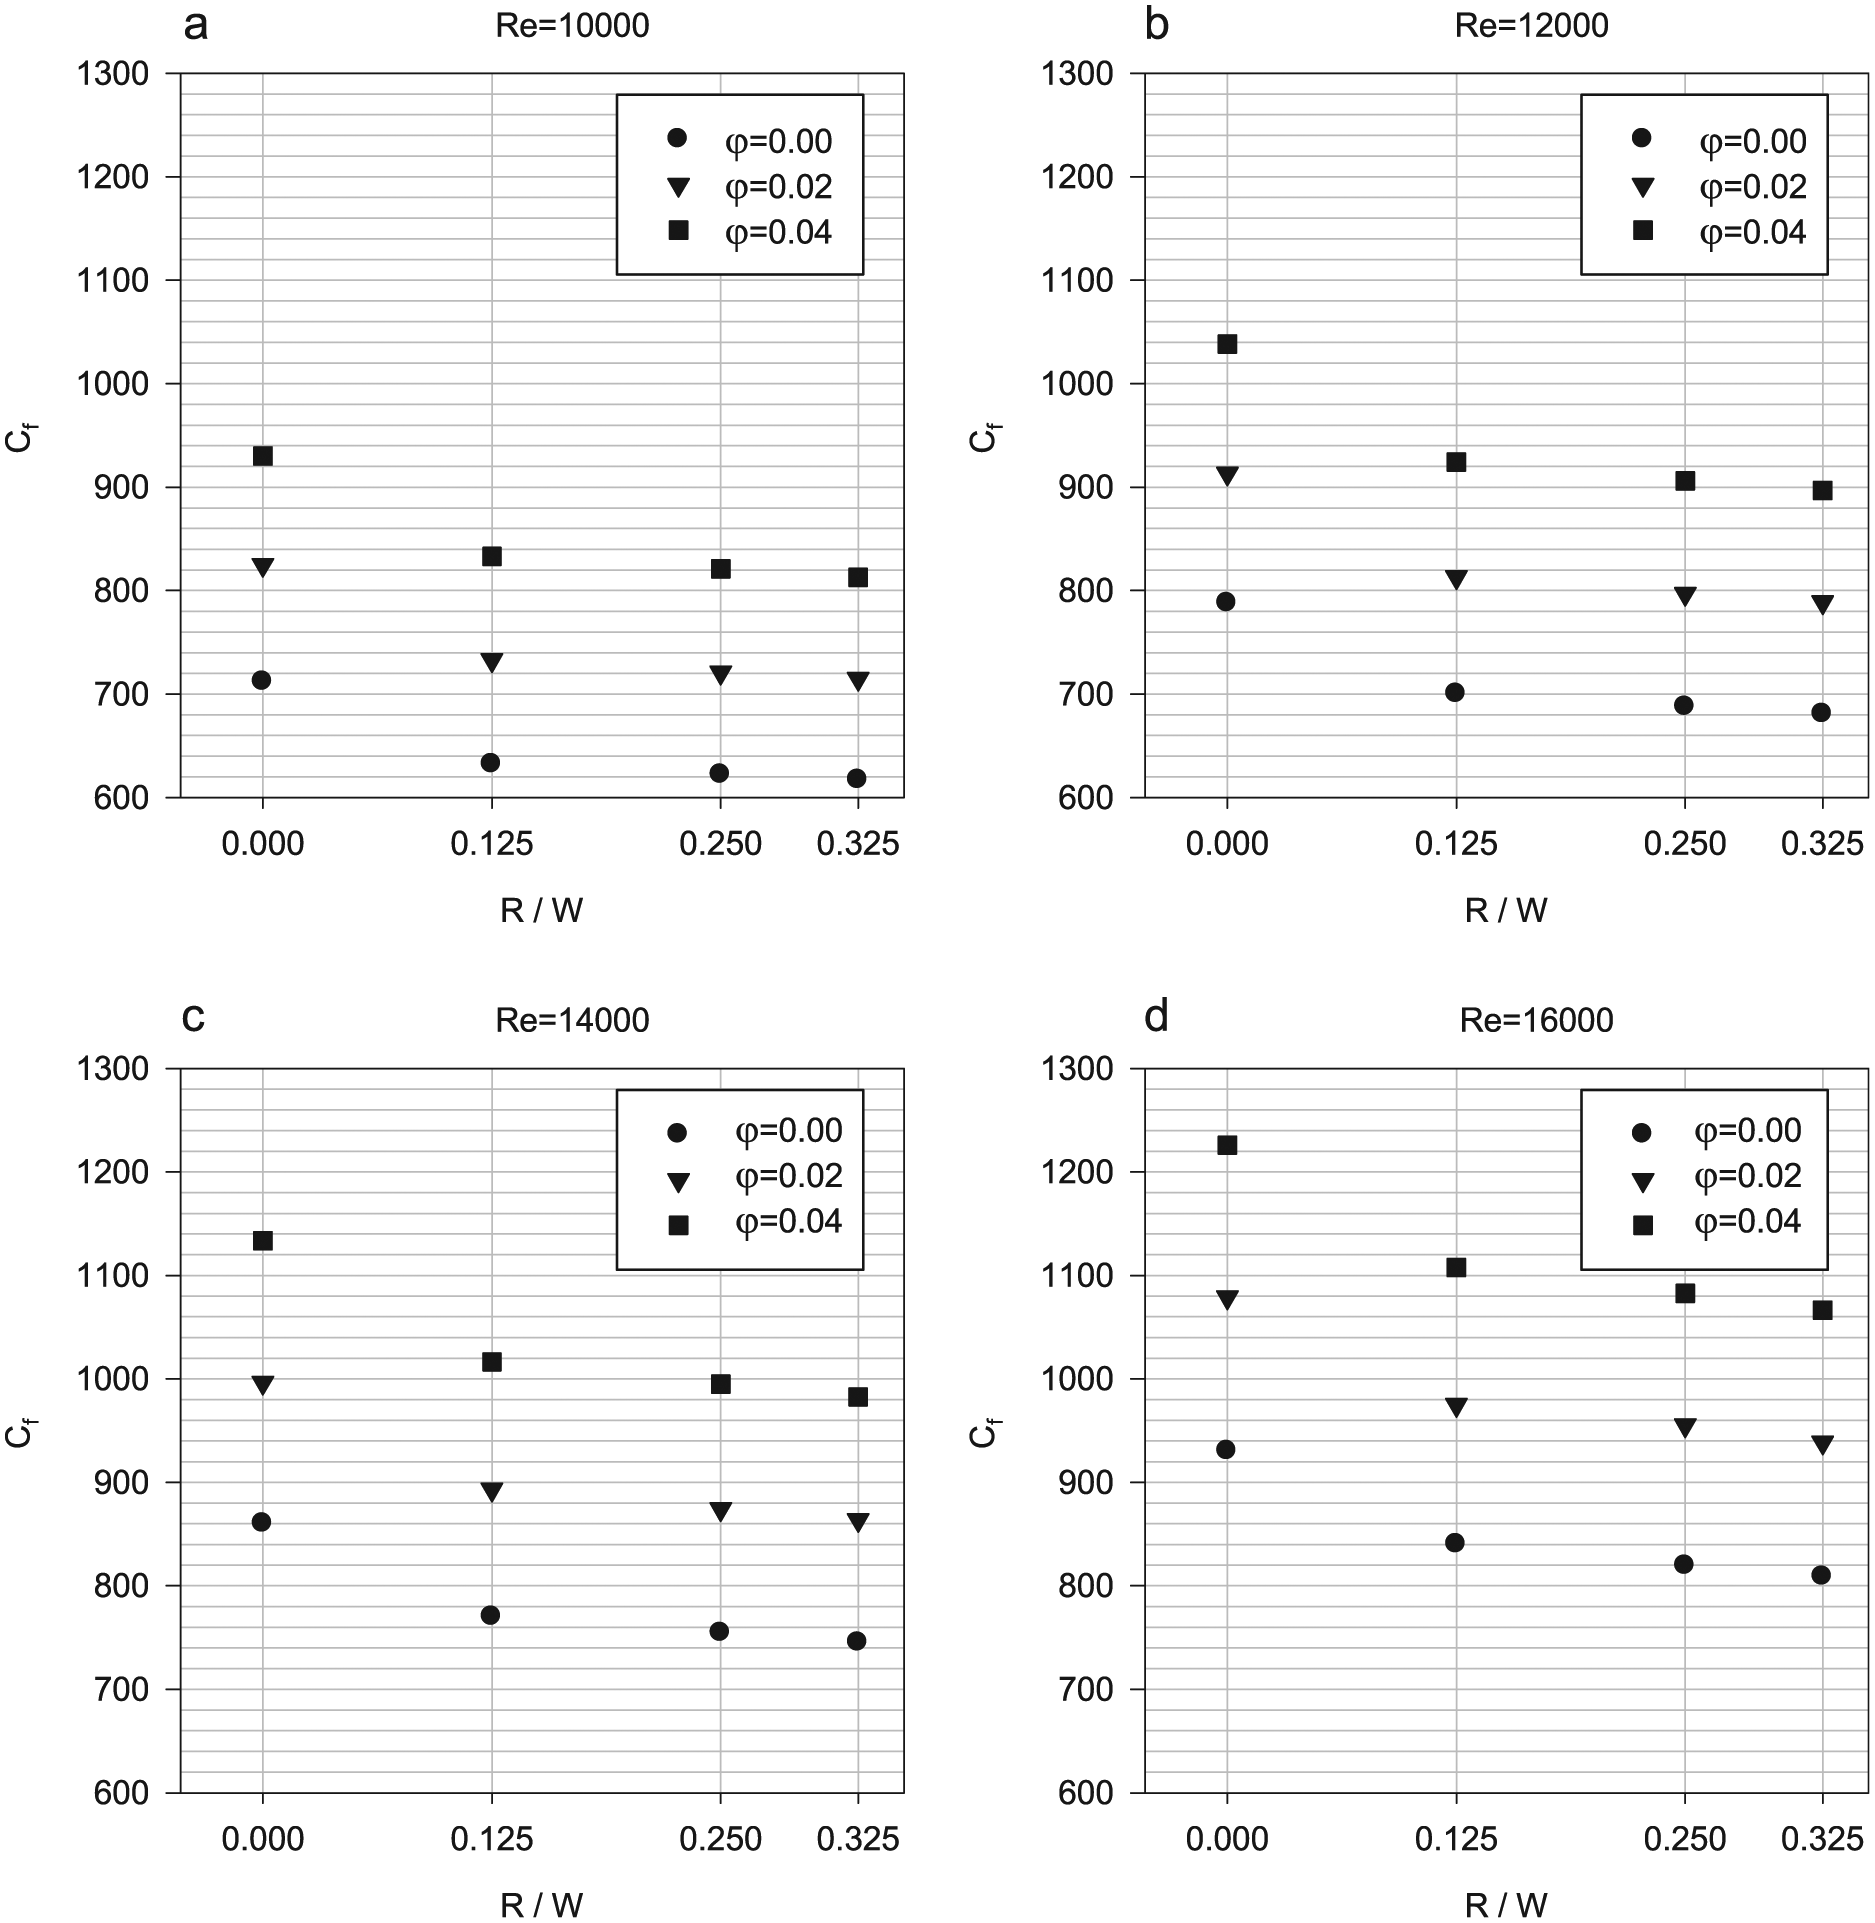
Figure 11(a)–(d) displays the coefficient of friction value for smooth microchannel in comparison to tooth microchannel with different tooth R/W ratios in different volume frictions of 0%, 2%, and 4% nanoparticle and Reynolds range of 10,000–16,000. It is obvious from the figure that in all R/W modes and all examined Reynolds values, the coefficient of friction increases with the increase in volume fraction of solid nanoparticle and the decrease in R/W ratio. The reason is the increase in viscosity with an increase in solid nanoparticle volume fraction in the cooling fluid that is accompanied by an increase in shear stress of microchannel walls. On the other hand, the existence of tooth with less R/W causes more pressure drop in fluid path, which itself has a significant impact on the increase in the coefficient of friction. In general, by moving coolant fluid between teeth, due to collision of the fluid with the teeth, the fluid velocity drops strongly. This deceleration increases the pressure drop in the fluid flow direction, which finally leads to an increase in coefficient of friction. The pressure drop in the toothed regions strongly depends on the ratio of R/W. By increasing the ratio of R/W, the cross-sectional surface of flow that passes through the bottom corners of the teeth increases and the fluid flow with lower resistance passes this path. If the fluid flow passes in the toothed regions with lower resistance, this results in a decrease in momentum fluid, and finally a decrease in the pressure drop and coefficient of friction will be followed. It also increases the volume fraction of the solid particles and increases the number of solid particle collisions with the surfaces of channels, thus increasing the friction coefficient. Due to above reasons, in all diagrams lowest coefficient of friction related to pure water, and the highest ratio of R/W is. In all R/W ratios and solid nanoparticle volume fractions, with an increase in Reynolds number, the coefficient of friction decreases; that is, with an increase in Reynolds number, the momentum fluid increases and the fluid tends to feel less resistance of the tooth existence on its path. It is observed that the impact of an increase in more R/W in lower Reynolds compared to higher ones has more effects on the reduction in coefficient of friction, and the reason is the fluid crossing the edge of tooth in lower Reynolds numbers. In general, by moving the coolant fluid between teeth, due to collision of the fluid with the teeth, the fluid velocity drops strongly. This deceleration causes an increase in the pressure drop in the fluid flow direction, which finally leads to an increase in coefficient of friction. The pressure drop in the toothed regions strongly depends on ratio of R/W. By increasing the ratio R/W, the cross-sectional surface of flow that passes through the bottom corners of the teeth increases and the fluid flow with lower resistance passes this path. If the fluid flow passes in the toothed regions with lower resistance, this results in a decrease in the momentum fluid, and finally a decrease in the pressure drop and coefficient of friction will be followed. It also increases the volume fraction of the solid particles and the number of solid particle collisions with the surfaces of channels, thus increasing the friction coefficient. For these reasons, in all diagrams lowest coefficient of friction related to pure water, and the highest ratio of R/W is.

Average coefficient of friction values based on R/W ratios in tooth microchannel in Reynolds numbers and different nanoparticle volume fractions.
Figure 12(a)–(d) shows the pressure drop values for tooth microchannel with different R/W tooth ratios compared to smooth microchannel in different volume fractions of 0%, 2%, and 4% nanoparticle and Reynolds number range of 10,000–16,000. In all examined R/Ws and Reynolds numbers in this research, it is observed that with an increase in solid nanoparticle volume fractions and R/W ratio reduction, the pressure drop in tooth channel increases compared to that of smooth channel. It can be observed that in all R/W tooth modes and solid nanoparticle volume fractions, the ratio of pressure drop decreases with an increase in Reynolds number. On the other hand, the existence of solid nanoparticle in the cooling fluid causes a significant rise in the pressure drop because of the movement of more viscous fluid compared to less viscous fluid.
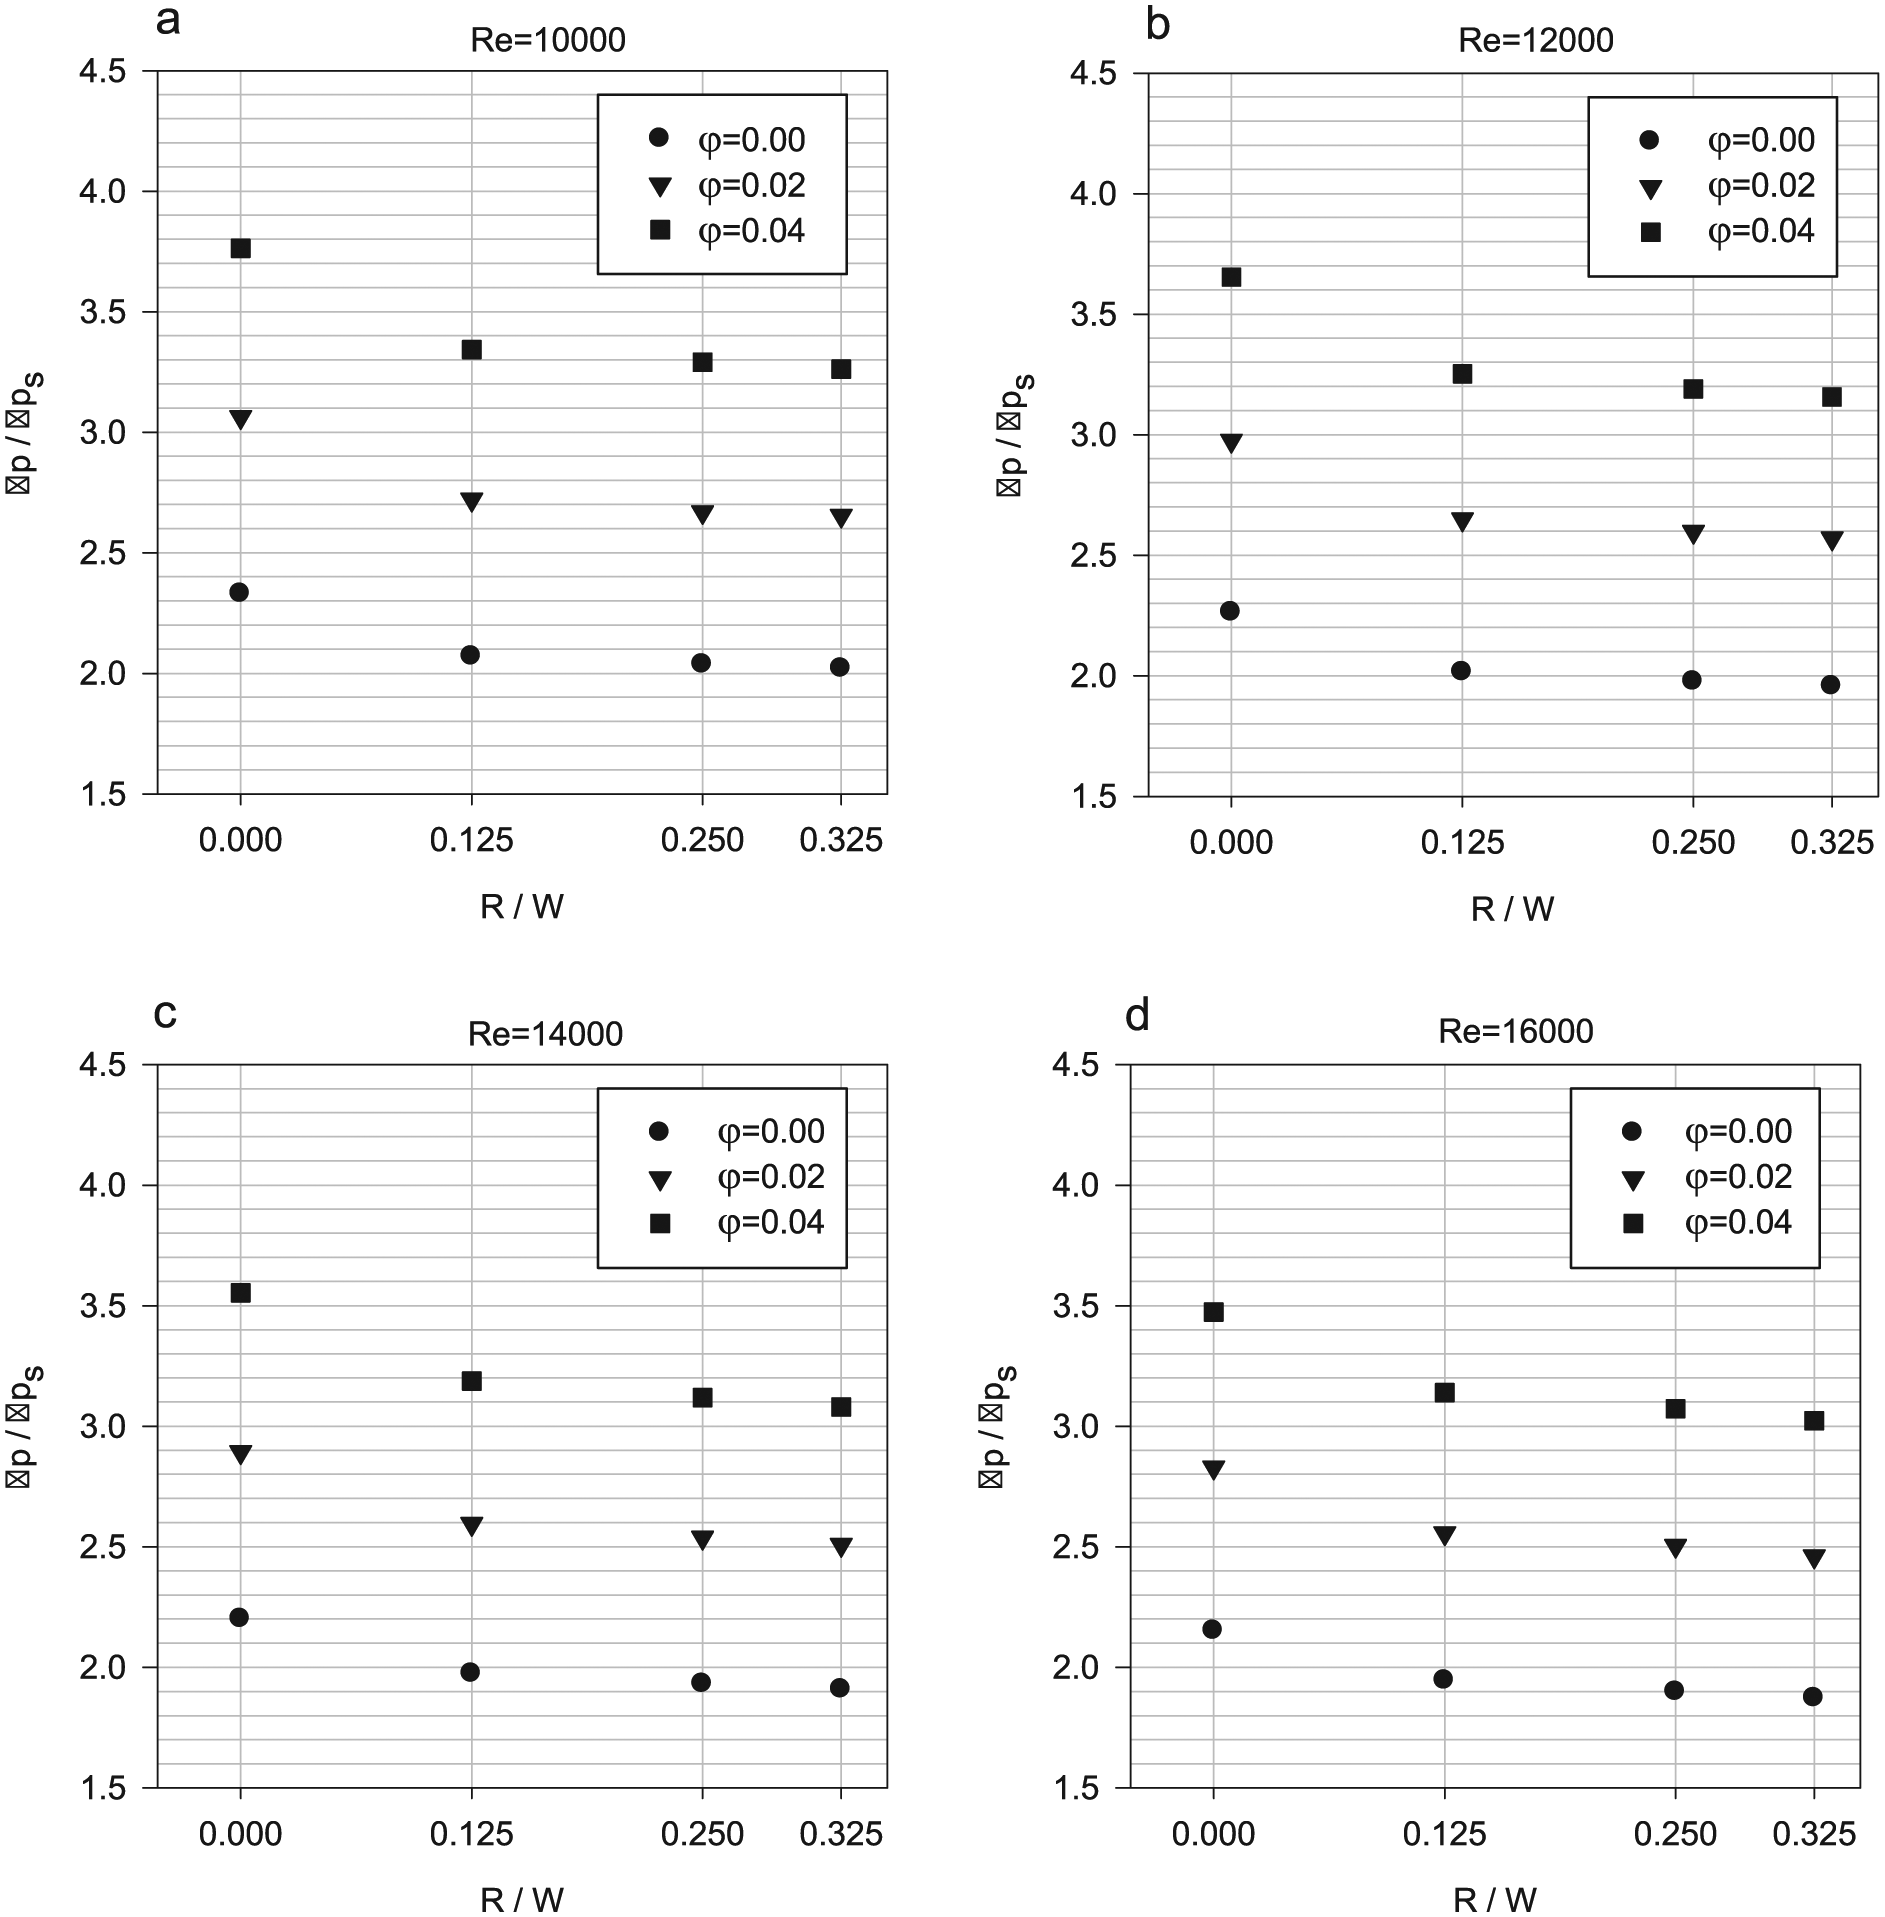
Pressure drop ratio based on R/W ratios in tooth microchannel in Reynolds numbers and different nanoparticle volume fractions.
In Figure 12(a), in lower Reynolds numbers, pressure drop in a tooth microchannel with R/W = 0 can increase 3.8 times a smooth channel. In the lowest mode, the R/W ratio increases about 3.2 times a smooth channel because of the easy movement of the fluid in microchannel ducts, meaning that using tooth with highest R/W, not only do we use the advantages of a tooth microchannel over those of R/W = 0 but also there will be less pressure drop compared to R/W = 0. To summarize, it can be said that the pressure drop in this problem increases by increasing the Reynolds number. But because the results are compared with toothless and smooth microchannels, at high Reynolds numbers, the effect of the indentation by the fluid flow is less. At higher Reynolds numbers, the fluid flow easily passes on the ribs and hydrodynamic behavior of the microchannel closer to the smooth microchannel hydrodynamic behavior. Overall, this figure explains the pressure drop in a ribbed microchannel compared to a smooth channel. Increasing the ratio of R/W increases the passing width cross section of the channel, and in the ribbed areas this factor reduces the pressure drop as well.
Figure 13(a)–(d) displays the Poiseuille changes in different R/W modes in different nanoparticle volume fractions in different Reynolds. In all the above diagrams, the amount of Poiseuille in all R/W modes increases with a rise in Reynolds number and nanoparticle volume fraction. The reason is an increase in viscosity and velocity of fluid. In different modes of R/W, in all Reynolds, with an increase in R/W ratio, the Poiseuille decreases. The reason is the fluid moving in the created areas at the tooth edges, and it is seen that in R/W = 0.325, because of narrowness of the path, the fluid flow has less obstruction in tooth edges among all R/W modes. Because of many obstructions in fluid flow path, the R/W = 0 ratio causes increased contact of fluid with the surface, which itself has a great impact in Poiseuille value rise.
Poiseuille diagram in tooth microchannel based on R/W tooth ratio in Reynolds numbers and different tooth volume fractions.
In Figure 14(a)–(d), the pumping power in a tooth channel with different R/Ws in a tooth channel compared to a smooth one in different volume fractions and Reynolds was evaluated. For all R/W ratios and all Reynolds numbers, it is seen that with a decrease in R/W ratio and an increase in solid nanoparticle fraction, the amount of pumping power increases. The reason is the existence of the nanoparticles in the cooling fluid that increases the viscosity and density of the cooler to a great extent, and the fluid with higher density and viscosity needs more pumping power in order to move along the channel. In addition, the existence of teeth with lower R/W shows more resistance against fluid moving. On the other hand, with an increase in Reynolds in all R/W modes, the pumping power increases. The reason is the necessity of higher pumping power in higher Reynolds to assure the cooling fluid velocity. The PEC is an important parameter in examining the Nusselt number and coefficient of friction compared to a smooth microchannel. By investigating this parameter, we can find out that the impact of using teeth and roughness is the increase in heat transfer or increase in coefficient of friction. According to the parameter of PEC, we can determine the governing impact of heat transfer or coefficient of friction in nanofluid flow of computational dynamic fluid.

Diagram of pumping power ratio based on R/W ratios in Reynolds numbers and different nanoparticle volume fractions.
Figure 15(a)–(d) evaluates the amount of PEC in tooth microchannel with different tooth R/W ratios in different volume fractions of 0%, 2%, and 4% nanoparticle and Reynolds number range of 10,000–16,000. It can be concluded from the findings that in lower Reynolds, the existence of a tooth with R/W = 0 has the highest thermal-fluid efficiency, which decreases with an increase in Reynolds number. The reason is the importance of creation of more confusion and stronger vortices by tooth in R/W = 0 mode in lower Reynolds. The creation of more confusion in higher Reynolds numbers by tooth with R/W = 0 ratio has lower impact than lower Reynolds because the flow in higher Reynolds ejects most of the vortices because of more momentum that causes the reduction in thermal-fluid performance in this ratio of tooth in higher Reynolds.
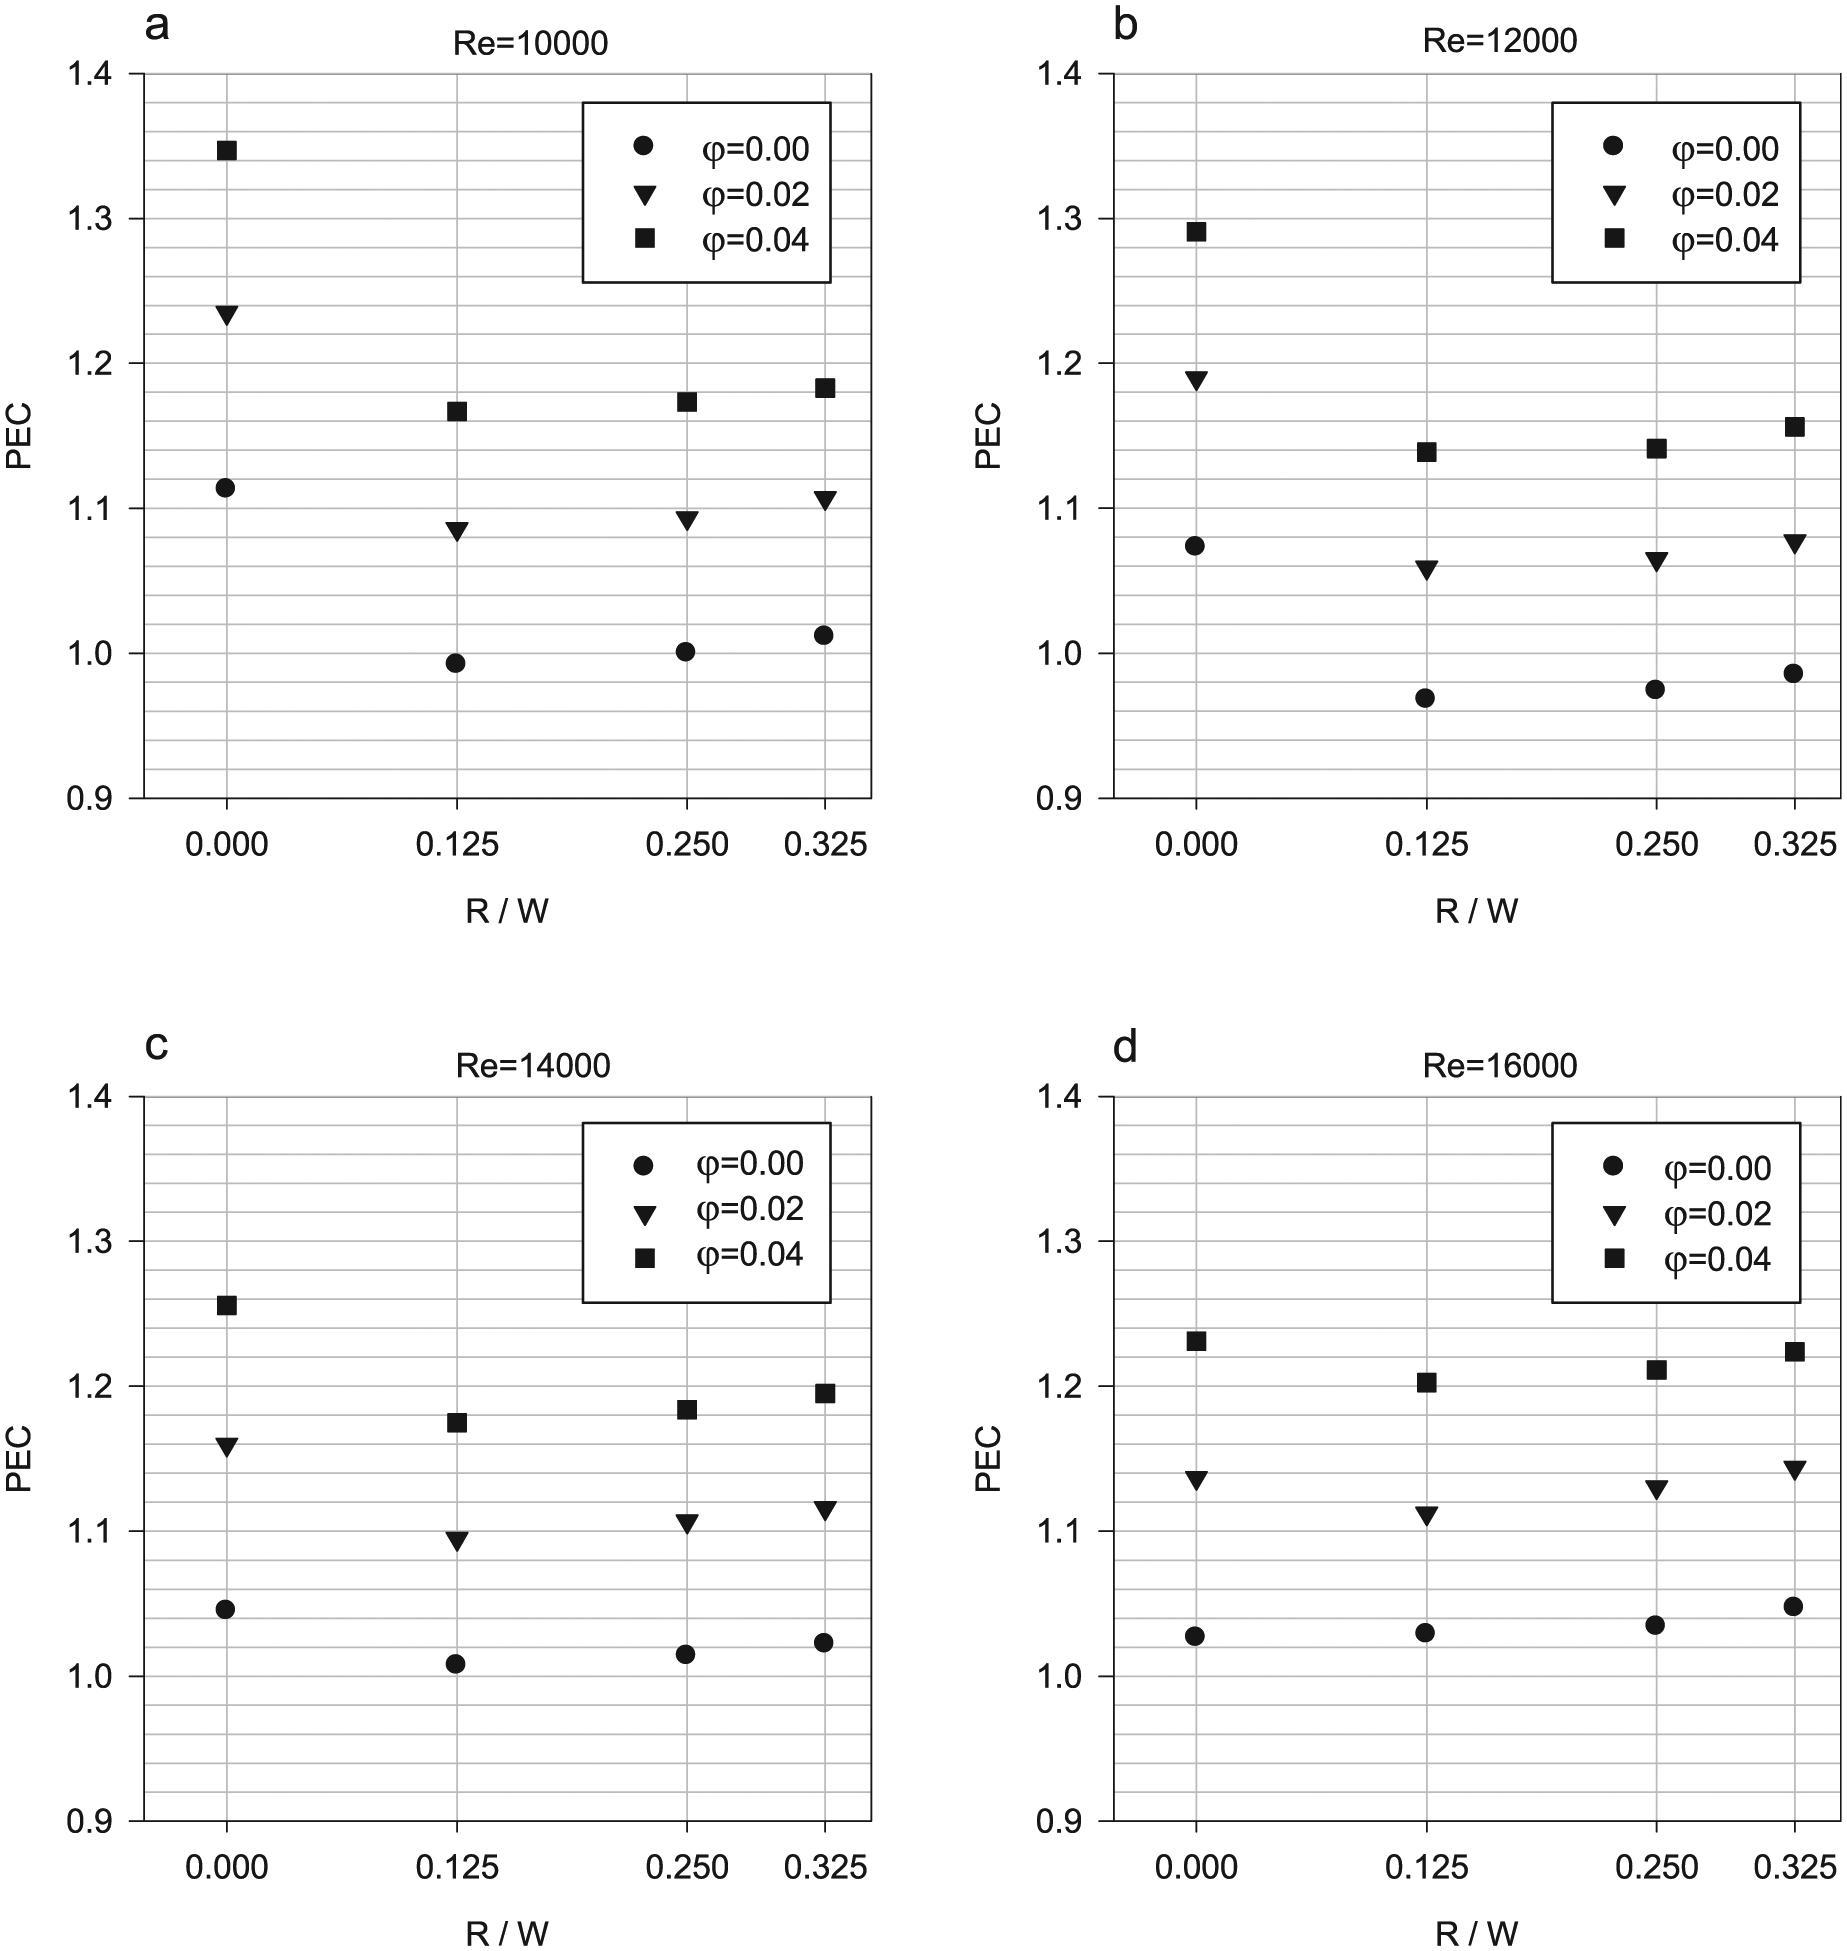
Diagram of performance evaluation criterion based on R/W ratios in tooth microchannel and different nanoparticle volume fractions and Reynolds numbers.
On the other hand, the existence of tooth with higher R/W ratio in higher Reynolds has higher PEC compared to lower Reynolds because of correction with lower heat transfer at the back of the tooth, and because of better access of fluid to all areas behind the tooth. In addition, besides the mentioned issues for the tooth with R/W > 0 with an increase in this ratio in all Reynolds numbers, and considering the described diagrams, the pressure drop decreases, which has a great impact on increasing the thermal-fluid efficiency. According to Figure 15(d), in higher Reynolds, using tooth with R/W = 0.325 and volume fraction of 4% nanoparticle, the PEC of about PEC = 1.2 and tooth mode of R/W = 0 can be obtained. It means that the existence of tooth with higher R/W and higher volume fraction of the solid nanoparticle in 16,000 Reynolds number in this research increases the PEC of tooth channel with pressure drop in pumping power and lower coefficient of fraction compared to microchannel with tooth ratio of R/W = 0. This is one of the main advantages of utilizing and examining the semi-attached rib in this study. Use of tooth to increase heat transfer has a great impact on heat transfer performance in channels and microchannels. Using full or completely adherent tooth to surface increases the coefficient of friction because of more obstruction of the channel by tooth, and because of an increase in hot areas or areas with lower heat transfer (lower heat transfer areas (LHTAs)). In order to improve the mentioned flaws, half-adherent tooth design can be used instead of completely adherent tooth.
Figures 16 and 17 display the hot areas created in edges and at the back and junctions of tooth to surface for the Reynolds number of 10,000 and volume fraction of 4% nanoparticle.

Average Nusselt number diagram for the Reynolds number of 10,000 and volume fraction of 4% solid nanoparticle: (a) R/W = 0 and (b) R/W = 0.125.
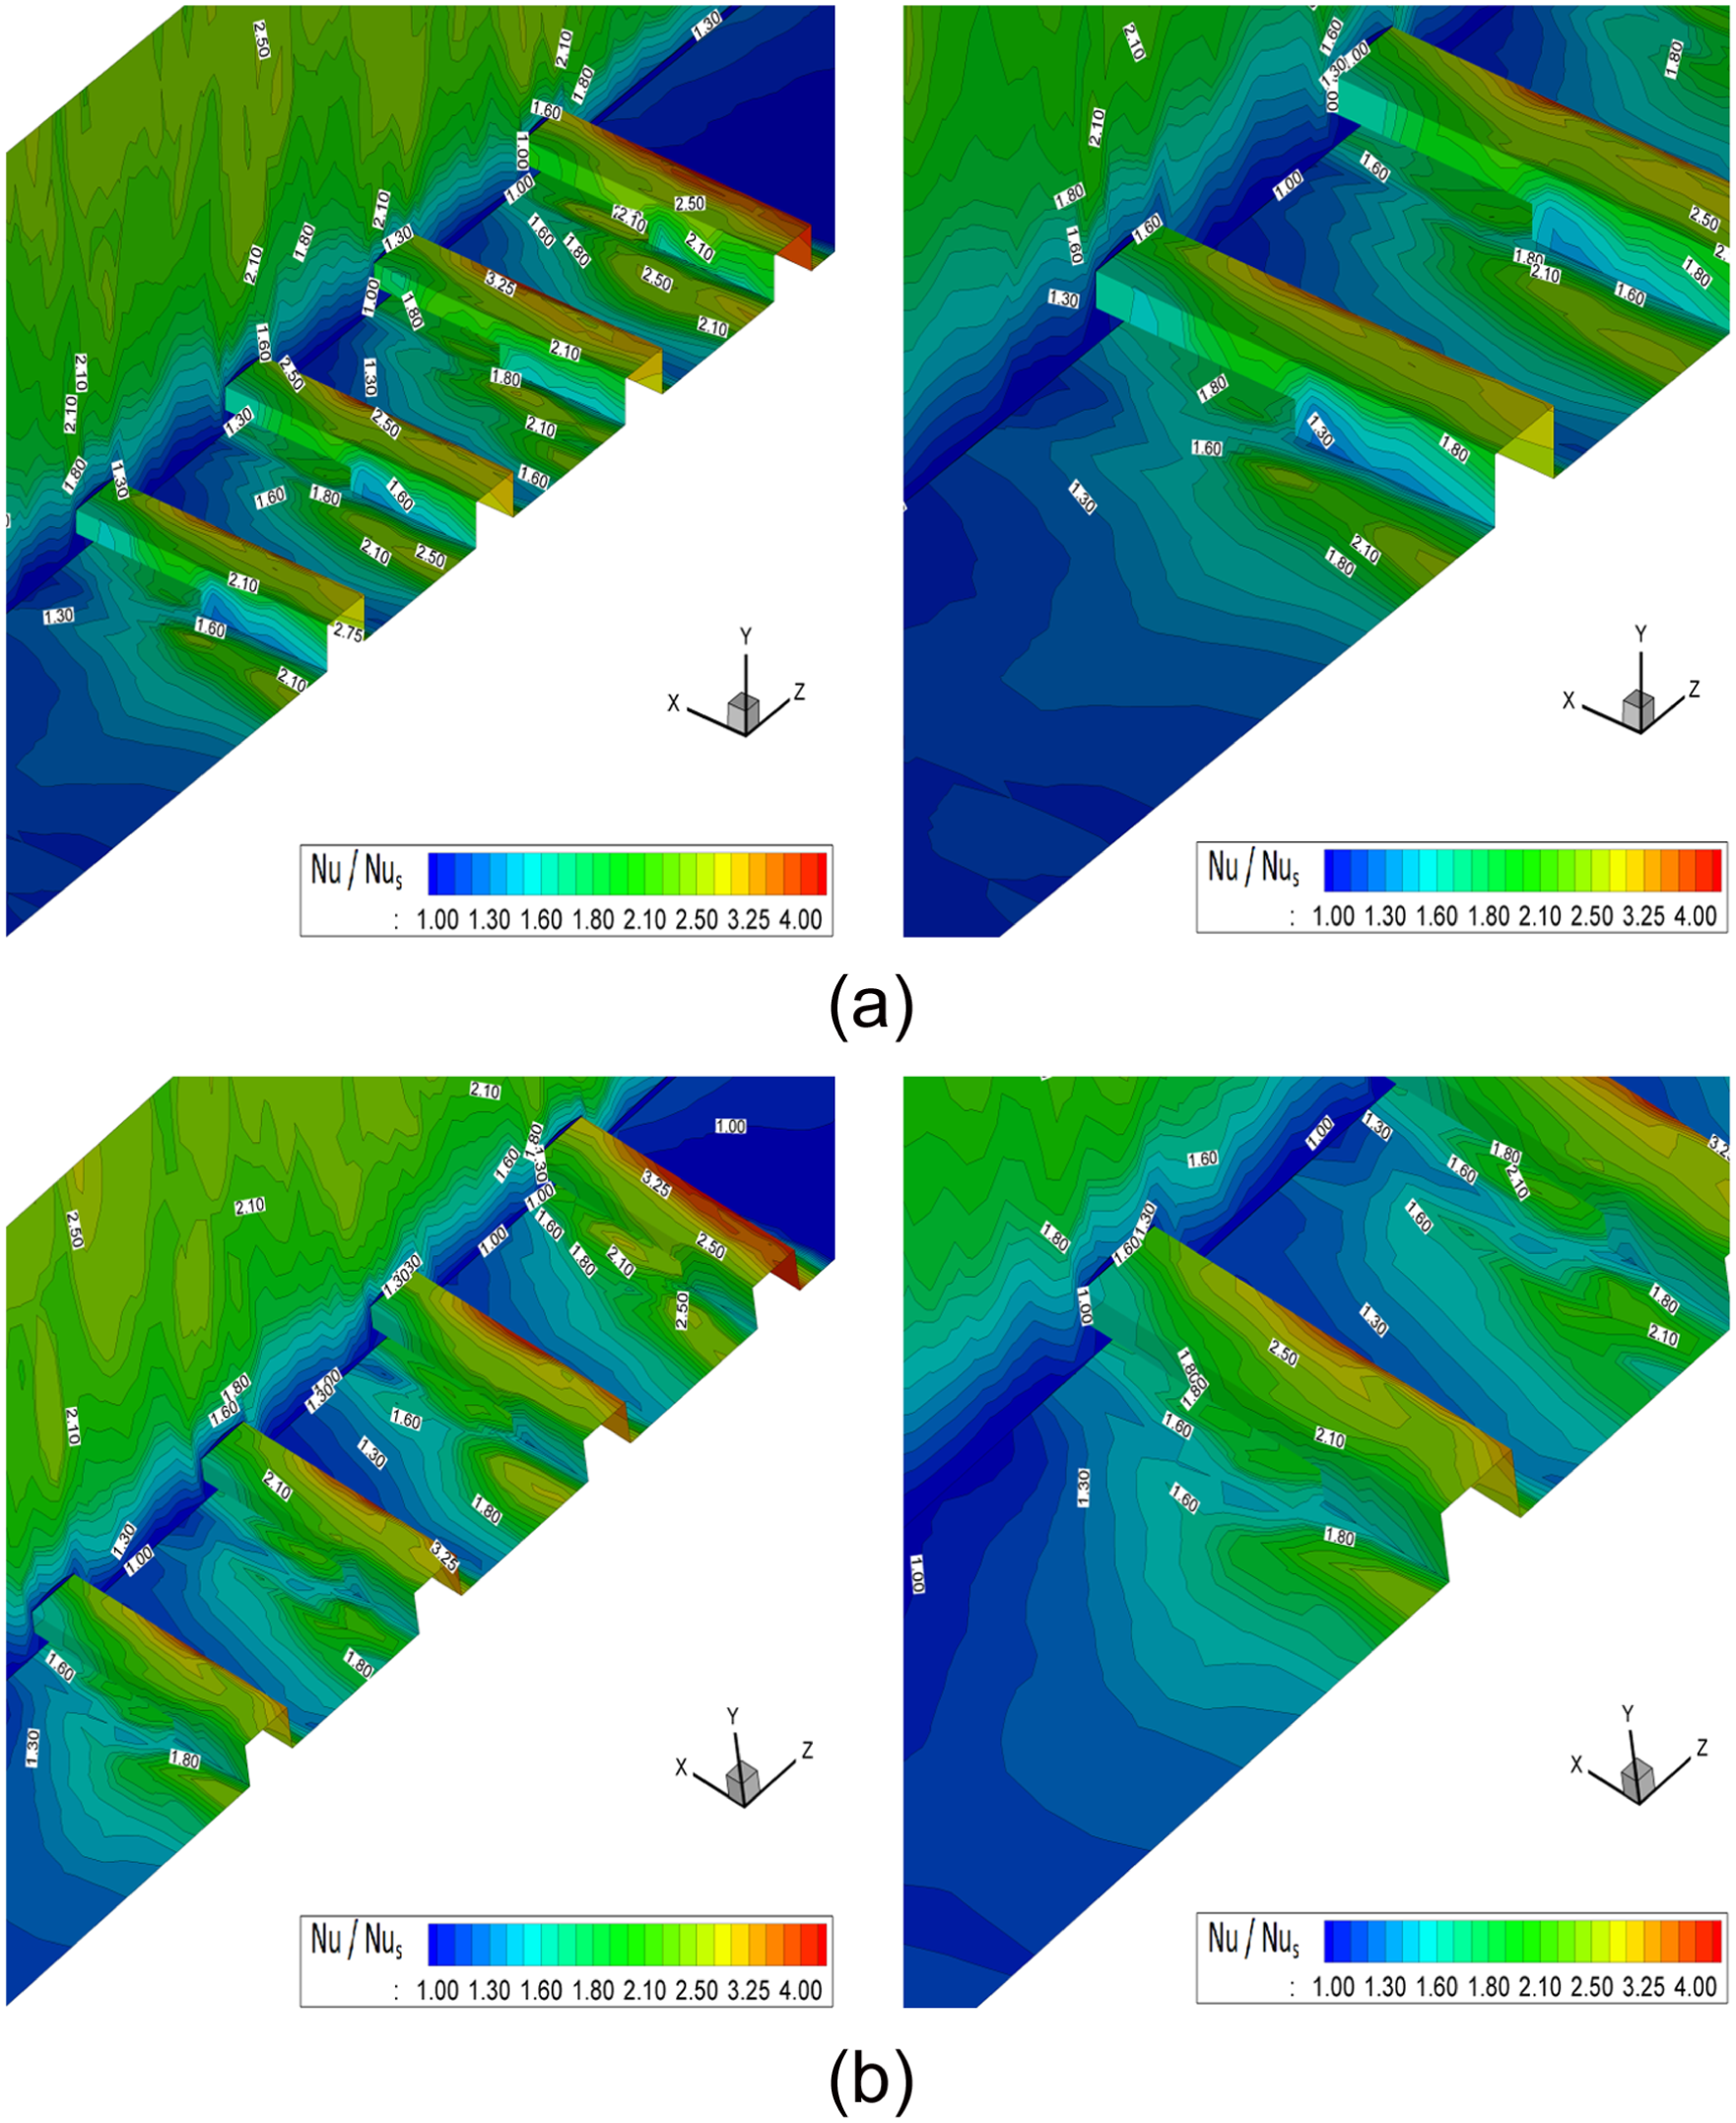
Average Nusselt number diagram for the Reynolds number of 10,000 and volume fraction of 4% solid nanoparticle: (a) R/W = 0.25 and (b) R/W = 0.325.
Figure 18 displays the static pressure contours in the length of the microchannel (in cross section of microchannel and the middle of the tooth). Due to the fluid impact on the tooth, the fluid velocity declined and the pressure increased. After the passage of fluid from the edges of the teeth, because of the decrease in the microchannel cross section of the tooth, the fluid velocity increases. The amount of fluid pressure in collisions with teeth, with a reduction in the ratio of R/W, increases; it is due to the increased impact on the surface fluid with the tooth, in the case of the smaller R/W.
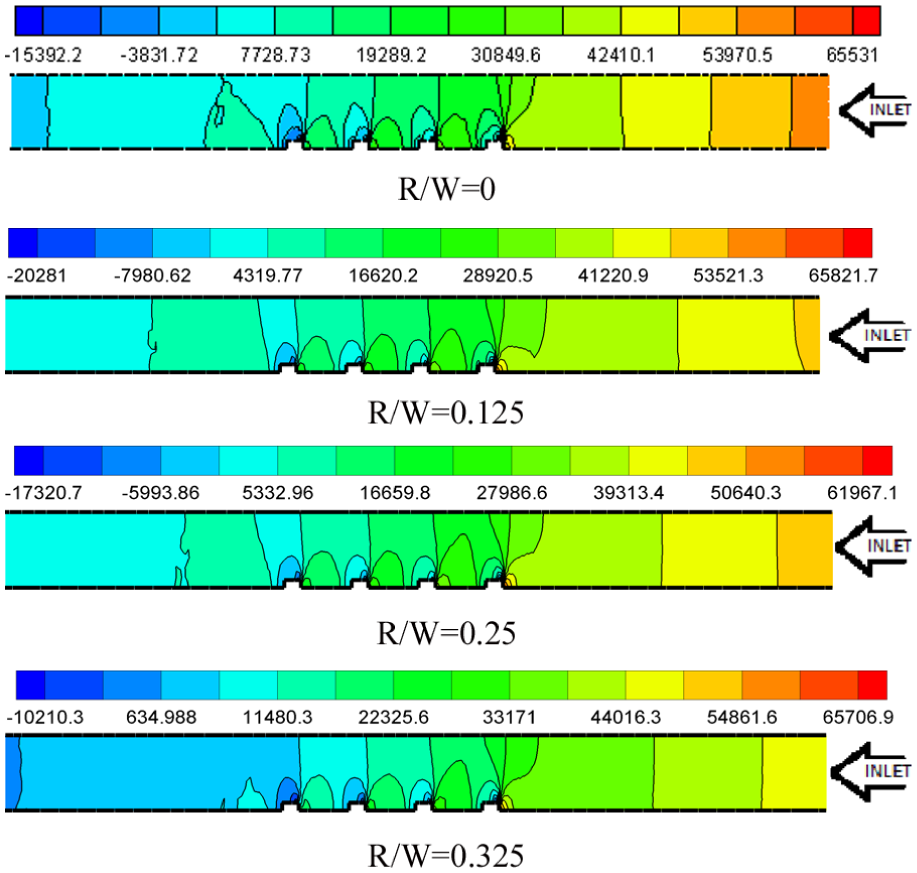
Static pressure contours in 4% volume fraction of solid nanoparticles and Reynolds number of 10,000.
Conclusion
In this study, the forced convection heat transfer of copper oxide-water nanofluid in a rectangular three-dimensional microchannel under a constant heat flux was examined using a numerical method. The impact of volume percentage of solid nanoparticle on Reynolds numbers, R/W tooth ratio on flow field, temperature, and heat transfer rate was investigated. In this research, it can be concluded that using tooth with higher R/W in higher Reynolds in average Nusselt ratios and average heat transfer coefficient has better performance than a full tooth. The impact of using tooth with R/W = 0 in lower Reynolds is more obvious. Utilizing tooth with R/W = 0 compared to other tooth has higher coefficient of friction, pressure drop, and pumping power, and creation of areas with lower heat transfer at the back of tooth and tooth junctions to the surface is the flaw of using this kind of tooth. Using tooth with 0 < R/W ≤ 0.325 in this research shows that in producing stronger vortices that cause better turbulence of fluid layers, these teeth perform weaker than tooth in R/W = 0 ratio. However, the major advantage of using tooth with 0 < R/W ≤ 0.325 is a substantial increase in heat transfer. In other words, in these teeth ratio, the hot areas with lower heat transfer at the back of tooth are corrected or removed to some extent. In addition, with an increase in R/W ratio in these teeth, the pumping power, coefficient of friction, and pressure drop are largely reduced, causing higher fluid performance in tooth heat transfer. Considering the above PEC diagrams in higher Reynolds, it can be stated that tooth with R/W = 0.325 ratio not only has lower pumping power, coefficient of friction, and pressure drop but also has equal thermal PEC with R/W = 0. This mode of tooth in this research can be called the optimum mode of tooth.
Footnotes
Appendix 1
Academic Editor: Jose Ramon Serrano
Declaration of conflicting interests
The author(s) declared no potential conflicts of interest with respect to the research, authorship, and/or publication of this article.
Funding
The author(s) received no financial support for the research, authorship, and/or publication of this article.