
Abstract
Failure mode and effect analysis has been applied in manufacturing and service industries but can still be improved. Failure mode and effect analysis is a common tool used to evaluate risk priority number; however, numerous scholars have doubted the effectiveness of failure mode and effect analysis and have thus proposed methods for correcting failure mode and effect analysis from its conventional formula. Because implemented actions can determine or influence resource allocation and its effects, completing one corrective action can occasionally simultaneously improve various failure modes. In this study, failure mode and effect analysis and decision-making trial and evaluation laboratory were integrated to correct failure modes and increase their effectiveness. First, failure mode and effect analysis was employed to identify the items for improvement. Second, decision-making trial and evaluation laboratory was adopted to examine the reciprocal influences and causality among these items. Finally, the priority for improving the items was proposed. By combining the advantages of failure mode and effect analysis and decision-making trial and evaluation laboratory, this research method complemented the shortcomings of the two techniques. According to the empirical research of this case study in which decision-making trial and evaluation laboratory was employed to analyze the causality among the items of the failure modes, the malfunction of production lines can be solved faster and more effectively compared with merely considering the size of risk priority number values.
Keywords
Introduction
Background
Failure mode and effect analysis (FMEA) is a widely employed systematic analysis technique for evaluating the probability of failure points occurring and their subsequent effects. At all stages of a product life cycle, FMEA is commonly employed in the manufacturing industry and is gradually being used in the service industry. Numerous studies have applied risk priority number (RPN) to solve failure mode problems. RPN is a critical decision index, and its numerical size influences the priority in solving problems. Therefore, several studies have focused on calculating and adjusting RPN. Some studies have further proposed the effects of failure mode to adjust the RPN weight through the failure mode effects. 1 Other studies have employed estimated RPN to conduct a highly accurate and reasonable risk evaluation. 2 We considered that RPN can filter critical failure modes. However, because causality exists among failure modes, we recommend first identifying the causal relationships among the failure modes before determining the priority for improving them.
Motivation and objective
FMEA can be used to identify the potential failure modes of a product or its production process. Nevertheless, the weight and calculation methods of the failure mode greatly influence the priority for improving problems, and sometimes the causality among and costs associated with the failure modes are disregarded. If the failure factors are causally related, additional resources and time would be required when the effect and then the cause of a failure factor are changed. Instead, a change in the cause can easily change the effect. Thus, twice the results can be obtained using half the effort, the steps required for improving the problems can be reduced, and time expended on the improvement can be shortened. Problems related to the production line must be instantly solved, and understanding the causality among the failure factors can reduce the number of resources invested in solving the core problems as well as avoid an improvement with low efficiency. This study solved the problems from the risk perspective and focused on the causality among the failure factors. By considering the sequence relationship between the actions involved and improvements of the problems, the priority for improving the key variables was confirmed. The empirical research indicated that decision-making trial and evaluation laboratory (DEMATEL) employs a matrix operation to obtain the causality and influences among all factors to identify the core problems in a complex system and their improvement methods. Regarding the shortcoming that FMEA cannot identify the causality among the factors, DEMATEL provides an effective method for managing the complex casual structure. During the forming section, a late process in the paper-making process, the paper machine is a critical process and has the highest failure probability in the entire production line. A paper machine malfunction stops the entire production line from operating; thus, the cause of the failure must be instantly identified for improving and continuing production line operation.
Therefore, we combined DEMATEL and FMEA to identify the problems related to the failures and subsequently obtained the core problems through meticulous analysis. Thereby, little time and few resources would need to be invested for improving and correcting the problems, and thus, the production line problems can be instantly solved.
Literature review
FMEA
FMEA is a systematic technique that can be used to identify the possible failure modes associated with a product or its production process. This technique is a high-quality improvement tool that can analyze the influences of such failures in the product or its production process. Thus, the improvement and prevention measures can be implemented at an early stage. FMEA transforms the product design from its characteristics to clearly define operating conditions to ensure that the effects and performance of the product can meet the needs and expectations of customers. When the potential failure modes and their effects are identified, corrective actions can be employed to eliminate the potential failures or make continual improvements to reduce the severity and frequency of the potential failures as well as increase their detection probability. In addition, we proclaimed the employed basic operations and rules in written statements to serve as a reference for preventing future failure mode occurrences and developing techniques.
FMEA was initially employed in 1950 for designing and developing an aircraft flight control system 3 and was employed in the Apollo/Saturn Project developed by the National Aeronautics and Space Administration to ensure that hardware applied in a certain space had the required reliable features. 4 Since the 1960s, FMEA has been widely adopted as a reliable and safe technique and was specifically used in the aerospace, automobile, electronic, and nuclear industries. In 1977, Ford Motors implemented FMEA in the manufacturing processes of automobiles. In the late 1970s, FMEA was employed for software developments. Currently, FMEA has become the standard practice for manufacturing enterprises in Japan, the United States, and Europe.5,6
FMEA is a tool designed to analyze and prevent technical failures and is a structuralized system that can be used to identify the potential failure modes of designed or produced products. By determining the influences of malfunctions on the systems and by providing qualitative evaluations, the necessary corrections for improving the reliability of these systems can be performed. In other regions, FMEA is widely used in the service industry. For example, Linton 7 applied FMEA to e-commerce; Reiling et al. 8 employed FMEA for managing medical errors; Shahin 9 integrated the Kano model and applied FMEA to travel agencies.
The Auto Industry Action Group, collaboratively developed by the three major automotive manufacturers in the United States (i.e. Chrysler, Ford, and General Motors) and thousands of other suppliers, proposed the QS9000 quality management system in 1992 and incorporated FMEA as a chain in the product development management system. The three major automotive manufacturers applied FMEA as a principle for proving the ability and qualification of the qualified suppliers to increase product safety, meet clients’ needs, make continual improvements, emphasize problem prevention, reduce quality difference, and maintain the reproducibility and stability of products, and simultaneously reduce wastage, defective products, and waste materials resulting from the manufacturing processes.10–12
The currently employed FMEA is an analysis and prevention tool implemented with strict requirements in the QS9000 quality management system. All companies approved by the QS9000 quality system must have been evaluated using FMEA in advance; however, companies that are evaluated using FMEA are not restricted to those approved by the quality system. The general literature review of FMEA involves the internal confidentiality of enterprises, and thus, disclosing the relevant information is inappropriate. Therefore, only governmental and nonprofit organizations could be consulted for acquiring the relevant literature.13–17 For instance, the Society of Automotive Engineers in the United States, as stated in its technical manual specification published in 2000, employed FMEA as a prevention tool to analyze an electric power steering system. In addition, FMEA was adopted for semiconductor manufacturing technology in the United States to continually improve semiconductor equipment.
DEMATEL
DEMATEL is a method proposed by Gabus and Fontela,18,19 who worked at the Battelle Memorial Institute of Geneva. In its initial development, the DEMATEL method was applied to solve complex and intractable problems worldwide, such as race, hunger, environmental protection, and energy. 19 In recent years, scholars have gradually extended the employment of DEMATEL from the original human science domain to solving problems in various fields.
Recently, the DEMATEL method has been employed in several fields in Japan, South Korea, and Taiwan. For example, Tamura et al. 20 employed DEMATEL to analyze food causing sickness in clients and develop countermeasures. Hajime et al. 21 integrated quality function deployment, the Russian theory of inventive problem solving, and DEMATEL to solve controversies involved in new product designs. Nanayo and Toshiaki 22 adopted a modified version of DEMATEL in an integral evaluation of the medical system.
The purpose of DEMATEL is to compare the degree of importance of the influences of the direct and indirect causality as well as corrective actions obtained from correlation matrices. The causality and influence indicated in the matrices can be considered a standard or decision; in other words, DEMATEL can divide a complex system into a clear causality and can quantify how a corrective action influences another core problem in another system and its improvement.
Lee and Hsieh 23 employed the DEMATEL to analyze the causal relationships of service attributes in the telecommunications industry, rearrange the priorities of service attributes, and resolve competitiveness problems. Tsai et al. 24 employed the DEMATEL to examine how manufacturers acquire orders and competition strategies.
Research method
To summarize the aforementioned statements, FMEA can be widely employed for risk evaluation, and DEMATEL can be applied for decision analysis. Combining the two techniques achieves a high effectiveness in decision implementing and problem solving. Potential FMEA partially indicated the following risk factors: severity (S); the detection probability of a possible failure mode caused by unidentified malfunctions; occurrence (O); and detection (D), the difficulty to detect the generated defects. These three factors can be scored from 1 to 10 points. RPN is the product of occurrence, detection, and severity and can thus be presented as RPN = S × O × D. A high RPN value indicates a high potential for improvement. After the corrective actions are employed, the correction values must be recalculated to determine whether risk has been reduced and to detect the effectiveness of the corrective measures applied to the failure modes.
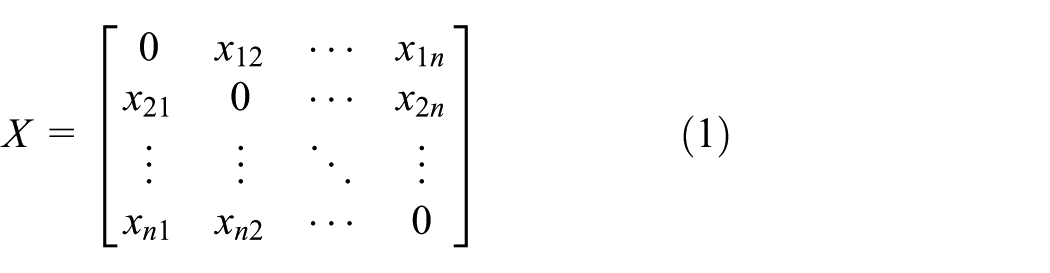
DEMATEL facilitates decision analysis. The number of corrective measures is defined as n. When the influences between the causality and corrective measure and subsequently the relationships among and the degree of influences of the obtained variables are compared, the direct-relationship matrix X of n × n can be obtained, indicating the influence of variable i on the degree of variable j. Furthermore,
FMEA
Step 1: implement FMEA to evaluate the risk of failure
The FMEA standard form is used to analyze the core operations of FMEA (Table 1).
FMEA standard form.

FMEA: failure mode and effect analysis.
RPN = S × O × D.
The RPN value generally ranges between 1 and 1000. If the RPN is considerably high, the related personnel must adopt corrective measures to reduce the value. When the failure modes are arranged according to the RPN size, the failure mode with the maximum RPN value should be prioritized when making plans for improvements. Subsequently, plans for improvement should be emphasized in the failure mode with the second largest RPN value. The priority in making plans for improvements should follow this standard accordingly. If the RPNs are the same, the failure mode with a higher S should be prioritized; if the S is the same, the failure mode with a higher D should be prioritized. However, when S is excessively high, improvement measures must be planned regardless of the RPN size.
DEMATEL
Step 2: use the DEMATEL method to analyze causality
Variable definition and scale measurement: the measuring scale can be 0, 1, 2, 3, …, and any grade.
Establish a direct-relation matrix
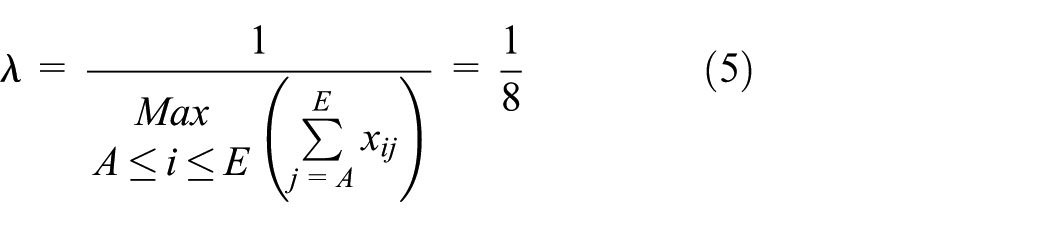
Calculate the normalized direct-relation matrix
Calculating the normalized direct-relation matrix involves two methods. For example, Wu and Lee 25 and Kim 26 employed maximum row vectors as the normalized standards. Tsai et al. 27 employed maximum row or column vectors as the normalized standards.
Let

Normalized direct-relation matrix N


where O is a null matrix and I is an identity matrix
4. Calculate direct or indirect-relation matrix
The direct or indirect-relation matrix T is also called the total-relation matrix.
The indirect-relation matrix H is called the total-indirect-relation matrix28–30


Setting threshold: impact of <0.1 persons treated as 0. Let threshold be 0.1
5. Draw the causal diagram
Let

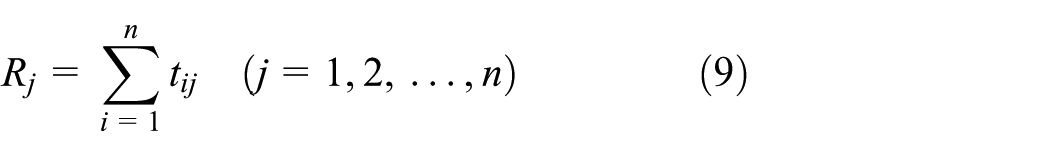
(D + R) and (D − R) were used as the horizontal and vertical axes in the causal diagram, respectively; and all the variables were plotted on the diagram.31–34
(D + R) is called prominence, which indicates how crucial the criteria are and the critical level of the variable involved in the entire problem.
(D − R) is called relation and can be divided into the standardized cause group and effect group, indicating the causal degree of the variable involved in the entire problem. If D + R is a positive value, then the variable is categorized into the cause group, whereas if D − R is a negative value, then the variable is categorized into the effect group.
Integration of FMEA and DEMATEL
Step 3: decide on the priority for improvement
The RPN value is calculated using FMEA. After the failure modes associated with high risks are selected, the priority in improving the failure modes is determined according to the analysis results obtained from DEMATEL. Through these steps, the additional messages provided can effectively assist in improving the problems involved with product design and production processes and can serve as a reference for solving and improving problems that occur in the future.
Case study analysis
The aforementioned steps were practically applied to solve problems that occurred during the paper-making process at a company. Figure 1 illustrates the company’s major press roll machine used for paper-making. The company established a task force targeted at this product to solve the problems encountered during the paper-making process. The task force employed FMEA to a few summarized points requiring special strengthening during the product designing process and offered methods for early prevention as well as follow-up improvement actions for the indicators involving high risks. The implementation process is explained in detail (Figure 1).

Brief illustration of the product.
Discuss and confirm the influences of failure modes and their effects
The task force summarized the failure modes of this product in its design phase, and the failure modes can be identified from its functional end (e.g. torque force, tensile force, and shear force) and structural end (e.g. loosening, deformation, fatigue, erosion, and leakage). Table 4 provides the failure modes, influences, and causes of the critical function items of this product as well as the degree of S, O, and D of the failure modes.
Searching a few key points for improvements
The task force decided to prioritize the RPNs exceeding 100 and the items associated with high severity (s ≥ 8) as the key items to be solved and improved. Six key items in this product were prioritized for solving and improving (Table 2).
Failure mode and effect analysis of the critical function items.

RPN: risk priority number.
Key points for solving and improving.
Results of FMEA
The failure modes with high RPNs were selected for improvements: Product A (the deformed riveted joint of the product cannot fully fit the working face), Product B (insufficient strength after heat treatment), Product C (inadequacy of the shear area), Product D (inconsistency or deviation of the oval head and thin wall shape of the product), Product E (sensitization phenomenon precipitated and generated from the coring structure or carbide), and Product F (incomplete passivation and surface treatment; Table 3).
Results of the selected failure modes.

RPN: risk priority number.
Key items prioritized for solving and improving.
In the conventional FMEA, the priority for improvement was based on the RPN, and the reciprocal influences among the failure modes were not considered. The next step in this study provides a decision-making method for the priority of failure mode improvements.
DEMATEL
Variable decision and scale measurement
1. Direct-relationship matrix

2. Let threshold be 0.1

3. Causal diagram
4. Calculation of D + R and D − R
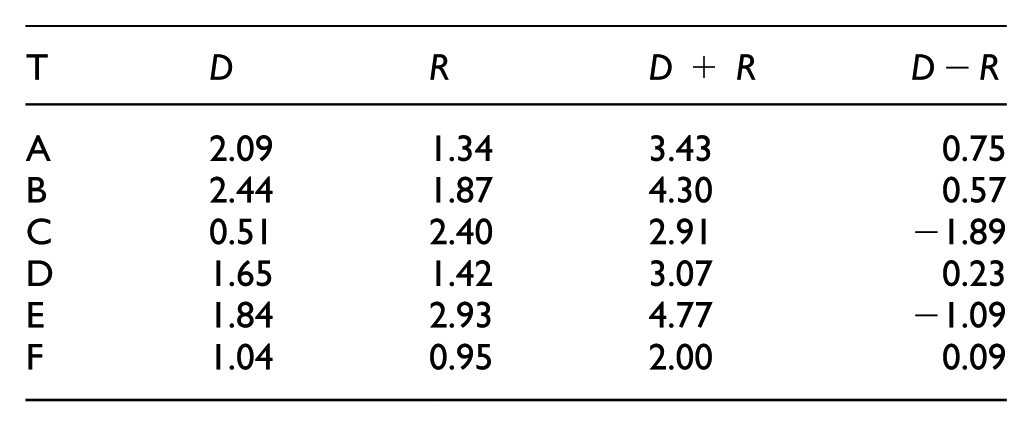
5. Interactive relationships of the criteria
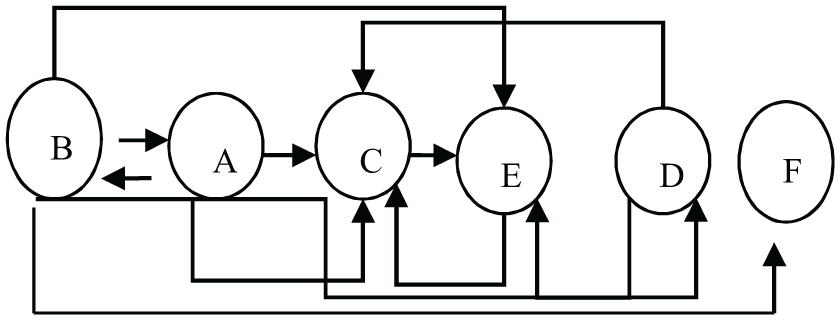
A and B were causal factors that influenced numerous factors. D and E were the effect factors that were highly influenced by A and B and influenced numerous factors (Figure 2).

Interactive relationships of the criteria.
To perform the improvements, FMEA and DEMATEL were employed to analyze A and B. Because the current control method for A was the actual testing after production, B was first improved before influencing A, which could be gradually improved. E needed to be improved by factories. A and B were improved with the hope that the deterioration of E can be controlled and that D can be improved. The improvements of A and D can improve C. Because F exhibited no evident influences on other factors, it was the final item to be improved.
To summarize the aforementioned statements, the recommended improvement sequence was B → A → D → C → E → F, instead of the sequence of the RPN size: A → E → B → D → F → C (Table 4).
Improvement sequence.
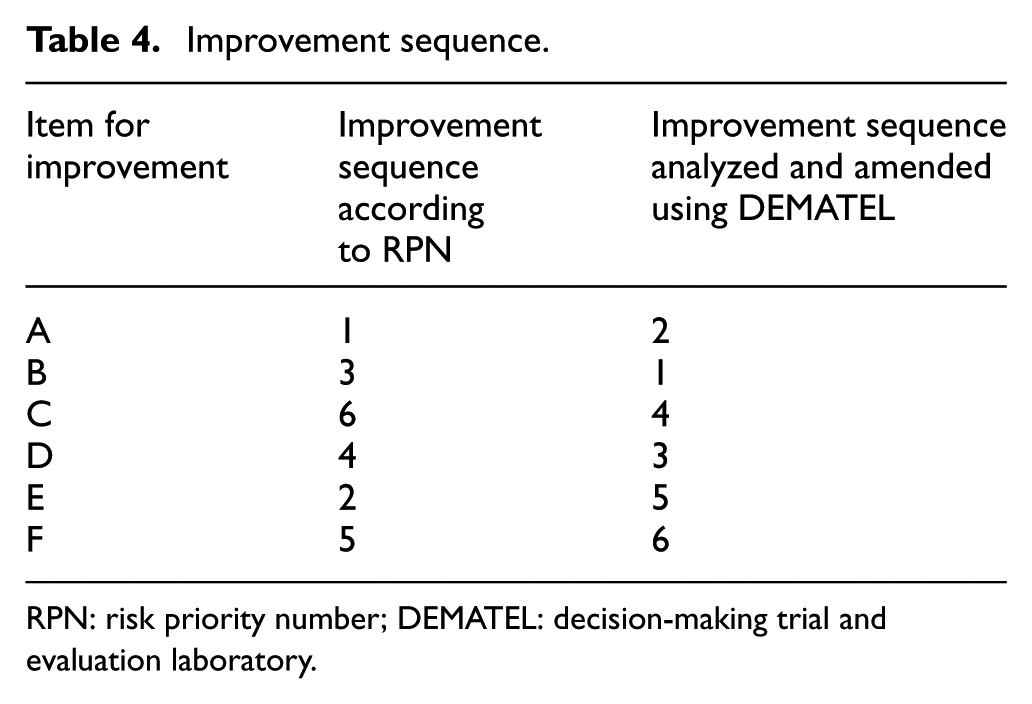
RPN: risk priority number; DEMATEL: decision-making trial and evaluation laboratory.
Preventive corrective measures and continual improvement
The task force proposed the following measures for improvements according to the priority and key in solving and improving the six items of the failure mode:
B: Regarding the insufficient strength after heat treatment, experiments were conducted to establish the corresponding curve showing the time, temperature, and metamorphosis required for the heat treatment process to obtain a consistent hardness and the required strength.
A: Regarding the deformed riveted joint of the product that could not fully fit the working face, computer-aided simulation was employed to analyze the product deformation.
C: Computer-aided design analysis was employed for solving and improving the inadequate shear area.
D: Regarding the inconsistency or deviation of the oval head and thin wall shape, the cooperated factories were re-requested to produce the outline dimension of the product according to the normative content.
E: Outsourced factories were entrusted to manage the sensitization phenomenon precipitated and generated from coring structure or carbide.
F: The factories that were professional and could provide retrospective reports were entrusted to manage the incomplete passivation and surface treatment, and the quality management of the supplier was strengthened.
Conclusion
In this study, we first evaluated the rank and weight of the interdependent corrective measures. In addition, by combining the effectiveness of the corrective measures, FMEA was confirmed to determine the priority for improvement according to the RPN. Through a case study, a different priority in implementing corrective actions that was more reliable was obtained. The new priority involves the effectiveness of the corrective measures, maximizes the effects, yields favorable results, and involves the lowest cost in the shortest time.
Second, we implemented a further investigation. Generally, numerical values are evaluated and obtained to exhibit the clients’ subjective opinions of the products. Because intangible and subjective messages appeared in the evaluation process, the obtained numerical values were insufficient for exhibiting the scale evaluated by the clients; thus, different expressions and uncertain challenges were involved in the evaluation scale. We then proposed a method that considered the relationships among the levels and their interdependence, which may be beneficial for obtaining a more accurate priority for corrective measure implementation and maximizing the effects. In addition, we conducted another investigation. From a deeper perspective, even though FMEA can be used to identify the different levels and effects of the corresponding corrective measures, it cannot explain the causality and influences among the measures. We employed the DEMATEL method to analyze the causality and influences among the corrective measures and effectively integrated the FMEA to acquire the corrective measures with increased intactness. Finally, through comparison, a different priority for corrective action implementation was obtained.
This research method combined the advantages of FMEA and DEMATEL to complement the shortcomings of the two techniques. The results of this study suggested the priority for solving such problems and can assist decision makers in identifying and improving the core problems. Through this method, the cause and effect of an item can be determined, the causality among the other items can be acquired, and the directions and sequences for improvements can be quickly identified. Therefore, an investment in the same resources is expected to yield increased benefits.
According to the empirical research of this case study in which DEMATEL was employed to analyze the causality among the items of the failure modes, the malfunction of production lines can be solved faster and more effectively compared with merely considering the size of RPN values. Thus, production lines do not need to be shut down for lengthy periods, which affect production. However, additional examples must be applied to verify the effectiveness of this method.
Footnotes
Academic Editor: Duc T Pham
Declaration of conflicting interests
The author(s) declared no potential conflicts of interest with respect to the research, authorship, and/or publication of this article.
Funding
The author(s) received no financial support for the research, authorship, and/or publication of this article.