
Abstract
The existence of the unavoidable uncertainties has a great effect on the prognostics accuracy and performance. However, their influences are rarely taken into account in the current prognostics performance evaluation. Consequently, the validity and/or trustiness degree of prognostics and health management system has not been comprehensively evaluated or measured. Considering the definition of prognostics performance and the characteristics of uncertainties, four prognostics performance metrics and two kinds of quantitative evaluation methods are proposed. On the basis of prognostics performance definition, a novel trustworthiness of prognostics concept is presented. Then, three kinds of assessment methods for trustworthiness of prognostics are provided. Finally, a case study has been carried out on the aviation hydraulic pump for verification purposes, in which the oil-return flow is monitored for predicting the degradation of the pump. The systematic application of trustworthiness of prognostics assessment is implemented based on the back propagation neural network prognostics algorithm. The results show that the proposed trustworthiness of prognostics concept and assessment methods can contribute to the systematic and comprehensive understanding of the performance of prognostics and health management system.
Keywords
Introduction
Prognostics refers to the process of predicting the future reliability of a product by assessing the extent of deviation or degradation from expected normal operating conditions. 1 In the process of prognostics, various types of data are comprehensively utilized, such as monitoring parameters (e.g. environmental conditions and physical loads), field or test data, and historical experience. The remaining useful life (RUL) of products or systems can be evaluated and the future health or reliability state can be predicted by utilizing various prognostic methods and models.
In recent years, researchers have carried out a number of studies on prognostics methods. However, whatever method is adopted, the unavoidable uncertainties exist in the process of data acquisition, data transmission, and data processing. These uncertainties have a significant effect on the accuracy of RUL prediction and the applicability of prognostics methods. When the state estimates, future loading conditions, and operating conditions are uncertain, the future states and the RUL also become uncertain. 2 Besides, the existence of uncertainties also increases the difficulty of verification and validation (V&V). Essentially, it is necessary to understand and manage the uncertainties in the process of prognostics.
The main contents of uncertainty management includes (1) analyzing the uncertainty sources, (2) assigning a probability density function (PDF) around the RUL estimate, and (3) calculating the confidence bounds for the estimate of a significant system reliability measure, such as failure probability distribution and failure rate. Furthermore, regarding the advanced uncertainty management framework, the algorithms or methods used to reduce the uncertainties are also involved. The uncertainty management is crucial and helpful for decision makers to know the time to take action offline or online on the basis of the current risk tolerance. 3
As one of the intrinsic properties of prognostics and health management (PHM) systems, prognostics performance is similar to the concept of product performance, which refers to the nature and ability of a prognostics method to perform required functions and obtain expected results by making use of specific resources. Prognostics performance has a direct impact on the development of maintenance strategies for end users. Therefore, effective performance evaluation methods are necessary for building and qualifying a real and mature PHM system. Nevertheless, current researches concerning performance evaluation demonstrate that there is no general agreement on an appropriate and acceptable set of metrics which can be effectively employed to evaluate the technical performance of prognostics.4–6 In addition, the influences of uncertainties are rarely considered in the existing performance evaluation methods and processes, which result in an unsatisfactory result of requirements.7–10 Consequently, the validity and/or trustiness degree of PHM system has not been comprehensively evaluated.
This article proposes four prognostics performance metrics and two kinds of quantitative evaluation methods for prognostics performance. On the basis of prognostics performance definition, a novel trustworthiness of prognostics (ToP) concept is presented. Then, three kinds of assessment methods for ToP are provided. Finally, a case study has been carried out on the aviation hydraulic pump for verification purposes, in which the oil-return flow (ORF) is monitored for predicting the degradation of the pump. The systematic application of ToP assessment is implemented based on the back propagation (BP) neural network prognostics algorithm.
Prognostics performance and evaluation
Concept of prognostics performance
A clear and systematic definition of prognostics performance has not been found in the published literatures underlining the prognostics performance and evaluations. Aiming to promote the unified cognition, a concept is proposed as follows, which is based on what has been put forward by Liu and Sun. 11
Definition 1
Prognostics performance refers to the nature and ability of a prognostics method or PHM system to perform a required function and obtain expected results by making use of specified resources.
Among above definition, a required function means the adaptive capacity of a prognostics method or system. The expected results refer to the precision and accuracy of the predictive results. The specified resources include computing time (CT), computer’s memory space, and other resources which are required in the implementation process of prognostics methods.
Prognostics performance metrics
In order to fully describe prognostics performance, the following four prognostics evaluation metrics are proposed, comprehensively taking the characteristics of uncertainties into consideration.
Quality of prognostics
The quality of prognostics results mainly involves prediction accuracy and precision. The prediction accuracy is usually adopted to measure the degree of closeness between actual values and estimated values, while the prediction precision is employed to measure the aggregation extent of estimated values.
In Figure 1, E{P} is the mean of the probability distribution of predicted value

where α means the acceptable risk level, which is determined by the end users according to the actual failure severity and criticality.

Schematic explanation of prognostics quality: (a) continuous situations and (b) discrete situations.
As can be seen from Figure 1(a), the predicted value
Relative accuracy
Saxena et al. 12 presented relative accuracy (RA) as a measure of error in RUL prediction relative to the actual RUL at a specific time index. However, the function and its parameters of this metric are difficult to use in the actual application. In this article, RA is defined as the probability of all the predicted values falling into the acceptable zone. As shown in Figure 1(a), Area(P1) and Area(P2) are for continuous situations, and Area(P) is for discrete situations as shown in Figure 1(b). The RA can be expressed as follows
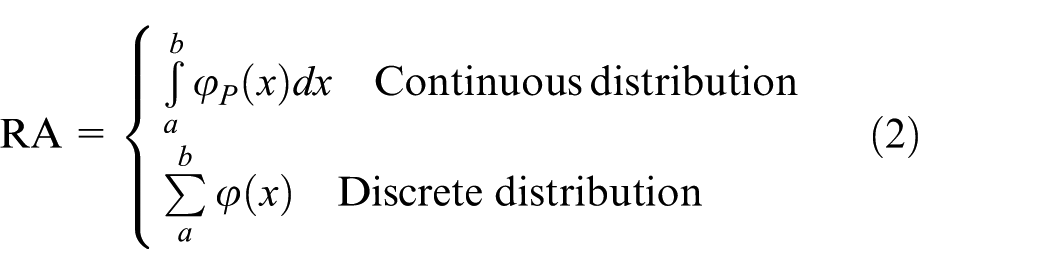
where
Relative precision
Relative precision (RP) is adopted to measure the consistency level between confidence intervals of predicted value and actual value at the same confidence level. The RP can be expressed as follows

where CIA and CIP are, respectively, confidence intervals of actual value and predicted value at a given confidence level, which are recommended to determined according to historical or field data or relevant reliability test data. CImax is the maximum tolerance interval of the predicted values defined by end users according to the actual acceptable risk level.
Timeliness of prognostics
As shown in Figure 2, when the RUL predicted value fall into the acceptable zone at a certain moment ti for the first time, the RUL predicted values after ti will all fall into the acceptable zone. The time span between any moment tj and the actual time at which the system failure occurred is defined as prognostic horizon (PH), which can be used to measure the timeliness of prognostics 12

where tEoL is the time for the end of life (EoL) and tj represents any moment.
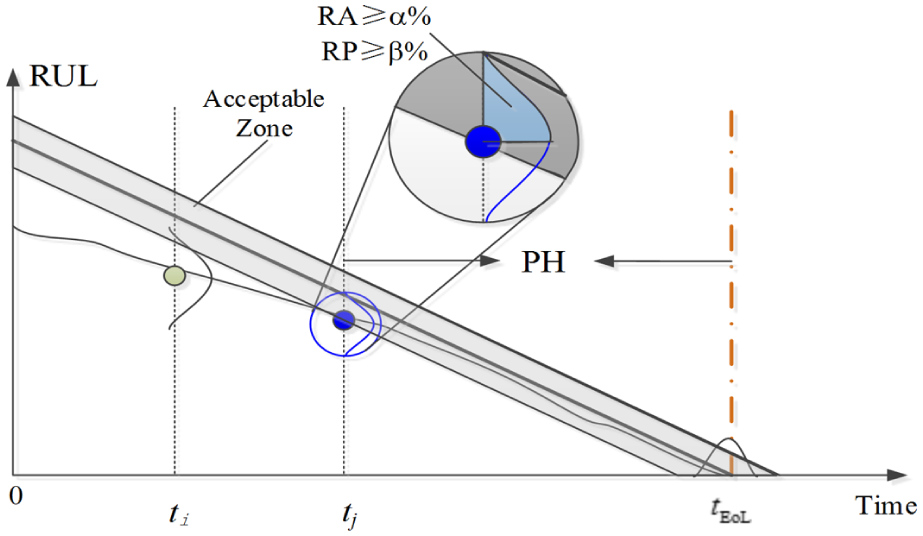
Illustration of prognostics horizon.
Whether RUL fall into the acceptable zone or not, the criteria are RA ≥ α% and RP ≥ β%, where α% and β% are the judgment thresholds for specific requirement end users.
Comprehensive prognostics quality and algorithm convergence
Based on all the evaluation metrics within the PH scope, the comprehensive measure of the quality of prognostics results and convergence of algorithm can be obtained. Similar to the comprehensive relative accuracy (CRA) concept presented in Saxena et al., 12 the CRA and comprehensive relative precision (CRP) are also proposed in this article. The formula can be expressed as follows


where n is the evaluation times within PH scope and wi is the weight of the prognostics result at a certain moment. The range of wi is [0, 1].
When calculating CRA and CRP, more attention will be paid to predicted values near the failure point, and a higher weight will be given. The weight equation can be expressed as follows

Resource occupancy
The CT synthetically reflects the complexity of the prognostics algorithms and the requirements for the performance of hardware. In consequence, the mean of CTs can be employed to comprehensively measure the resource occupancy (RO) of the prognostics algorithms. The formula can be expressed as follows

Methods for prognostics performance evaluation
In this article, two kinds of systems are discussed. One is in-service system in working status. In this case, the objective of prognostics is to predict RUL of these systems. Another is broken system with known failure information, which is also called verification system. According to the different types of objects or systems, the prognostics performance evaluation methods can be divided into offline method and online method. The offline method focuses on comparison of performance of different PHM systems or prognostics algorithm or models. It is usually applied for verification system at the design stage of PHM systems. The online method emphasizes on the evaluation of prediction results of prognostics algorithm or models for the in-service system. It is generally adopted for the in-service system at the practical application stage of PHM systems.
Offline prognostics performance evaluation
In ideal situation, the ideal RUL (

As shown in Figure 3, the ideal RUL curve can be obtained. The reference system is called the base of the offline prognostics performance evaluation.
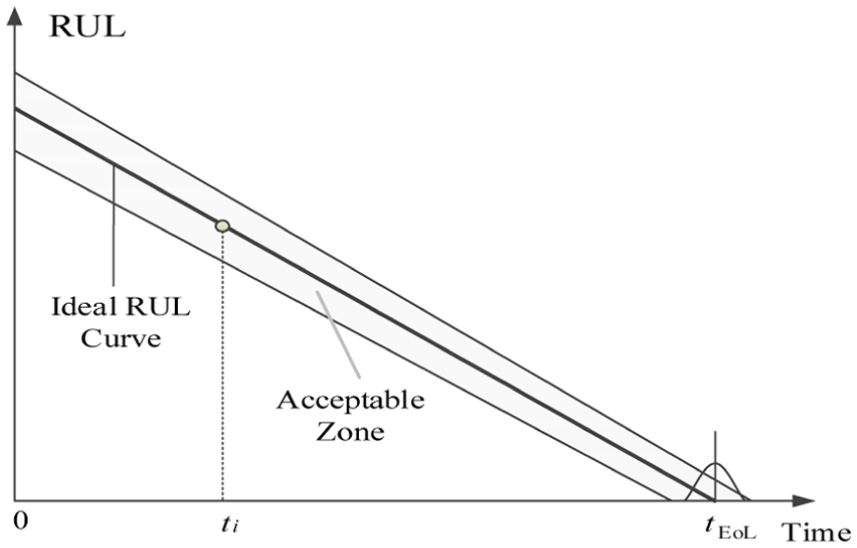
The base of the offline evaluation.
From normal working moment, the curve in Figure 3 represents the actual RUL of the verification system at any time on the condition that the verification system has been doomed to fail at a unique failure time. However, the RUL of the verification system will become uncertain due to load environment uncertainties experienced by systems. Hence, before the system fails, the actual failure time cannot be judged theoretically. When the actual load environment of systems rarely changes or the failure process of systems is not sensitive to load environment changes, the actual RUL of systems can usually be replaced by the ideal RUL curve. On the basis of the above explanation, the procedure of the offline performance evaluation method is shown in Figure 4.

Flowchart of the offline evaluation methods for prognostics performance.
Online prognostics performance evaluation
With the change in the prediction time, the predictions and results of the in-service system are constantly updated. When the prediction time is closer to
According to the definition of MEPH, the relationship among

where

In order to predict the system state before the moment
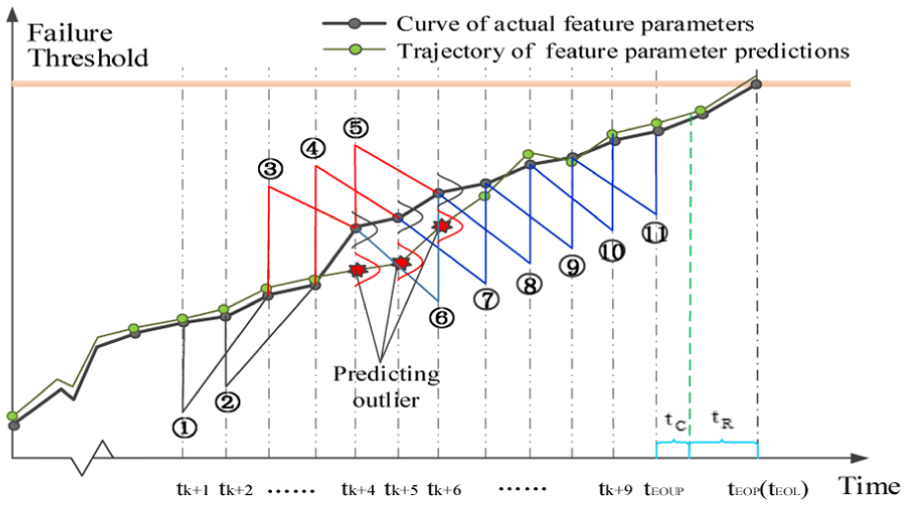
Schematic explanation of the online prognostics performance evaluation.
With the change in the loads, the actual characteristic parameters of the system may be changed significantly. On account of the lag of the algorithm, a number of prediction results that significantly deviate from the actual state of characteristic parameter distribution may occur, such as prediction results at
Flowchart of the online evaluation method for prognostics performance.
Trustworthiness of prognostics and assessment
Concept of ToP
Trustworthiness usually refers to the degree of trustiness that a simulation system (as the alternative system of the prototype system) can repeat the prototype system with a particular purpose and means level of modeling and simulation on the overall structure and behavior. As a special simulation system, the prognostics or PHM system is provided with a similar connotation of trustworthiness to that of the simulation model. The definition of prognostics trustworthiness is proposed as follows.
Definition 2
ToP refers to the comprehensive measure of the degree of trustiness that the prognostics or PHM system can obtain in a specific application under the requirements of end users.
Essentially, the ToP is the remeasurement of prognostics performance. If a prognostics system is deemed to be trustworthy, it means that the prognostics system should be able to conform to the actual degradation process of an actual product or system regarding the overall behavior. However, the changes of external loads and environmental conditions will bring great uncertainty in the actual performance degradation of the actual system. The application object and their load environment shall be made clear in the definition of ToP. ToP is a metric used to assess the effectiveness of a prognostics method or model. Correspondingly, ToP assessment is a subjective recognition process employed to determine whether the prognostics results are effective enough to be accepted or not. As a result, the ToP is constrained by the specific end user’s requirements.
Methods for ToP assessment
A high-performance PHM system does not necessarily obtain a higher ToP in actual application. One of the main reasons is that the prognostics performance evaluation is not combined with the specific in-service systems and application conditions. According to the definition of ToP, the prognostics performance evaluation can be involved in the ToP assessment for a specific application by considering the requirements of end users. Similarly, the ToP assessment methods can also be divided into offline method and online method.
Offline ToP assessment
Similar to the offline prognostics performance evaluation, the offline ToP assessment method is mainly adopted for verification system. The procedure of the offline ToP assessment method is shown in Figure 7. The

where


Flowchart of the offline ToP assessment method.
Online ToP assessment
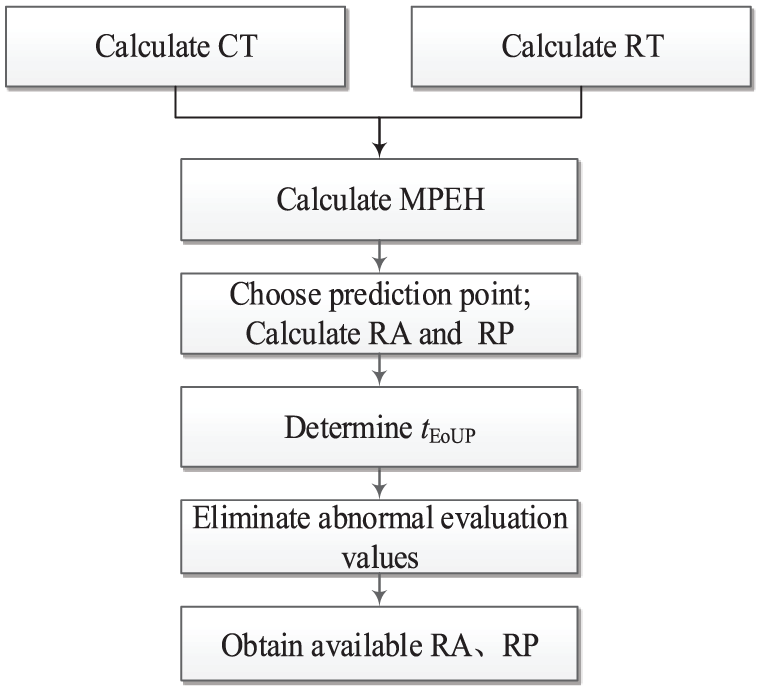
The online ToP assessment is employed for the in-service system. Based on the online prognostics performance evaluation method, the procedure of the online ToP assessment method is shown in Figure 8.

Flowchart of the online ToP assessment method.
The

where
In addition to the prognostics subsystem, the data acquisition subsystem, the data processing subsystem, the condition monitoring subsystem, the health assessment subsystem, and other subsystems are also involved in total PHM system. Each of these subsystems works independently without affecting each other and possesses its own ToP. Therefore, the ToP of each subsystem needs to be comprehensively considered in the process of online assessment. The ToP of total PHM system can be gained as follows

where ToP(S1), ToP(S2), …, and ToP(Sr), respectively, represent the ToP of each subsystem of PHM system.
Comprehensive ToP assessment
The schematic diagram of comprehensive ToP assessment is shown in Figure 9. Furthermore, the weighted average method is adopted for comprehensive ToP assessment using the following equation

where

Schematic diagram of comprehensive ToP assessment.
Case study and results
Overview of aircraft hydraulic pump prognostics
A hydraulic pump used in the aircraft hydraulic system is studied for verification purposes. The ORF is selected as the indicator of wear degradation, and the failure criterion is 2.8 L/min.
13
The ORF has been monitored and recorded every 5 h. There were 228 points recorded before the hydraulic pump failure occurred. That is to say, the

RUL prediction of the hydraulic pump.
Assuming that the ORF change can reflect the failure or health state of the hydraulic pump by making use of a high-precision data acquisition subsystem. Without considering the influence of data acquisition and data processing subsystem, the ToP of prognostics subsystem can be regarded as the ToP of total PHM system.
In this study, the BP neural network prognostics algorithm is utilized for RUL prediction. The ORF of the hydraulic pump has uncertain characteristics due to the uncertainties of load conditions. The Monte Carlo method is adopted to propagate the uncertainties in the process of prognostics. The RUL prediction results of the hydraulic pump are shown in Figure 10.
Offline ToP assessment results
First, the quality of prognostics, the timeliness of prognostics, and other performance metrics should be provided by end users according to the actual situation of the object and application. For this case, the

where
When RA ≥ 0.5 and RP ≥ 0.5, the predicted value is regarded in the acceptable zone. According to the above parameter sets, the base of the offline prognostics performance evaluation can be obtained, and the RUL at different moments can be calculated as shown in Figure 11.
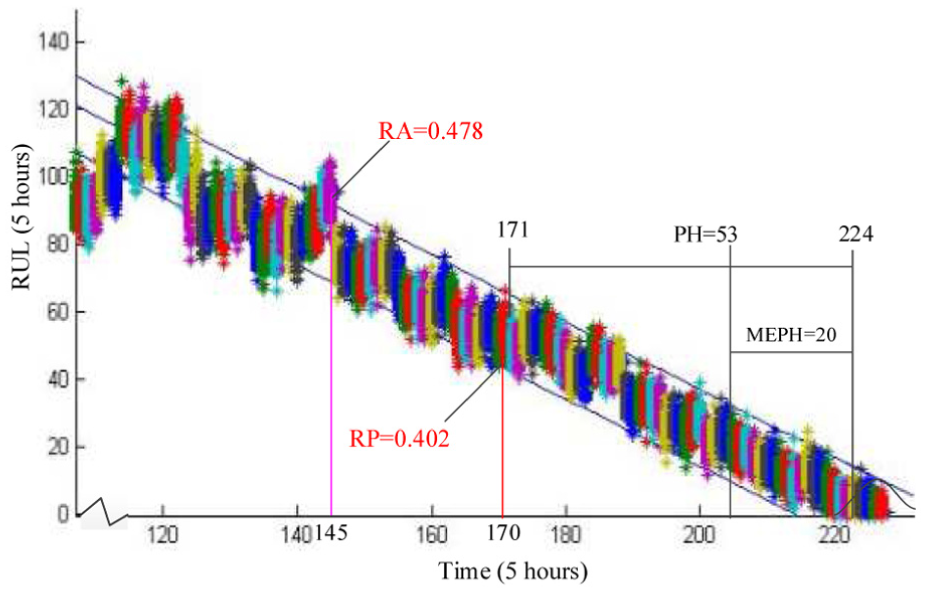
Offline ToP assessment of the hydraulic pump.
As shown in Figure 11, the start of PH is at the 171th monitoring point. Considering the largest variance of the actual life of the hydraulic pump, the end of PH is at the 224th monitoring point. That is PH = 53 under the condition that the acceptable degree of inherent risk is 95%. Assuming that the RT is 100 h, then CT can be neglected relative to RT. When the prognostics timeliness is satisfied by PH > RT + CT, it is assumed that IFPH = 1. In the next step, the prognostics quality and the comprehensive prognostics quality can be evaluated at different moments. The assessment results are presented in Table 1. According to formulae (13) and (14), the weights of comprehensive prognostics quality can be obtained as follows

Quality of prognostics results.

RA: relative accuracy; RP: relative precision; CRA: comprehensive relative accuracy; CRP: comprehensive relative precision.
Then, the offline ToP can be calculated
Online and comprehensive ToP assessment results
The ToP is finally determined by comparing the predicted ORF values with the actual monitoring ORF values. Due to the linear degradation trend and reliability characteristic of the hydraulic pump, the parameters involved in the online ToP assessment can be set in accordance with the offline assessment. Consequently, MEPH = 20 and nine assessment values of the prognostics quality are obtained, which are close to
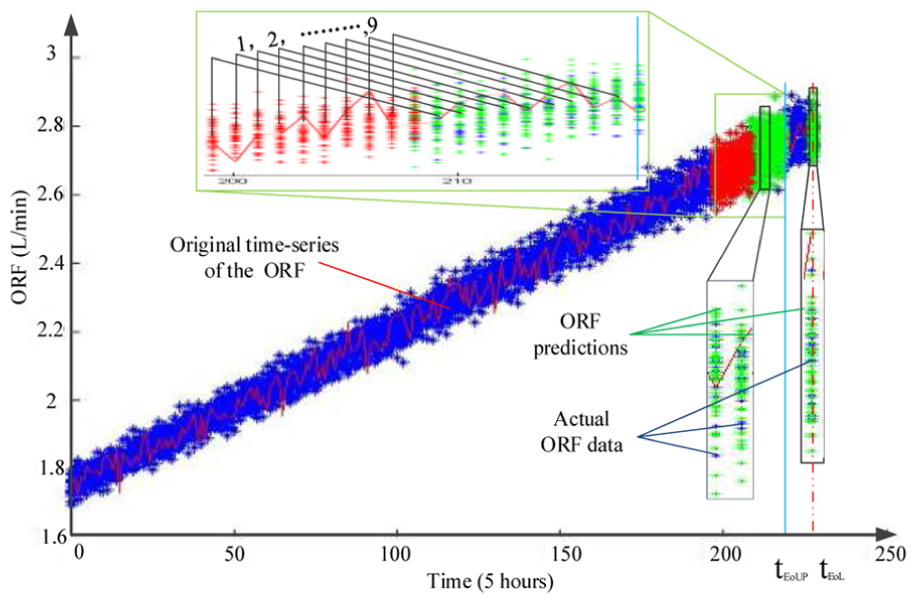
Online ToP assessment of the hydraulic pump.
Online ToP assessment results.
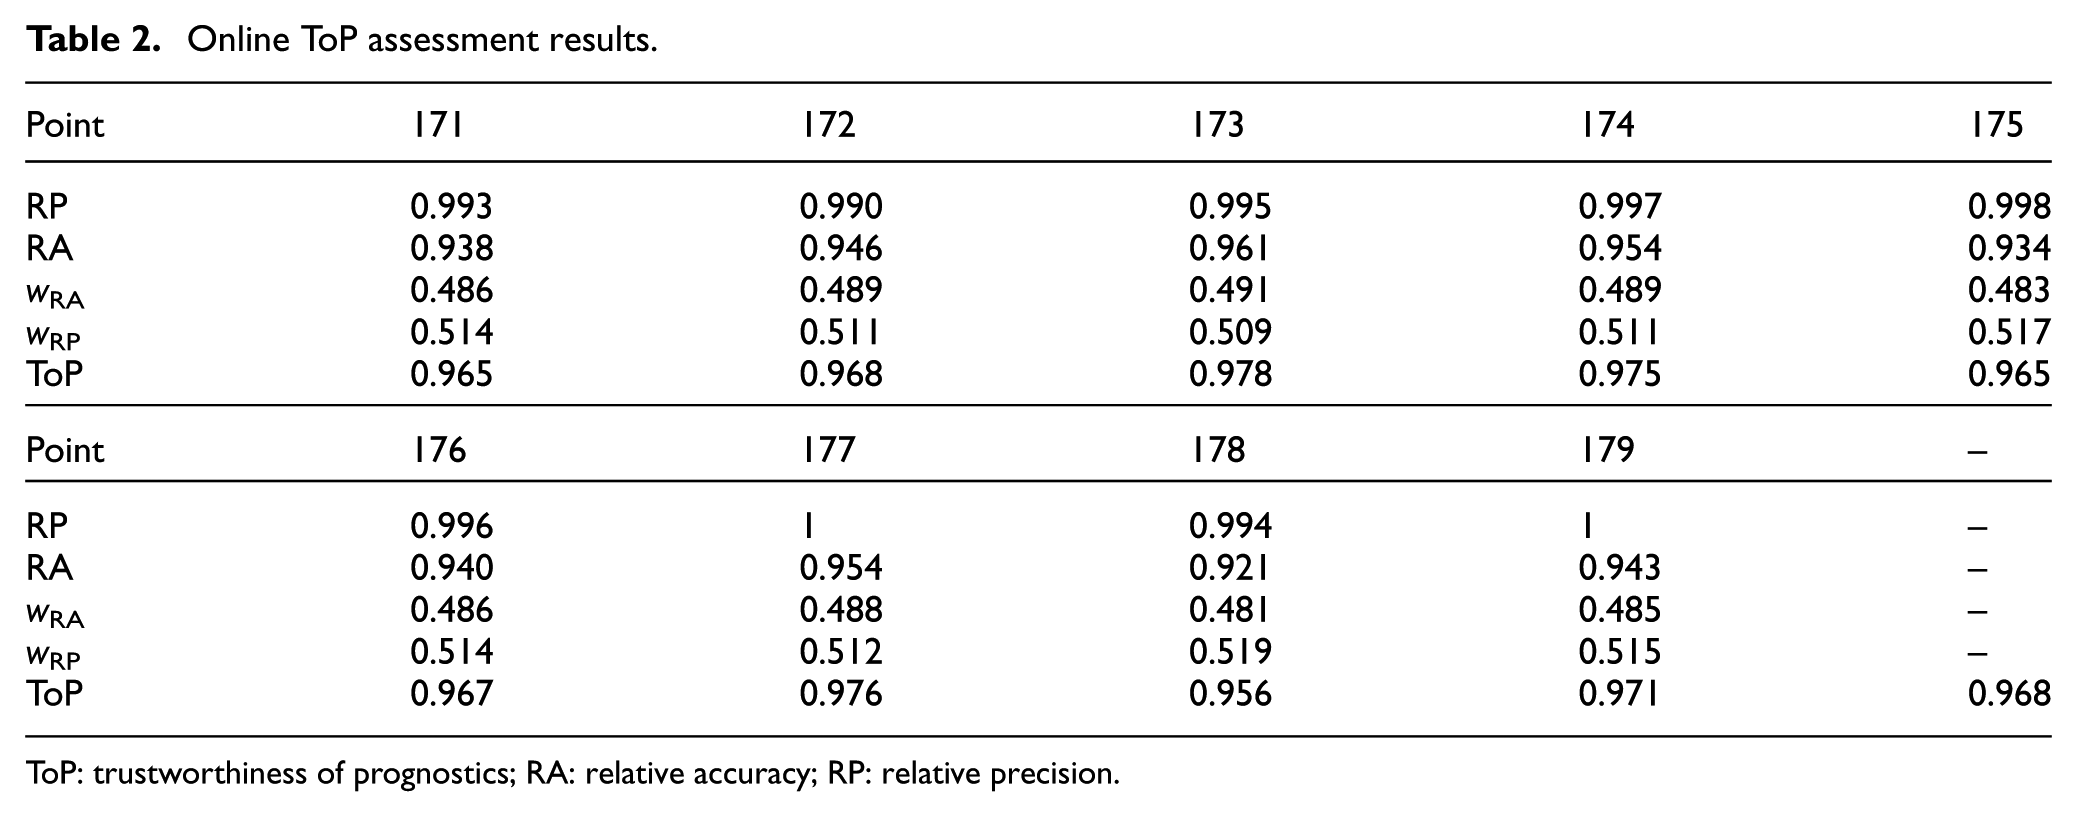
ToP: trustworthiness of prognostics; RA: relative accuracy; RP: relative precision.
By combining the online and offline ToP assessment results with formula (16), the comprehensive ToP assessment can be conducted. As the same system is adopted in both offline and online assessment processes, the weight can be set as
Conclusion
Prognostics performance evaluation is a necessary engineering activity in industry for applying prognostics techniques. This article has attempted to enable a comprehensive understanding of the performance of PHM system. The case study results show that proposed ToP concept and assessment methods can contribute to the measurement of the performance of the total PHM system. These also establish a necessary foundation for PHM design, prognostics methods selection, cost–benefit analysis, V&V of PHM system, and maintenance decision. Prognostics performance evaluation and ToP assessment methods will become the enabler for the future development of high-performance and low-cost PHM systems.
Footnotes
Academic Editor: Jianbo Yu
Declaration of conflicting interests
The author(s) declared no potential conflicts of interest with respect to the research, authorship, and/or publication of this article.
Funding
The author(s) disclosed receipt of the following financial support for the research, authorship, and/or publication of this article: This work was partially supported by the Fundamental Research Funds for Central Universities of China under grant no. YWF-12-LSJC-001 and Ministry of Industry and Information Technology of PRC under Fundamental Research Funds.