
Abstract
A pure two-fluid model was used for investigating transverse liquid jet to a supersonic crossflow. The well-posedness problem of the droplet phase governing equations was solved by applying an equation of state in the kinetic theory. A k-ε-kp turbulence model was used to simulate the turbulent compressible multiphase flow. Separation of boundary layer in front of the liquid jet was predicted with a separation shock induced. A bow shock was found to interact with the separation shock in the simulation result, and the adjustment of shock structure caused by the interaction described the whipping phenomena. The predicted penetration height showed good agreement with the empirical correlations. In addition, the turbulent kinetic energies of both the gas and droplet phases were presented for comparison, and effects of the jet-to-air momentum flux ratio and droplet diameter on the penetration height were also examined in this work.
Introduction
The description of liquid jet injection into a supersonic crossflow has become an important research area as the development of high-speed flight vehicles. Such a process is usually encountered in thrust vector control, external burning on projectiles, and particularly in the design of scramjet engines. For liquid fuel propulsion system, the combustion efficiency depends strongly on the breakup, atomization, and evaporation of liquid fuel jet.1–5 However, the complexity of mechanism in these physical processes makes it difficult for detailed analysis from a theoretical point, especially in compressible regimes.
Extensive experimental investigations have been carried out previously to study the spray structures.6–8 Kush and Schetz 9 used water as the liquid jet normally injected into a supersonic gas crossflow and found the liquid surface layers appear to be different in size, shape, and depth with varying jet-to-air momentum flux ratio. Schetz et al. 10 employed photographic observations to study the jet column breakup mechanism and found that the formation and behavior of the waves surrounding the jet column are insensitive to large variations in surface tension and viscosity. Lin et al. 11 investigated the structures of liquid jets injected vertically into a Mach 1.94 crossflow experimentally and used Phase Doppler Particle Analyzer (PDPA) measurement to establish distributions of droplet and spray plume properties. They found the normalized distribution profiles for droplet size and droplet velocity exhibit S and mirrored-S shapes, respectively, which are caused by the presence of the bottom floor. Perurena et al. 12 conducted an experimental investigation of a water jet into a crossing Mach 6 air flow, penetration heights for different shaped injectors were compared, and the liquid fracture was shown to be influenced by the bow shock–separation shock interaction. Based on the previous works, a jet plume model has been devised, and the schematic of the liquid jet into a high-speed crossflow is shown in Figure 1.

Schematic of liquid jet injection into supersonic flow.
However, limited numerical investigations have been seen in the literatures, which is due to the complexity of the problem both in physical and theoretical aspects. There are two common approaches to investigate the two-phase flow problem. One is the Lagrangian approach, which takes the droplets as mass points, and traces the droplets to obtain their locations and velocities individually. The other one is the Eulerian approach, which is a two-fluid model, and the droplet phase plays a role as continuum fluid. Comparing with the former approach, the Eulerian approach solves the governing equations in the Eulerian frame, which could avoid massive cost of computation for the droplet trajectories. The Eulerian approach has been widely used in simulations of incompressible regimes.13–17 Nevertheless, for modeling compressible multiphase flow, unlike the Navier–Stokes equations of the gas phase, the droplet phase governing equation system is found to be non-hyperbolic, which will lead to an ill-posed problem and produce non-physical results.18–21 In order to obtain a well-posed equation system, the kinetic theory of granular flow22–25 is introduced in the current study.
The kinetic theory of granular flow is on the basis of kinetic theory of non-uniform dense gas as described by Chapman and Cowling. 26 The main idea of the theory is to treat the particles in a dense state as continuum fluid and apply the analogy between particles in granular flow and molecules in dense gas flow. The velocity distribution of a single particle is assumed to follow the Maxwellian distribution, and a pseudo temperature for the particle phase is derived to describe the random motion of the particles, which is called granular temperature 27 with respect to the thermal temperature in gas phase. In particular, an equation of state is derived from the kinetic theory and modifies the characteristics of the governing equations of the particle phase. For the liquid injection in this article, the jet is supposed to be atomized into dense droplets plume. By assuming the breakup and atomization processes are completed quickly after the jet enters the supersonic flow, the kinetic theory is implemented consequently in the simulation of droplet phase.
The scope of this article is to construct a well-posed equation system for the droplet governing equations based on the kinetic theory and carry out the numerical simulation of transverse liquid jet to a supersonic crossflow. For turbulence modeling of the two phases, the k-ε model was applied to the gas phase with compressible correction, 28 while the one-equation kp model was used to describe the turbulence in droplet phase. 24 Characteristics analysis was employed to investigate the well-posedness of the governing equation system, and the hyperbolic nature based on the kinetic theory was then demonstrated. As the authors know, it is the initial work to extent the kinetic theory with kp turbulence model into the simulation of compressible multiphase flow. The penetration height of the liquid jet from the numerical results was compared with the empirical correlations derived from the experimental data, and good agreement was obtained. The predicted distribution of the turbulent kinetic energy of both phases indicated the shear layer is the main mixing area for the liquid jet and the supersonic crossflow air. In addition, the jet-to-air momentum flux ratio showed to be important in predicting the penetration height, while the influence of the droplet diameters on the numerical results was slight.
Methodology
Governing equations for gas phase
In this work, the Navier–Stokes equations in conservative form for the compressible gas phase were solved, and the expressions are presented as follows:
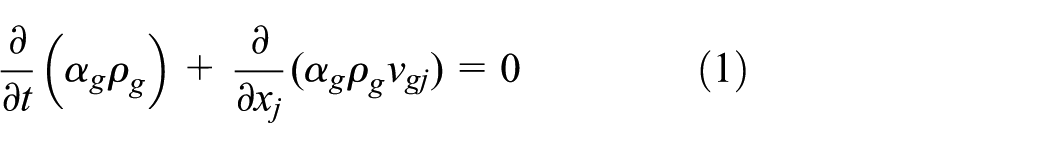
Gas phase continuity equation
Gas phase momentum equation

Gas phase total energy equation
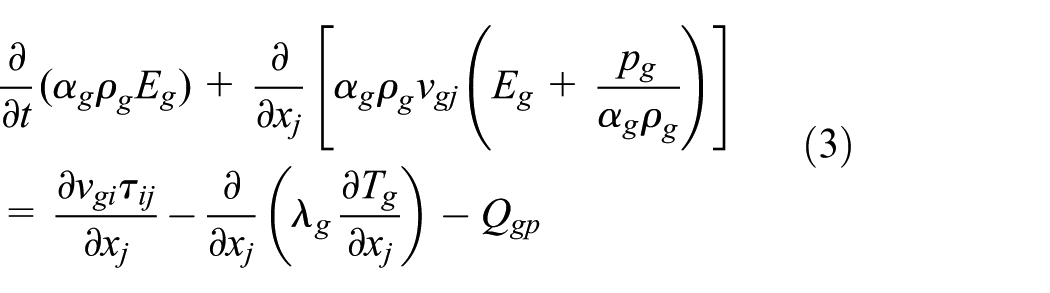
where the subscript g represents the gas phase, and αg, ρg, and vg are the volume fraction, density, and velocity of the gas, respectively. The total energy is given by

and k is the turbulent kinetic energy. Besides, pg and Tg are the gas phase pressure and thermal temperature, which follow the equation of state

and γ is the ratio of specific heats for the gas phase. The stress

where µg is the gas viscosity coefficient. In equations (2) and (3), fgpi and Qgp are the interaction source terms coupling the two phases, which will be discussed in section “Interaction modeling.”
Governing equations for droplet phase
The kinetic theory introduces the concept of granular temperature Θ used to describe the droplet random motion as molecules in the gas phase.26,27 Based on the kinetic theory, 29 the governing equations of the droplet phase can be expressed in conserved form in the Eulerian frame as follows:
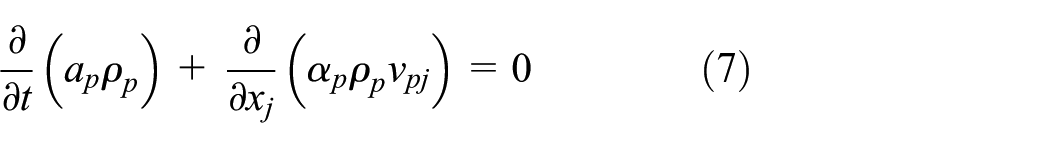
Droplet phase continuity equation
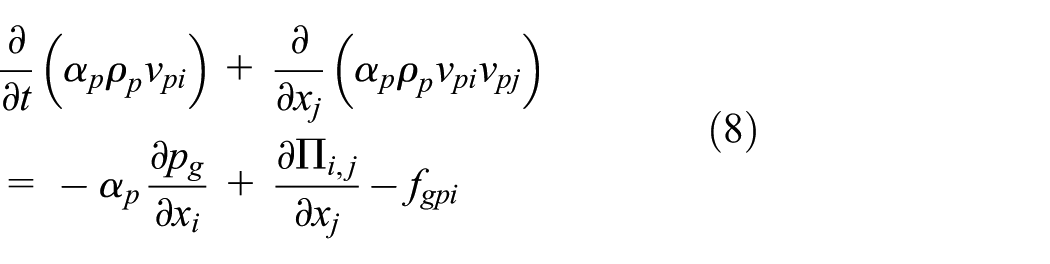
Droplet phase momentum equation
Droplet phase granular temperature equation

Droplet phase energy equation

where the subscript p represents the droplet phase, αp, ρp, vp, and Tp are the volume fraction, density, velocity and thermal temperature of the droplet, respectively, and
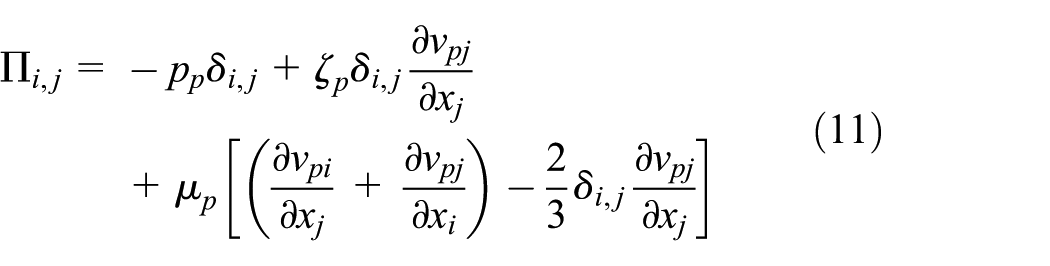
where µp and ζp are droplet phase viscosity and bulk viscosity, respectively. It should be noted that according to the kinetic theory, ζp can be expressed as

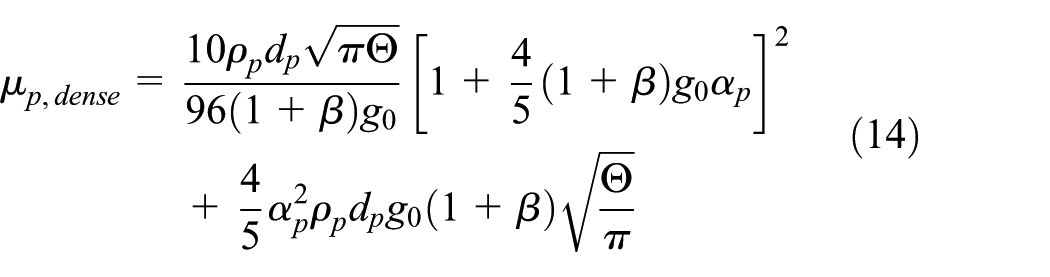
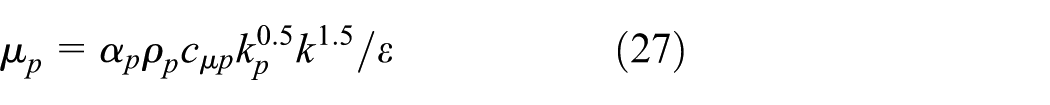
and µp is defined in dilute and dense phase conditions, respectively
Droplet phase dilute viscosity

Droplet phase dense viscosity
The differences between the two expressions lie in the collisions and subsequent interactions among droplets, which contribute to the production of the droplet phase pressure. The droplet phase pressure can be obtained by an equation of state based on the kinetic theory as

with g0 and β representing radial distribution function and the coefficient of restitution

Note that g0 should reach infinite when the volume fraction αp equals the package limit αp,max, which is 0.6 in the present study. When the droplet phase is in dilute condition and g0 then approaches 0, the “kinetic pressure” is obtained as described by Gidaspow 29

The coefficient of restitution β ranges from 0 to 1 depending on the collision regime, and set to be 0.9 in the present study. In equation (9), ΓΘ is the transport coefficient of the granular temperature, which is similarly defined for the dilute and dense conditions respectively as
Droplet phase dilute granular conductivity

Droplet phase dense granular conductivity

and ω is the dissipation term of the granular temperature

where dp is the droplet diameter.
Interaction modeling
In this study, two-way coupling was established through the source terms in the governing equations between the gas phase and droplet phase, including the momentum exchange and heat transfer. The viscous drag force is caused by the velocity slip of the two phases and expressed in terms of the mechanical droplet response time τrp, which is also called droplet motion relaxation time
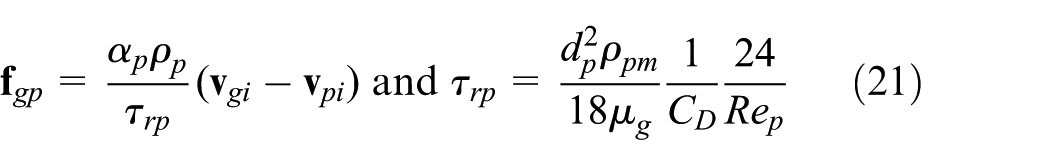
where ρpm is the material density of the droplets, and CD is the drag coefficient consisting of three separate correlations based on the range of the droplet Reynolds number Rep

In equation (3), Qgp represents the heat transfer between the two phases per unit volume, and the expression for Qgp is 30

where the correlation of droplet Nusselt number is given by

and Pr is the Prandtl number
Turbulence modeling
Turbulence of the two phases was considered in the current simulation. The two equation k-ε turbulence model with Wilcox compressibility correction was used for the gas phase. 28 In order to incorporate the turbulence of the droplet phase, the one-equation kp turbulence model was employed, while kp denotes the turbulent kinetic energy of the droplet phase, and the concept is consistent with the turbulent kinetic energy of the gas phase. Therefore, the combined k-ε-kp turbulence model 24 was presented for the compressible multiphase flow in this article.
Droplet phase turbulent kinetic energy

where the production and dissipation term in the turbulent kinetic energy equation are given by
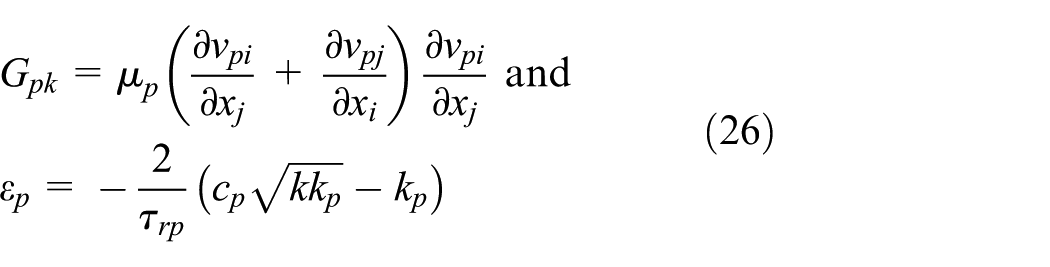
and the turbulent viscosity is defined as
The empirical constants for the two-phase governing equations above are listed in Table 1 It should be mentioned that the empirical constants were chosen in the range of common values as presented in the previous studies,15,24,25 where the constants have been examined with the experimental data.
Empirical constants in the governing equations.

Characteristics analysis
As in the compressible gas phase, the equation of state in the kinetic theory connected the granular temperature with pressure in the droplet phase. Therefore, the continuity equation, momentum equation, and granular temperature equation of the droplet phase were combined and solved simultaneously in the numerical simulation. Since the gas phase governing equations have already been demonstrated as a hyperbolic, thus well-posed system, 31 characteristics analysis was employed to investigate the well-posedness of the droplet phase governing equations.
To be concise, the hyperbolic characteristic in x direction of the governing equations was chosen to be demonstrated for representative in the present study, and the same analysis could be easily extended into the other two dimensions. Assuming the conservative variables of the droplet phase are included in
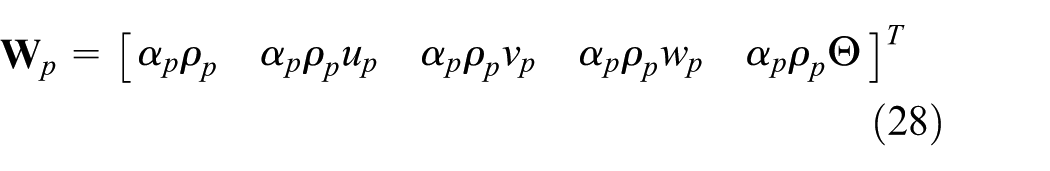
and
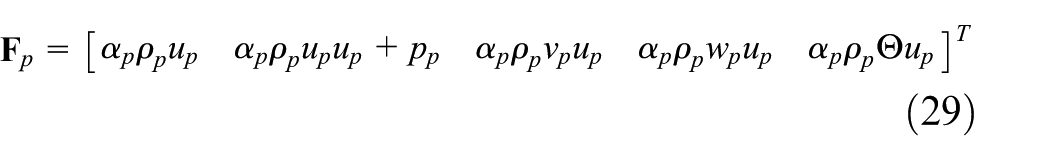
Note that the pressure in the droplet phase shear stress in equation (8) is displaced to the convection term, and in this way, the characteristics analysis for the droplet phase governing equations can be carried out subsequently. By applying the chain rule to the derivative of the convection term
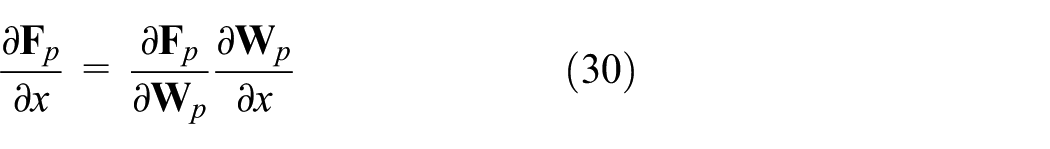
the terms on the left side of the equations (7)–(9) can be expressed in form of the Burgers’ equation

and the coefficient matrix

where
Based on the concept of diagonalization, a hyperbolic system is often defined as a system with real eigenvalues and diagonalizable coefficient matrix. 31 Therefore, diagonalization of the Jacobian matrix was tried to be conducted, and five real eigenvalues were obtained then

where
The governing equations of the gas and droplet phases were solved by finite differential method. The inviscid flux for the gas phase was computed using Roe-type Riemann solver. For the droplet phase, because of the application of kinetic theory, hyperbolic nature of the governing equation system was obtained, and the same numerical solver can be applied to the inviscid flux as in the gas phase. The face-states on the computational grid were reconstructed by Monotone Upstream-Centred Schemes for Conservation Law (MUSCL) method. To avoid un-realistic solutions, a simple modified Harten formulation was applied to satisfy the entropy condition for the Roe scheme. 33 For the viscid flux, second-order accurate central difference scheme was used. A two-step Runge–Kutta method with second-order precision was applied to integrate the equations temporally. To ensure the temporal convergence, the time step is set to be 1.0 × 10⁻⁸ s. Considering the Courant-Friedrichs-Lewy (CFL) condition, it is a quite small integration time step for explicit time marching in transient simulations.
Results and discussion
System description
The test domain is based on the experimental facility in the Virginia Tech supersonic blow down wind tunnel. 34 The experiment was conducted under the inflow Mach number 3.0 configuration. The simulations in the present study were carried out under two-dimensional condition, and the computational domain was 0.2 m × 0.18 m as shown in Figure 2. The supersonic air flow entered into the test section in the direction parallel to the flat plate, and water was used in the experiment as the transverse liquid jet, which was injected from an orifice located 80 mm downstream of the leading edge with its diameter d0 of 2.0 × 10⁻³ m. A grid system of 251 × 121 was used with refinement near the injection orifice and the flat plate wall, and the size of the minimum grid cell is 5 × 10⁻⁴ m as shown in Figure 3.

Schematic of the liquid injection into the supersonic crossflow.

Grid set 251 × 121.
In the Eulerian approach, the uniform droplet size is used since only one droplet size can be calculated by one set of droplet phase governing equations. According to the liquid spray experiment by Less and Schetz, 35 the diameter of the droplets after atomization process mostly varies from 7 × 10⁻⁶ m to 100 × 10−6 m. In this article, the breakup and atomization of the liquid jet were assumed to be completed quickly in the supersonic crossflow. 11 The breakup and atomization processes were ignored and the uniform droplet diameter according to the liquid spray experiment was used in the present simulations, which was assumed to be 30 × 10−6 m. The effect of the droplet diameter on the numerical results will be discussed later in section “Effect of the momentum flux ratio and droplet diameter on penetration height.” The inflow stagnation pressure in the experiment maintained at 4.5 × 10⁵ ± 2% Pa and the stagnation temperature was close to the ambient air. The primary parameter used in injection investigations is the jet-to-air momentum flux ratio

where
Penetration height
Since the penetration height of fuel jet injection into the combustor has great effect on the diffusive mixing of fuel and freestream air, which is needed for the preconditions of chemical reaction, many studies have been devoted to formulate empirical correlations for the liquid jet’s penetration height. The expressions for the penetration height are commonly described as functions of the momentum flux ratio, spatial distance from the orifice, and orifice diameter, such as12,35


Different definitions of the penetration height in experiments can be found in the previous investigations.8,11,12,34,35 In this article, the penetration height was obtained by the liquid jet plume boundary based on critical density of 0.1 kg/m3 of the droplet phase. Since the density of droplet phase can be obtained through the droplet phase continuity equation (7), the critical density of the liquid plume boundary is then easily recognized in the numerical results. Instead of tracking the droplets individually in Lagrangian approach, for the Eulerian approach, the number density of the droplets in each grid cell can be represented by the density of the droplet phase. Therefore, the statistical counting process for droplets in each grid cell interacted with the gas phase is unnecessary, avoiding the computation cost increase and the resulted statistical convergence problems. It is very important to demonstrate the grid independence for the numerical simulation. 36 Simulations were carried out on three different sets of grid systems, namely 231 × 101, 251 × 121, and 271 × 141. The comparison of the numerical results with the empirical correlations for the penetration height is shown in Figure 4(a) obtained with the grid set 251 × 121. It is noted that the numerical result by the current two-fluid model is well matched with the empirical correlations. The injected liquid column maintains its direction at first. After about 8d0 transverse distance from the orifice, the jet starts to incline, and the curves of penetration height turn to the inflow direction, with the progressive increasing of jet penetration into the main flow slowing down. In Figure 4(b), the penetration heights resulted from the three grid sets are compared for grid independency analysis. It can be observed that the penetration height predicted is a little higher with coarse grid. However, the overall results do not change appreciably with the grid refinement. The grid set of 251 × 121 is then employed in the following numerical simulations.

Penetration height of the numerical results: (a) comparison with empirical correlations and (b) grid independency.
Boundary layer separation
In the present study, time evolutions of the transverse liquid jet to the supersonic flow were obtained. Figure 5 shows the time evolutions of the Mach number contours from 0.4 × 10⁻³ s to 6.4 × 10⁻³ s. It is interesting to note that the boundary layer detachment, together with the bow shock and separation shock, is well described using the two-fluid model. Due to the boundary layer on the flat plate, the supersonic freestream is compressed when it enters into the computational domain, resulting in the existence of the leading edge shock near the inlet boundary. When the injected water penetrates into the supersonic flow, strong drag force acts on the high-speed air due to the high velocity slip between the two phases, and adverse pressure gradient is formed in front of the injection column, which results in the boundary layer separation and gives rise to the separation shock. Note that, initially, the separation region is small, and the separation shock and bow shock are weak. As the water injected into the main flow, the interaction force of the two phases becomes stronger, and alterations in pressure distribution near the injection are induced. The separation point is gradually moving upstream and makes the separation shock inclined, creating a further change in bow shock angle. The continuous adjustment of the shock structure is called whipping phenomena 12 and has been presented numerically by the current simulation. In addition, it can be observed that the leading shock behaves weak compared with the bow shock and separation shock, and its interaction with the bow shock has little effects on the flow structures. Actually, in the present study, when the boundary layer separation develops further toward the inlet as shown in Figure 5(a)–(e), the leading shock wave was covered up by the induced separation shock wave. With the development of time, as shown in Figure 5(f)–(i), the difference of the time evolutions of the flow structures in the Mach number contour can be found very small, indicating the numerical solution is converged.
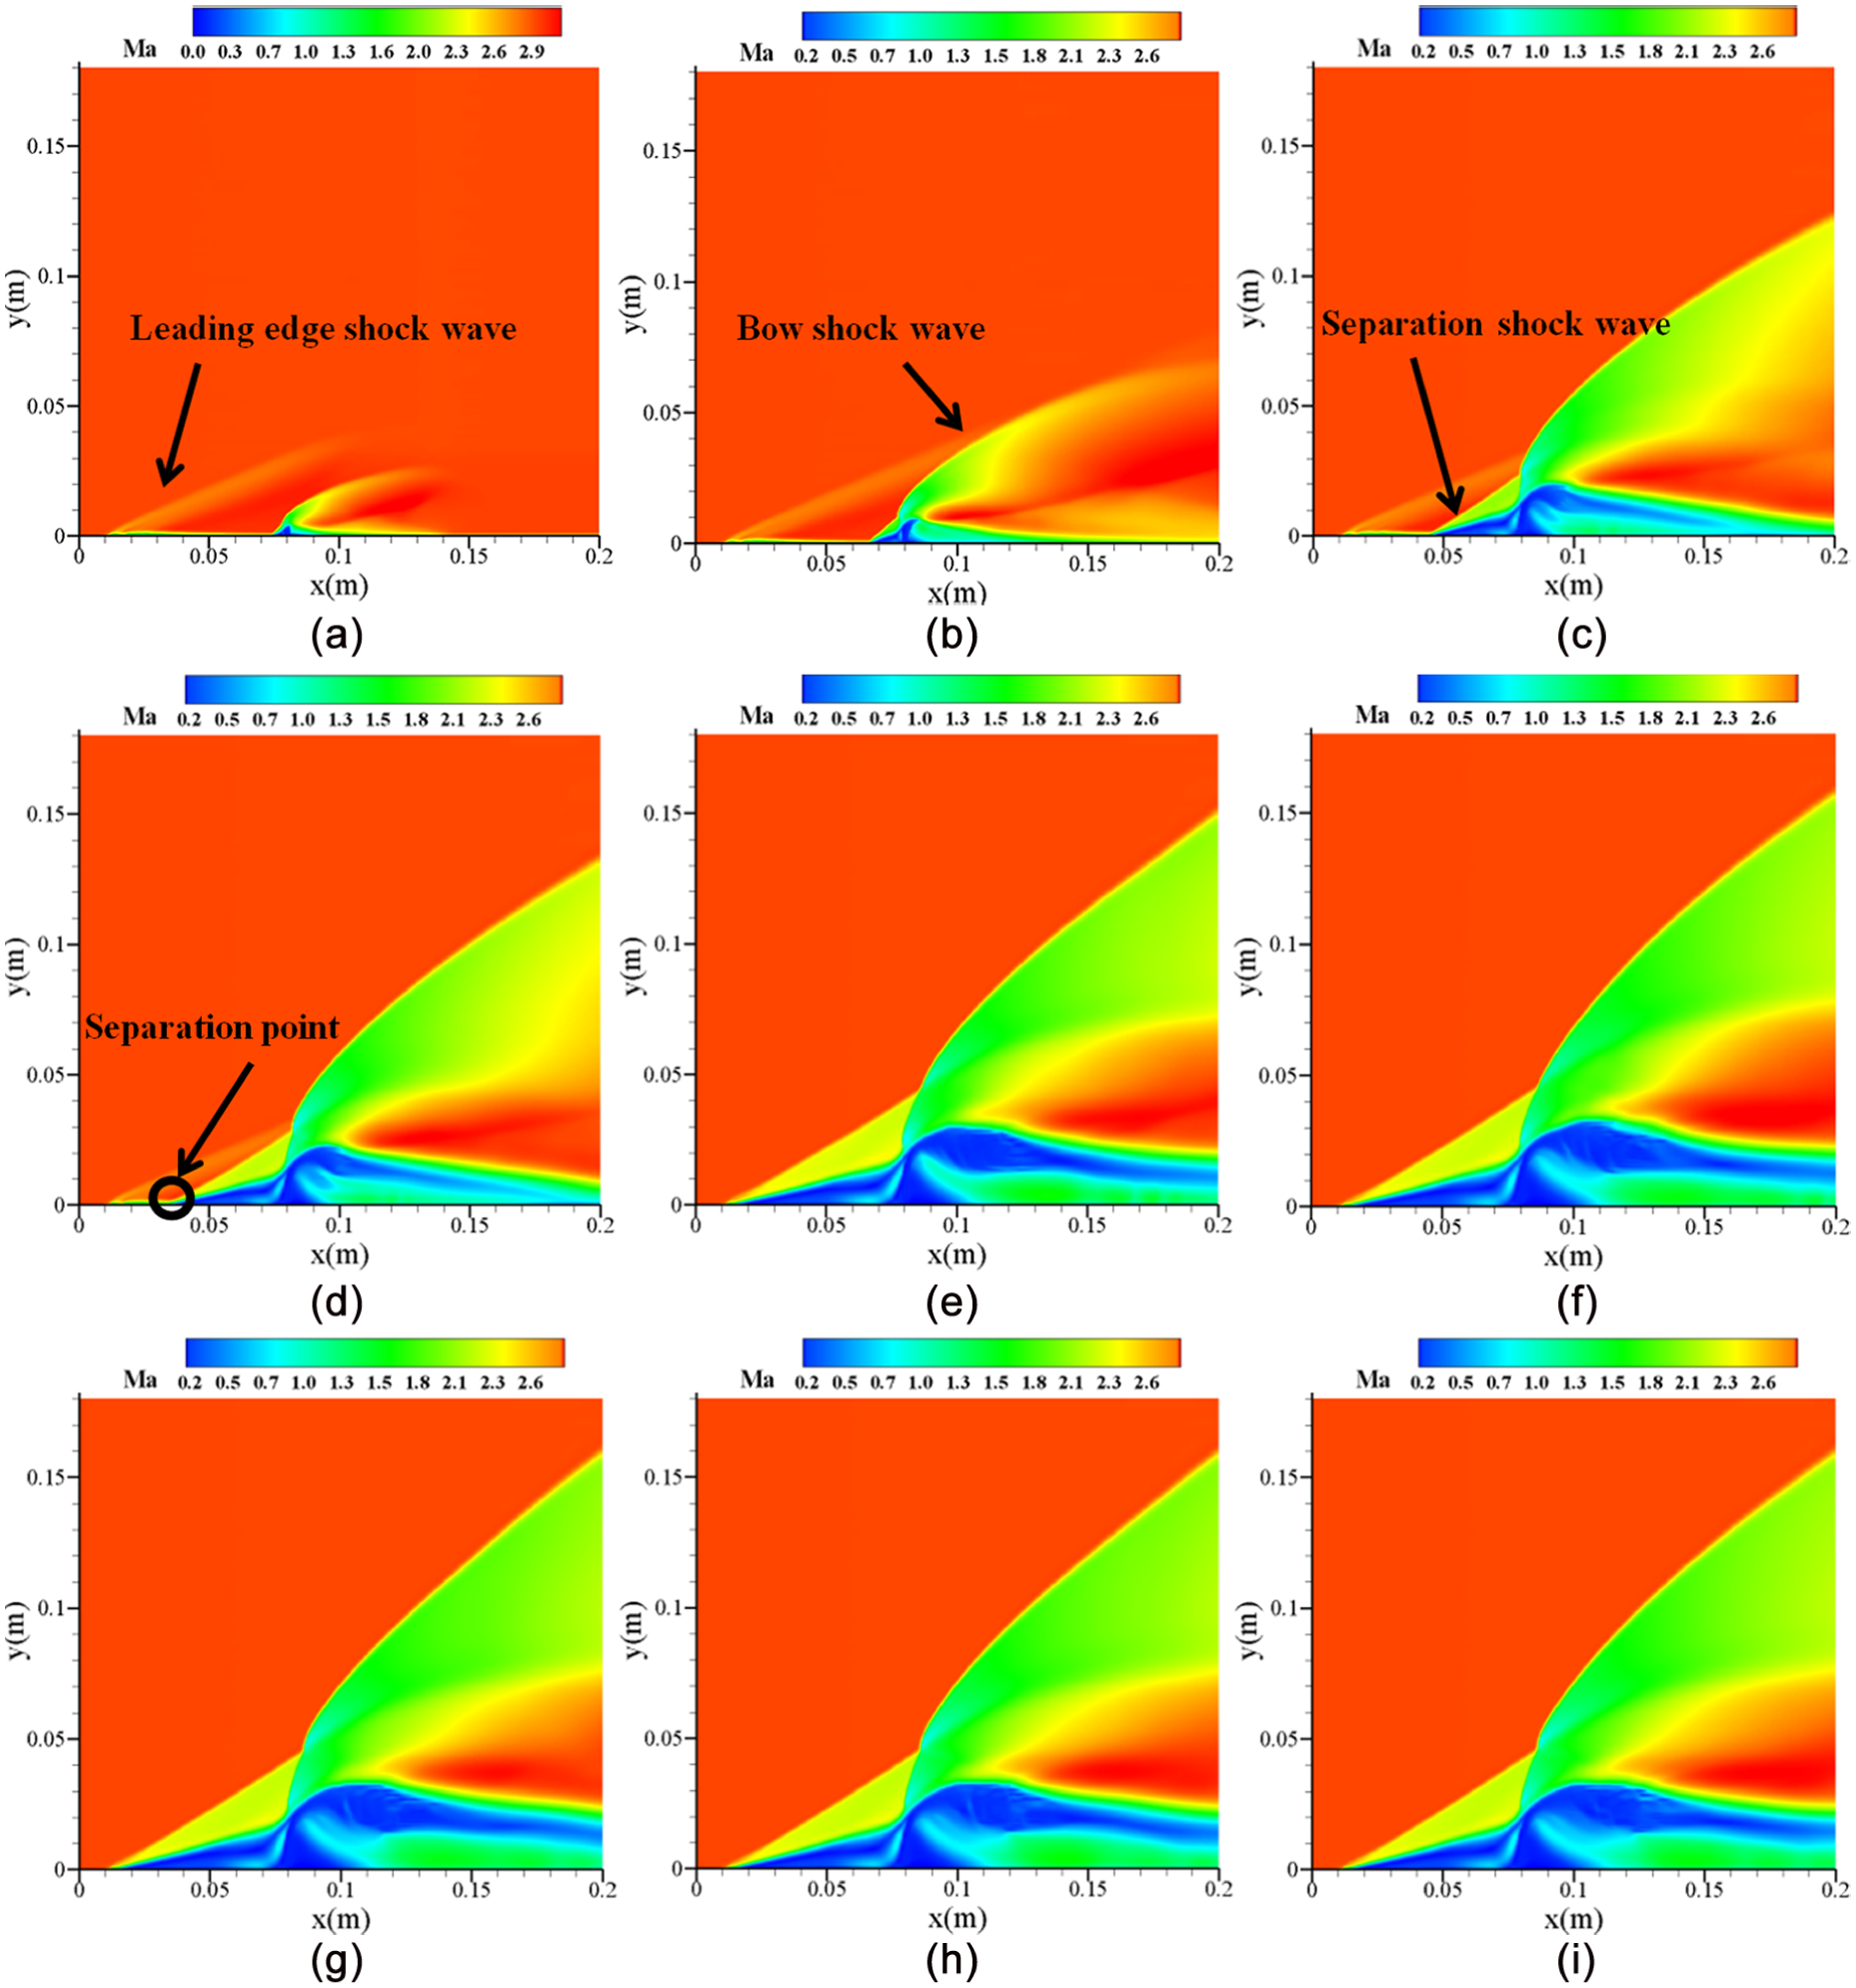
Time evolutions of the Mach number contours: (a) 0.4 × 10⁻³ s, (b) 0.8 × 10⁻³ s, (c) 1.6 × 10⁻³ s, (d) 2.4 × 10⁻³ s, (e) 3.2 × 10⁻³ s, (f) 4.0 × 10⁻³ s, (g) 4.8 × 10⁻³ s, (h) 5.6 × 10⁻³ s, and (i) 6.4 × 10⁻³ s.
As discussed above, separation of the boundary layer can be seen in front of the jet column. For a close inspection, the vector contour of the gas phase velocity is shown in Figure 6. Due to the separation, a circulation zone is formed, and the velocity of the gas phase decreases to subsonic state. The height of the circulation zone is observed to be about 8d0, the same as the inclination point of the jet penetration curves shown in Figure 6, indicating that the reduced velocity of the gas phase caused by the boundary layer separation could benefit the penetration height.

Vector contours of the gas phase velocity.
Since the liquid fuel droplets can be captured by the recirculation zone, the pre-mixing of the fuel with air may occur in this area. Furthermore, the low-speed flow in the recirculation zone provides the mechanism for stabilizing the combustion flame, as in the scramjet combustor where liquid fuel is injected into the supersonic crossflow. Figure 7 shows the droplet phase density distributions in different streamwise locations of the recirculation zone, namely x1 = 0.065 m, x2 = 0.070 m, and x3 = 0.075 m, respectively. The present simulation obtains the droplet phase entraining into the recirculation zone in front of the liquid jet. The predicted droplet phase density increases when the streamwise location approaches the jet, and the captured droplets show to concentrate near the bottom wall. Although the captured droplets are limited, the existence of the pre-mixing process plays an important role in holding the flame in supersonic freestream condition.
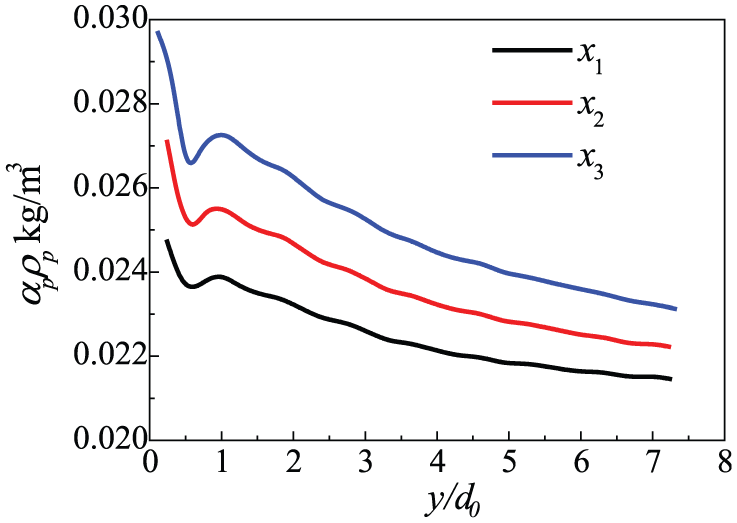
Droplet phase density distributions in the recirculation zone.
It can be expected that the liquid injection in the supersonic flow should result in great changes in pressure distribution in the flow field. Figure 8 shows the pressure profiles in different y locations along the direction of the supersonic inflow. The adverse pressure gradient begins with the separation shock and maintains high pressure in the circulation zone as exhibited on the wall at y = 0 m, which reveals the reason for the boundary layer detachment. Moreover, the separation shock gives rise to the first increase of pressure at y = 0.03 m. After that, the pressure increases more rapidly in the shock interaction point, resulting in the highest value in the pressure field. For pressure distribution at y = 0.1 m, the original flow field developed by the inflow condition is not disturbed until the bow shock appears above the jet plume, leading to the peak value in the pressure profile. It can be noted that the shock waves in the flow field may cause strong resistance for the inflow air.

Pressure profiles along the inflow direction in different vertical locations.
In numerical simulations, the resistance of the liquid jet to the supersonic inflow air is exerted by the drag force in the source terms of the momentum governing equations (2) and (8). As a result, the two-way coupling computation will cause a great amount of total pressure loss for the supersonic crossflow. To evaluate the influence of the drag force, the total pressure recovery ratio, defined as the ratio between the total pressure p0 in the internal flow field and the initial inflow total pressure p0, total, has been employed in this study. Figure 9 shows the contours of the total pressure recovery ratio. It can be found that there is a large total pressure drop when the supersonic inflow air encounters the liquid jet. In addition, the induced bow shock and separation shock also cause the total pressure loss. Figure 10 shows the distributions of the total pressure recovery ratio along y direction in three different streamwise locations, namely, x1 = 0.01 m, x2 = 0.10 m, and x3 = 0.18 m. In the x1 location, there is nearly no total pressure loss. However, for locations x2 and x3 behind the liquid jet, the total pressure recovery ratio decreases to 0.05 in the lower part of the spray plume. The contributions of the bow shock to the total pressure loss can be also recognized easily in the distributions with a sudden drop identified in the profiles.
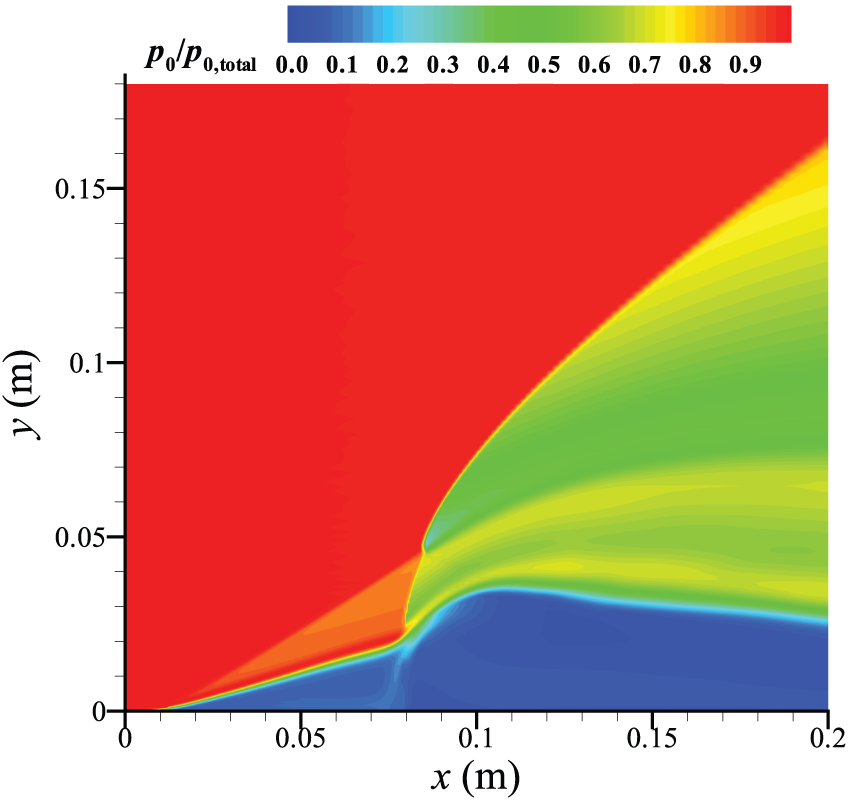
Contours of total pressure recovery ratio.

Distributions of total pressure recovery ratio in different streamwise locations.
Turbulent kinetic energies for two phases
Figure 11 shows the turbulent kinetic energies for the air flow and liquid jet. It can be seen that the distribution of the turbulent kinetic energies of the two phases is different. The intensity of the gas turbulence seems to be strong in the circulation zone in front of the jet column and also in the shear layer between the liquid and air stream. This phenomenon can be explained by the large velocity gradient of the gas phase, which appears in these regions and results in strong turbulence there. However, for the droplet phase, the initial part of the jet from the orifice is not disturbed by the gas phase evidently. As the jet penetrates further, in the region where the jet starts to incline to the supersonic inflow direction, the turbulent kinetic energy of the droplet phase is increasing. Note that the shear layer is the main area for the momentum exchange between the two phases, and the velocity of the droplet phase experiences great changes, which may account for the intensified turbulence of the droplet phase there. Therefore, the shear layer is found to possess great significance in the mixing of the fuel jet with the supersonic air flow.

Turbulent kinetic energies of the gas phase and droplet phase: (a) gas phase and (b) droplet phase.
Effect of the momentum flux ratio and droplet diameter on penetration height
In the transverse gas injection regimes, there are many crucial parameters that have important impacts on the transverse flow field, such as the jet-to-momentum flux ratio, the geometric configuration of the injection orifice, the number of injection orifice, and the injection angle. Among these parameters, the jet-to-crossflow momentum flux ratio implies the energy of the transverse jet in comparison with the crossflow. For the gas injection, the jet-to-crossflow momentum flux ratio shows to be a key parameter which influences the transverse flow field, including the shapes of the bow shock wave, the separation point of boundary layer, and the Ω-shaped vortices. 37 For the liquid injection regime, the jet-to-crossflow momentum flux ratio shows its significance by the penetration height of the liquid jet as the empirical correlations (35)–(38) have revealed, which is the most concerned parameter in liquid jet experiments. In Figure 12, the predicted penetration heights of different momentum flux ratio q varying from 3 to 6 are compared. The inflow condition in different cases remains the same, while the jet velocity is modified with respect to q. It is shown that the penetration heights are increasing with the momentum flux ratio. The initial states of the injection out of the orifice are similarly perpendicular. However, the jet with larger injection velocity gains more inertia and is supposed to penetrate deeper into the main flow, leading to the changes of jet inclination points. After the jets inclination, all of the penetration height curves are almost parallel to each other propagating downstream.

Droplet penetration height of different jet-to-air momentum flux ratios.
In this article, the breakup and atomization of the liquid jet were assumed to be completed quickly, and uniform diameter of droplets was used in the current simulation. To examine the effect of droplet size on the penetration height, in this section, different diameters of droplet phases were tested. In Figure 13, the predicted penetration heights of the liquid jet with droplet diameter varying from 10 × 10−6 m to 40 × 10−6 m were obtained under the condition of momentum flux ratio q = 6. It is shown that the larger droplets seem to penetrate a little higher than the smaller ones because of the inertia effect. However, the drag force acted on droplets also increases as the droplets become larger, and the difference in penetration heights appears to be slight as the droplet diameter further increasing. Therefore, it can be the seen that the uniform droplet diameter assumption has small influence on the numerical results.
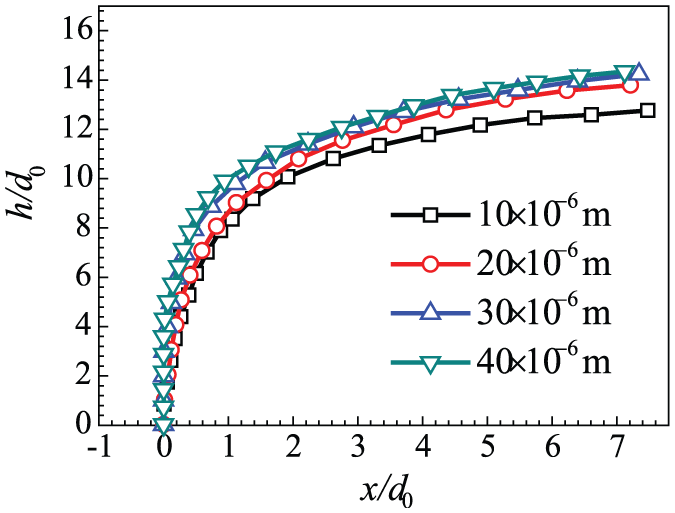
Droplet penetration height of different droplet diameters.
Conclusions
A liquid jet into supersonic crossflow has been investigated numerically using the Eulerian approach. The kinetic theory of granular flow was introduced to simulate the droplet phase, and hyperbolic nature of the governing equation system for the droplet phase was demonstrated through characteristics analysis. Therefore, a well-posed problem was established for compressible multiphase flow based on the kinetic theory. The comparison between the penetration height predicted by the numerical work with the empirical correlations derived from experiments was conducted and showed good agreement. The boundary layer separation induced by the adverse pressure gradient in front of the liquid injection was observed with droplet phase captured in the recirculation zone. The whipping phenomenon caused by the bow shock and separation shock interaction was also well described numerically. In addition, a great amount of total pressure loss was predicted when the supersonic freestream enters the spray plume. The present simulation shows that the k-ε-kp turbulence model is adaptable in compressible multiphase flow and gives a good description of the turbulent flow field of liquid jet injection. The shear layer between the liquid jet plume and the inflow air is found to be an important area for the momentum exchange and mixing process between the two phases. The effects of jet-to-air momentum flux ratio and droplet diameter on the penetration height were examined in the present study, and the liquid jet shows to penetrate deeper into the supersonic flow with larger momentum flux ratio, while the influence of the droplet diameter is slight.
Footnotes
Appendix 1
Academic Editor: Moran Wang
Declaration of conflicting interests
The author(s) declared no potential conflicts of interest with respect to the research, authorship, and/or publication of this article.
Funding
The author(s) disclosed receipt of the following financial support for the research, authorship, and/or publication of this article: This research was supported by the National Natural Science Foundation of China under Grant Nos 51176099 and 51390493.