
Abstract
Rolling bearing is of great importance in rotating machinery, so the fault diagnosis of rolling bearing is essential to ensure safe operations. The traditional diagnosis approach based on characteristic frequency was shown to be not consistent with experimental data in some cases. Furthermore, two data sets measured under the same circumstance gave different characteristic frequency results, and the harmonic frequency was not linearly proportional to the fundamental frequency. These indicate that existing fault diagnosis is inaccurate and not reliable. This work introduced a new method based on data-driven random fuzzy evidence acquisition and Dempster–Shafer evidence theory, which first compared fault sample data with fuzzy expert system, followed by the determination of random likelihood value and finally obtained diagnosis conclusion based on the data fusion rule. This method was proved to have high accuracy and reliability with a good agreement with experimental data, thus providing a new theoretical approach to fuzzy information processing in complicated numerically controlled equipments.
Introduction
As one of the critical parts in rotating machinery, rolling bearing has high probability of failure when exposed in an undesirable working environment. Vibration-based rolling bearing fault diagnosis has always been a hotspot, whose critical research point lies in eliminating overwhelming background signals, which can totally cover fault signal and noise signal and thus makes them undetectable.1–2 Accurately extracting fault signal is a necessity for a reliable diagnosis. Plenty of significant research has been conducted using following methods:3–6 (1) ferrographic analysis and ferromagnetic analysis whose acceptance is restricted due to high cost; (2) information processing methods, such as wavelet transform, kernel principal component analysis, neural network, ant colony algorithm, and so on; (3) multi-sensor data fusion method, including Dempster–Shafer (D-S) evidence theory, fuzzy diagnosis, rough set theory, and so on. Until now, the most widely accepted method is multi-sensor data fusion method based on vibration detection. By solving fault diagnosis governing equation, essential parameters are analyzed around characteristic frequency in time-domain, frequency-domain, or time-frequency-domain, and then information containing fault feature is extracted using data processing technology. However, a disagreement was found, as shown in this work, between theoretical calculation based on above method and experimental data, which has not been reasonably explained by now. This work introduces a new method based on data-driven random fuzzy evidence acquisition and D-S evidence theory and a good agreement with experimental data has been accomplished.
Traditional rolling bearing fault diagnosis based on characteristic frequency and its potential issue
Conventional rolling bearing fault diagnosis based on characteristic frequency calculation and experimental verification
When a fault occurs, a significant change in vibration pattern between rolling bearing with bearing pedestal and equipment shell can be observed (Figure 1). This kind of vibration pattern change would generate a periodic signal characterized by certain fault-position-dependent frequencies. Such characteristic frequencies regarding different fault positions are given below


Setup (top) and schematic (bottom) of the roller-bearing fault diagnosis system.
where
Rolling bearing of 6308 type was chosen in experiments. The rolling bearing properties used were
Potential problem in traditional fault diagnosis
The experimental data do not agree well with theoretical results, which indicates the following potential problems within this traditional fault diagnosis method:7,8
The theoretical results fail to agree with the experimental data.
The experimental data are not repeatable.
There is interharmonic error between the second and third harmonics.
Due to the uncertainty of operational environment, such as sensor position, background noise, environment temperature, as well as sensor shifting error and human factor, experimental data are, not surprisingly, random and fuzzy. Therefore, it cannot be accurately predicted by equations (1)–(5). In order to overcome this problem, this work proposed a new method relying on data-driven random fuzzy evidence acquisition and D-S evidence theory.
The method is based on data-driven random fuzzy evidence acquisition and D-S evidence theory. Establishing fault fuzzy system and making data fusion a likelihood measurement value are defined as diagnostic standard to describe the degree to which fault sample and fuzzy database are related. This value reflects the likelihood of fault occurrence, namely, higher value, higher fault probability. Therefore, instead of simply calculating characteristic frequency, this method actually takes the environment factors’ influence into account, which is more realistic and thus improves the diagnosis accuracy.
Fault fuzzy expert system and sample data set matching
Figure 2 shows the signals corresponding to good and faulty conditions along with their frequency spectrum. Based on a large quantity of existing experimental data measured on a variety of rolling bearing fault types, fault fuzzy expert system and fault sample data set were obtained by the following steps.

The signals corresponding to good (a) and faulty, (b) conditions along with their frequency spectrum.
The establishment of fault fuzzy system
Make observations for n times with time interval
Calculate the arithmetic mean value of kth data set

Calculate standard deviation
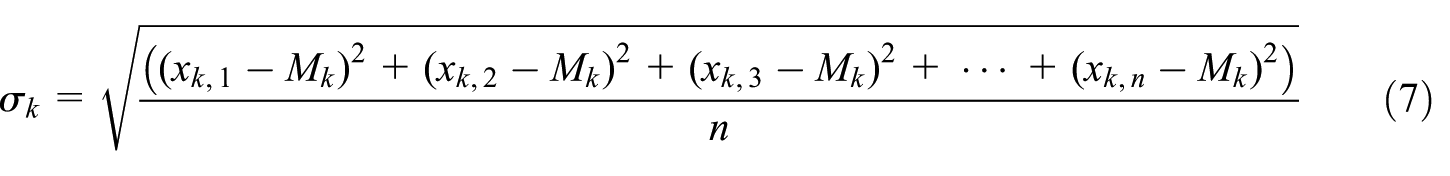
Obtain Gaussian membership function
Establish the membership value of fuzzy expert system for fault diagnosis based on m data set

where x is the sensor measurement value,
Take the outer race fault as an example. Consider the first three characteristic frequencies; thus, only three Gaussian membership functions are obtained. If inner race fault, outer race fault, rolling element, and rolling bearing track are all studied simultaneously, this leads to 12 Gaussian membership functions. Limited by experiment condition, only nine Gaussian membership functions related to inner race fault, outer race fault, and rolling element fault were studied in this work, which were later proved to be sufficient to validate the accuracy of fuzzy expert system diagnosis.
Membership value of fault sample
The procedure for the determination of membership function of the samples is as follows: first, observations are made for n times with time interval

where
Data matching and fusion
The process is as follows. First, match fault sample data with fuzzy expert system in terms of Gaussian membership functions, identify fault feature, and determine fuzzy likelihood. Then, normalize matching value and calculate basic probability assignment (BPA)
9
from data fusion of fuzzy evidence data system. BPA here means fault detect evidence. The determination of BPA, which is the main and first step in D-S theory, is still an open puzzle. The result data are used to build a normal distribution–based model for each attribute of the data. Then, a nested structure BPA function can be constructed, using the relationship between the test data and the normal distribution model. Figure 3 shows likelihood value as a function of frequency for outer race fault sample and fuzzy rule base. Take the 1X frequency of outer race as a reference; fault sample membership curve is obtained with parameters
Outer race fault membership curve around 1X characteristic frequency compared with fuzzy rule base.
Random sets and fuzzy sets
Assume
Assume

where
Similarly, the random set for fault sample can be defined as

If fuzzy fault feature parameters
Failing to predict the occurrence of fault, however, does not necessarily indicate the orthogonality of the data set. In some cases, there exists similarity between fault sample and fuzzy database. Therefore, it is fair to define a likelihood measurement value, which describes the degree to which fault sample and fuzzy database are related. This value reflects the likelihood of fault occurrence, namely, higher value, higher fault probability. Correspondingly, we can get

Equation (13) shows a minimum filter operation between
Data fusion rule
After normalizing
Maximum BPA should exist and must be larger than 0.5 for fault to occur.
Uncertainty m(⊙) should be below some certain threshold which is defined as 0.2 here.
The BPA criterion for fault occurrence should have at least 0.2 difference value with other BPA.
Results and discussion
Validation of fault diagnosis method
All the previous work first extracted feature information related to the calculated characteristic frequencies, followed by the time-domain, frequency-domain, as well as time-frequency-domain information processing based on rough set, wavelet packet theory, and so on.11–12 Fault diagnosis method therefore can be obtained by information fusion technology. Based on the above analysis, this work proposes a new data-driven fuzzy fault diagnosis method,13–16 which is also applicable to the driven data set. In order to validate this method, we conducted experiments with parameters
The application capability of diagnosis methods
All the previous work was conducted under same operational environment, namely, the same experiment table, same background temperature, and so on. A total of n data sets were measured and then separated into two groups, one containing n − m data sets and the other one consisting of the remaining m data sets. These two groups were for concluding diagnosis method and validation purpose, respectively. Due to same operational environment, there is high consistency and similarity among n data sets, which make validation of the method less convincing and less applicable to other fault type or even the same fault type but measured under different environment. The high accuracy arising from the data consistency has always been controversial in this field. Fuzzy expert system with 200 data sets from rolling bearing A is established and then this fuzzy expert system is used to test 40 data sets from rolling bearing B with outer-bearing fault following the diagnosis method introduced in this article. The important parameters of fuzzy expert system of rolling bearing A and fault sample rolling bearing B are listed in Table 1.
Diagnosis methods verification by inverse analysis based on 200 data sets.

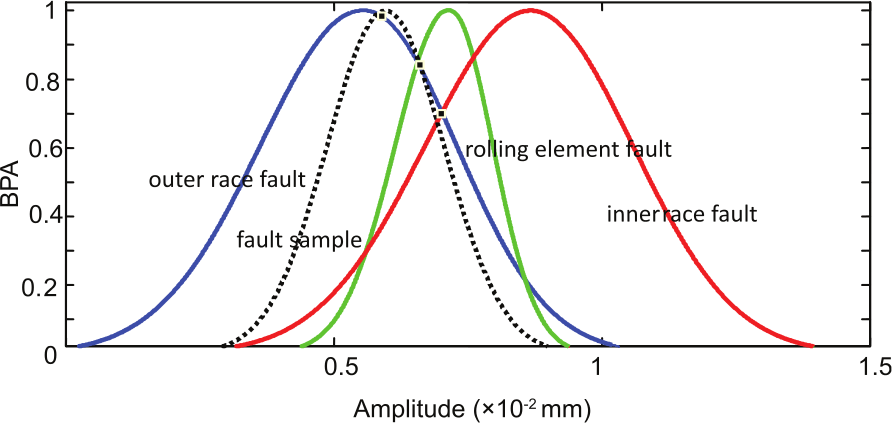
Figure 3 shows data fusion of membership curves from fuzzy expert system and fault sample at 1X, 2X, and 3X frequencies. The likelihood value with respect to these three fault types is then obtained from Figure 4. The values are concluded in Table 2.
Data fusion of membership curves from fuzzy expert system and fault sample at (a) 1X, (b) 2X, and (c) 3X frequencies.
Parameters in fuzzy expert system of rolling bearing A and fault sample rolling bearing B.

There are two effective and reliable methods for validation. 17 One is replacing with an unknown fault type rolling bearing and then following the procedure as introduced above to conclude diagnosis result.18,19 If a good agreement with the actual sample fault type can be obtained, the feasibility of the proposed method is thus validated. Although this method is highly accurate, detecting the actual fault type of this arbitrary rolling bearing experimentally requires extra work, which makes it less operable. The other one is to replace with a known fault and then following the same procedure as above. This method clearly avoids the fault detecting problem in the first method. So the following work is based on the second method, which first establishes fuzzy expert system with 200 data sets from rolling bearing A and then uses this fuzzy expert system to analyze another 40 data sets from rolling bearing B with known outer-bearing fault. If the fault diagnosis result is outer-bearing fault, the feasibility of the proposed method can thus be validated. The important parameters on fuzzy expert system of rolling bearing A and fault sample rolling bearing B are listed in Table 3.
Likelihood value of three fault types.

D-S fusion: Dempster–Shafer fusion.
After normalizing data from Table 4 and applying D-S evidence data fusion, BPA values for the three fault types are obtained, which are listed in Table 4. From Table 4, the diagnosis results indicate that rolling bear B had outer race fault which matched experiments very well, thus demonstrating high accuracy of this diagnosis method based on data-driven random fuzzy evidence acquisition and D-S evidence theory.
BPA values for the three fault types.

BPA: Basic Probability Assignment; D-S data fusion: Dempster–Shafer data fusion.
Table 5 shows the comprehensive evaluation of the three fault types. According to this table, it is clearly shown that the fault diagnosis method based on data-driven random fuzzy evidence acquisition and D-S evidence theory has very high diagnosis accuracy, which provides a promising diagnosis method in equipment safety monitoring.
Comprehensive evaluation regarding the three fault types.

Conclusion
As an increasing requirement in the safety of large computer numerically controlled (CNC) equipment, fault diagnosis, condition monitoring, and fault prediction have drawn more and more attention recently. This work introduced a data-driven fuzzy random evidence acquisition method combined with D-S evidence data fusion, which shows good agreement with experimental data and proves to be accurate and reliable. Therefore, this work provides an effective approach for condition monitoring and fault diagnosis.
Footnotes
Academic Editor: Duc T Pham
Declaration of Conflicting Interests
The author(s) declared no potential conflicts of interest with respect to the research, authorship, and/or publication of this article.
Funding
The author(s) disclosed receipt of the following financial support for the research, authorship, and/or publication of this article: This work was supported by the National Natural Science Foundation of China (Grant No. 51075220), A Project of Shandong Province Higher Educational Science and Technology Program (Grant No. J13LB11), Specialized Research Fund for the Doctoral Program of Higher Education (Grant No. 20123721110001), and Science & Technology Basic Research Program of Qingdao (Grant No. 12-1-4-4-(3)-JCH).