
Abstract
Cavitation is a major undesirable phenomenon for centrifugal pump because it can cause hydraulic performance deterioration, pump damage by pitting and material erosion, and structural vibration and noise. Cavitation can appear within the entire range of the operating conditions; therefore, it must be prevented by all means. Sensorless monitoring technology based on motor current signature analysis is non-intrusive and economic for monitoring motor-driven equipment. Thus, this technology is suitable for centrifugal pump systems. The motor current signature for centrifugal pump load at the cavitation condition is the basis of this technology. However, systematic research is lacking on sensorless monitoring technology based on motor current signature. As a result, the tentative exploration for motor current signature at cavitation load was conducted in this study. The results show that the stator current is still a sinusoidal alternating current strictly to the law of sine. Moreover, the root mean square of the current fluctuates because of different flow regimes in the cavitation progress and decreases because vapor density is smaller than water density when cavitation is fully formed. For the stator current spectrum, the noise level, noise distribution, rotation speed, and vane pass frequency components show features in the cavitation process. These indicator indexes change according to the stage of cavitation development. Thus, the motor current signature analysis is found to be a feasible and cost-effective method for the stages of cavitation condition.
Introduction
According to the Hydraulic Institute, pumping systems are responsible for approximately 20% of the total energy consumption of different industries. Centrifugal pumps are among the most used pump types in mining, petrochemical industries, and so on. 1 Cavitation is a major undesirable phenomenon that occurs in the operation of centrifugal pumps. Cavitation in pumps appears when the absolute static pressure at some point within a pump falls below the saturated vapor pressure of the fluid, thus resulting in the occurrence of vaporization. The vaporization of the flowing fluid is related to the onset of bubbles, which are caught up by the flowing liquid and collapses within the pump when they reach a high-pressure region. This process is accompanied by a deterioration of hydraulic performance, damage to the pump by pitting and material erosion, and structural vibration and noise.2–4 Cavitation can appear at all flow rates; therefore, this condition must be prevented by all means. To prevent this problem, we have to know the onset and development of cavitation in a pump.5,6
In addition to the variables directly related to the hydraulic performance of the pump, such as pressure and flow rate, other variables have also been used. In Ray, 7 a dynamic pressure sensor was used to measure pressure at the inlet and outlet of the pump to detect cavitation. Vibrations in the directions of the three orthogonal coordinate axes (x, y, and z) were also monitored.
As a general rule, most works in this area are based on the search for particular spectral components in the monitored variables related to cavitation. One of the main drawbacks of this technique is the installation of sensors in pumps and other difficult-to-access facilities, thus leading to an increase in overall system cost because additional sensors need additional cabling. Such sensors also have low reliability; hence, they fail more often than the system being monitored. This situation reduces the overall robustness of the system. In some cases, accessing the pump is difficult to access when installing sensors. One such example is the case of submersible pumps, which hinders the installation or maintenance of sensors once the pump is underwater. For the above-mentioned problems, the online condition system was only adopted in pumps for important processes.8,9
Given that most centrifugal pumps are driven by an induction motor, motor current signature analysis (MCSA) technology provides a new way to solve these problems. 10 The main principle of this technology is to set the motor as a torque sensor, extract equipment operation information, and use the information to determine the operation condition of the driven equipment. 11
Compared with the conventional method, this technology has the following advantages: first, motor electrical signal acquisition is non-intrusive and does not need to be conducted near the operation equipment because this technique can complete the monitoring of multiple devices in the power distribution room; second, compared with vibration monitoring, this approach is cheap. Almost all the dynamic information of the motor and driven equipment is directly reflected in the stator current signal or transient power signal information. At the same time, it has high integration with high-performance price ratio.11–13
The use of motor stator current sidebands as indicators of cavitation is attractive. However, most literature on the cavitation detection of centrifugal pumps is based on techniques that require the measurement of either vibration or other process-based signals. 7 Few peer-reviewed publications deal with this technology in centrifugal pumps. In Perovic, 14 fault signatures were extracted from the motor current spectrum by relating the spectral features to the individual faults to detect cavitation, blockage, and damaged impeller condition. A fuzzy logic system is also developed to classify the three faults. The authors concluded that adjustments to the rules or the membership functions are required; thus, the differences in the pump design and operating flow regimes can be considered. However, the author did not demonstrate how to change the rules to adapt to different situations. Harihara12,13 described a model-based fault detection system for diagnosing centrifugal pump cavitation from the motor current.
Most of the detection schemes presented in the above-mentioned literature for cavitation detection are based on either tracking the variation of the characteristic fault frequency or computing the change in the energy content of the motor current in certain specific frequency bands.15,16 However, they do not mention the motor current signature for the development of the cavitation system, which is the application foundation for cavitation diagnosis by MCSA. Thus, this article focused on motor current signature for centrifugal pumps within the cavitation development process and on the extraction of operation information from the motor current.
Experimental details
Test bed
To evaluate the theoretical predictions and diagnostic study, a pump test rig was constructed to simulate the pump operation at different conditions. The rig consisted of an integrated centrifugal pump, water tank, suction line, and discharge line (Figure 1). This construction forms a closed loop for water circulation (Figure 2).

Schematic of the pump test system.

Photograph of the pump test system.
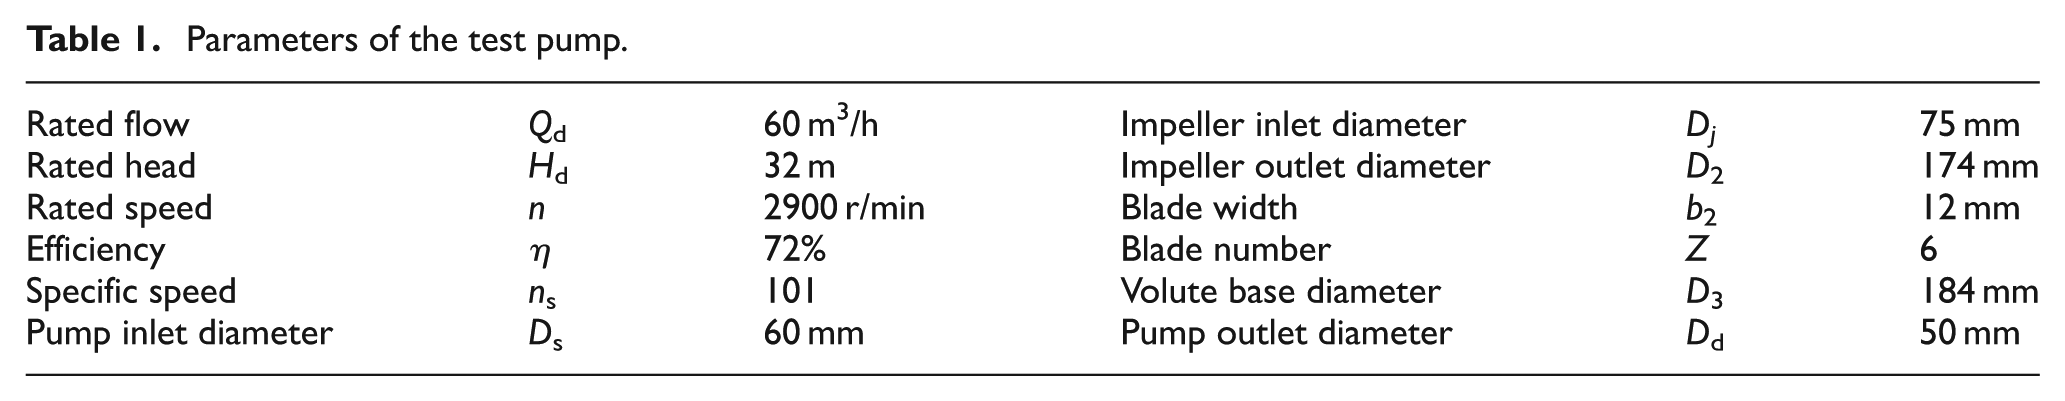
The left tank is the cavitation tank. This tank works with a vacuum pump and is used for cavitation operations. The right tank is called the stable flow tank and is used to stabilize the flow. The centrifugal pump is mounted with its impeller in a horizontal plane and outlet flange of 2 m below the water surface in the cavitation tank. The stainless steel pipes that carry the upstream and downstream of the pump have diameters of 60 and 50 mm to match the pump suction and discharge flanges. The capacity of the tanks is based on the maximum flow rate. Hence, the water temperature in the system can be maintained at 1°C for more than 1 h, during which full measurements can be completed at different flow rates. The centrifugal pump data are shown in Table 1, and the pump characteristic curves are shown in Figure 3.
Parameters of the test pump.

Characteristics of the test pump.
Data acquisition test system
To monitor pump performances, an induction coil, which can detect the leakage flux of the motor, is used to measure the pump speed. A flow sensor is installed in the discharge line. Furthermore, two pressure sensors are installed in the suction and discharge lines, respectively, for pump delivery head measurement. The current and voltage of the pump motor are measured using the Hall sensor (Figure 4).

Photograph of the pump test system.
The multifunction data acquisition board PXI-6251 is used because of the large number of measured parameters and various outputs in the sensors (Table 2).
Test instrument parameters.
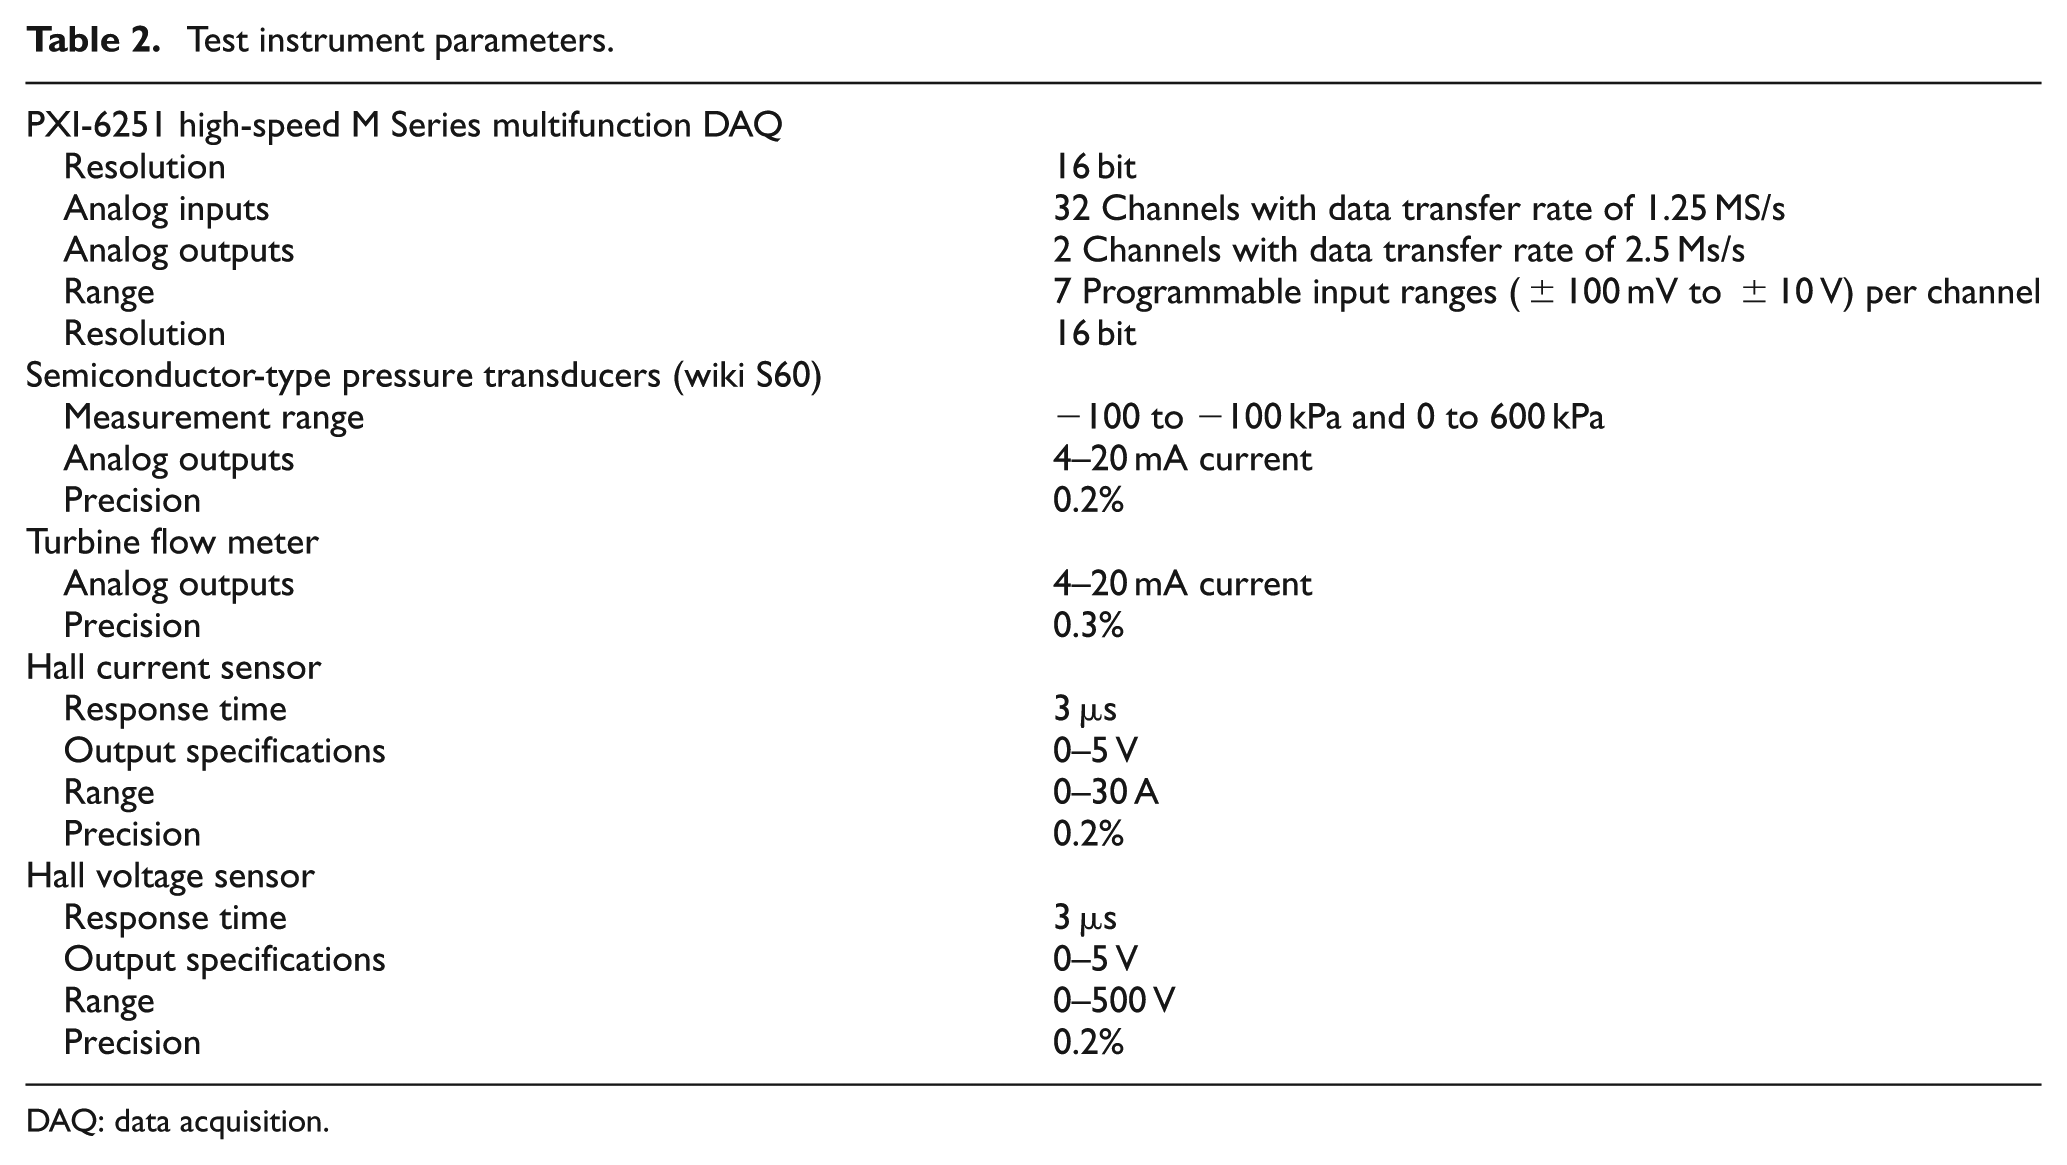
DAQ: data acquisition.
Experiment process
The experiment data were measured under the following two situations:
Operating at different flow rates but at a fixed speed of 2900 r/min. The flow rate was adjusted step by step using a throttling valve in the discharge line.
Operating at different net positive suction head available (NPSHA) but at fixed flow rates and speed. The inlet pressure was adjusted using a vacuum pump to conform to ISO 3555.
In the experiment, 20 operating points are measured, with each measurement lasting 60 s, and a sampling rate of 2 kHz is used. To obtain a reliable result, this test is repeated at least three times with a sufficient time interval between each test such that the water temperature for each test is the same.
The data acquisition has a sampling rate of 2 kHz with a built-in anti-aliasing filter and the sample time lasts 60 s. The sample of the signal is shown in Figure 5.

Stator current time-domain signal at the design point.
Induction motor current signature for centrifugal pump load
Theoretical analysis
The mathematical model of an alternating current (AC) induction motor is expressed in equation (1) 17

The first equation in equation (1) shows the torque balance relationship of AC motor dynamic condition, where Te indicates the electromagnetic torque; TL denotes the load torque; J corresponds to the moment of inertia of the motor; D refers to the resistance torque and damping coefficient, which is proportional to speed; K denotes the torsional torque coefficient; Pn indicates the motor pole; and θ refers to the mechanical torsional angle.
Pump-type load torque can be quasi-steady. 18 Therefore, D and K are approximately zero. The first equation in equation (1) can then be rewritten as follows
Thus, rotation speed changes based on balance equation when TL denotes the disturbance torque. The second equation in equation (1) is the voltage balance equation of a three-phase asynchronous motor, where U, I, R, and L refer to the motor stator voltage, current, resistance, and inductance, respectively.
In general, AC power plants have a large capacity. As such, motor stator voltage does not vary with load changes. Based on the balance equation, speed and stator current respond to adjust electromagnetic torque and load torque to form a new balance when load is disturbed. Electromagnetic torque is the result of stator current response.
The results of the analysis of asynchronous machine movement and voltage equations show that the torque of load variation likely affects motor speed, stator current, and electromagnetic torque. If the law between variation torque and stator current could be determined, then the stator current characteristics of disturbance torque could be analyzed.
A complex relationship is difficult to analyze. Furthermore, solutions to a model of a three-phase asynchronous motor for current, flux, and torque cannot be directly deduced from stator current and variation torque. Nevertheless, we can simplify and clarify these problems by using the synchronous rotating coordinate system based on rotor flux orientation transformation method.
Using the MT coordinate transformation method, 8 we can derive i sT, which produces the electromagnetic torque Te , and i sM, which produces the effective magnetic flux excitation current component from stator current. i sM is approximately constant

The relationship between electromagnetic torque, magnetic field, and current can be obtained and expressed in equation (4)
where P is the constant parameter associated with motor structure and λ s is the stator flux associated with input voltage, motor structure, and load. λ s is a constant stability load. Impact is negligible because disturbance torque producing currents is small. Therefore, i sT and electromagnetic torque are linearly related. Moreover, electromagnetic torque can be indirectly reflected in stator current.
Electromagnetic torque likely reflects the load. If load disturbance is regularly applied, then electromagnetic torque is in accordance with motion law. Assuming that perturbation frequencies are f 1, f 2, and f 3, the air gap torque induction electric machine includes constant torque T 0, and the wave torque frequencies are T 1, T 2, and T 3, we derive the following equation
where Φ1, Φ2, and Φ3 are the phases.
Stator current consists of the excitation current I sM and the electromagnetic torque current I sT and can be expressed as follows

A phase current can be expressed according to equation (4), as follows

By simplifying the previously presented equation, we derive the following equation

where I sM = I 0 cos Φ0, I sM = I 0 cos Φ0, and Φ0 = arctan I sT/I sM.
Based on these equations, our conclusion is that torque fluctuation frequency found in the current frequency spectrum is reflected as a sideband of fe .
Time-domain characteristics analysis
The stator current is a sinusoidal AC. Its size and direction are in accordance with the sine law of change over time, and its fundamental frequency has a cycle of approximately 0.02 s. Considering that the direction of the signal from the sizes follows the law of sine strictly, the power source frequency signal is strong and the torque disturbance signal induced by the related characteristics of the centrifugal pump is relatively weak.
The root mean square (RMS), also known as the quadratic mean, is a statistical measure of the magnitude of a varying quantity and is a common index for the current level

The trend of the current level versus operation point is shown in Figure 6, which shows that the law is similar to the flow shaft power characteristics. Thus, the stator current value can be used as a judgment basis for the pump operating point monitor. Moreover, the same law can also be found in the peak-to-peak index (Figure 6).

Stator current value versus operation point.
Frequency-domain characteristic analysis
The frequency spectrum can be obtained by fast Fourier transform (FFT) from the stator current signal, and the result of the design point is shown in Figure 7. As shown in Figure 7, the stator current spectrum is composed of a fundamental frequency current component, harmonics component, and noise.
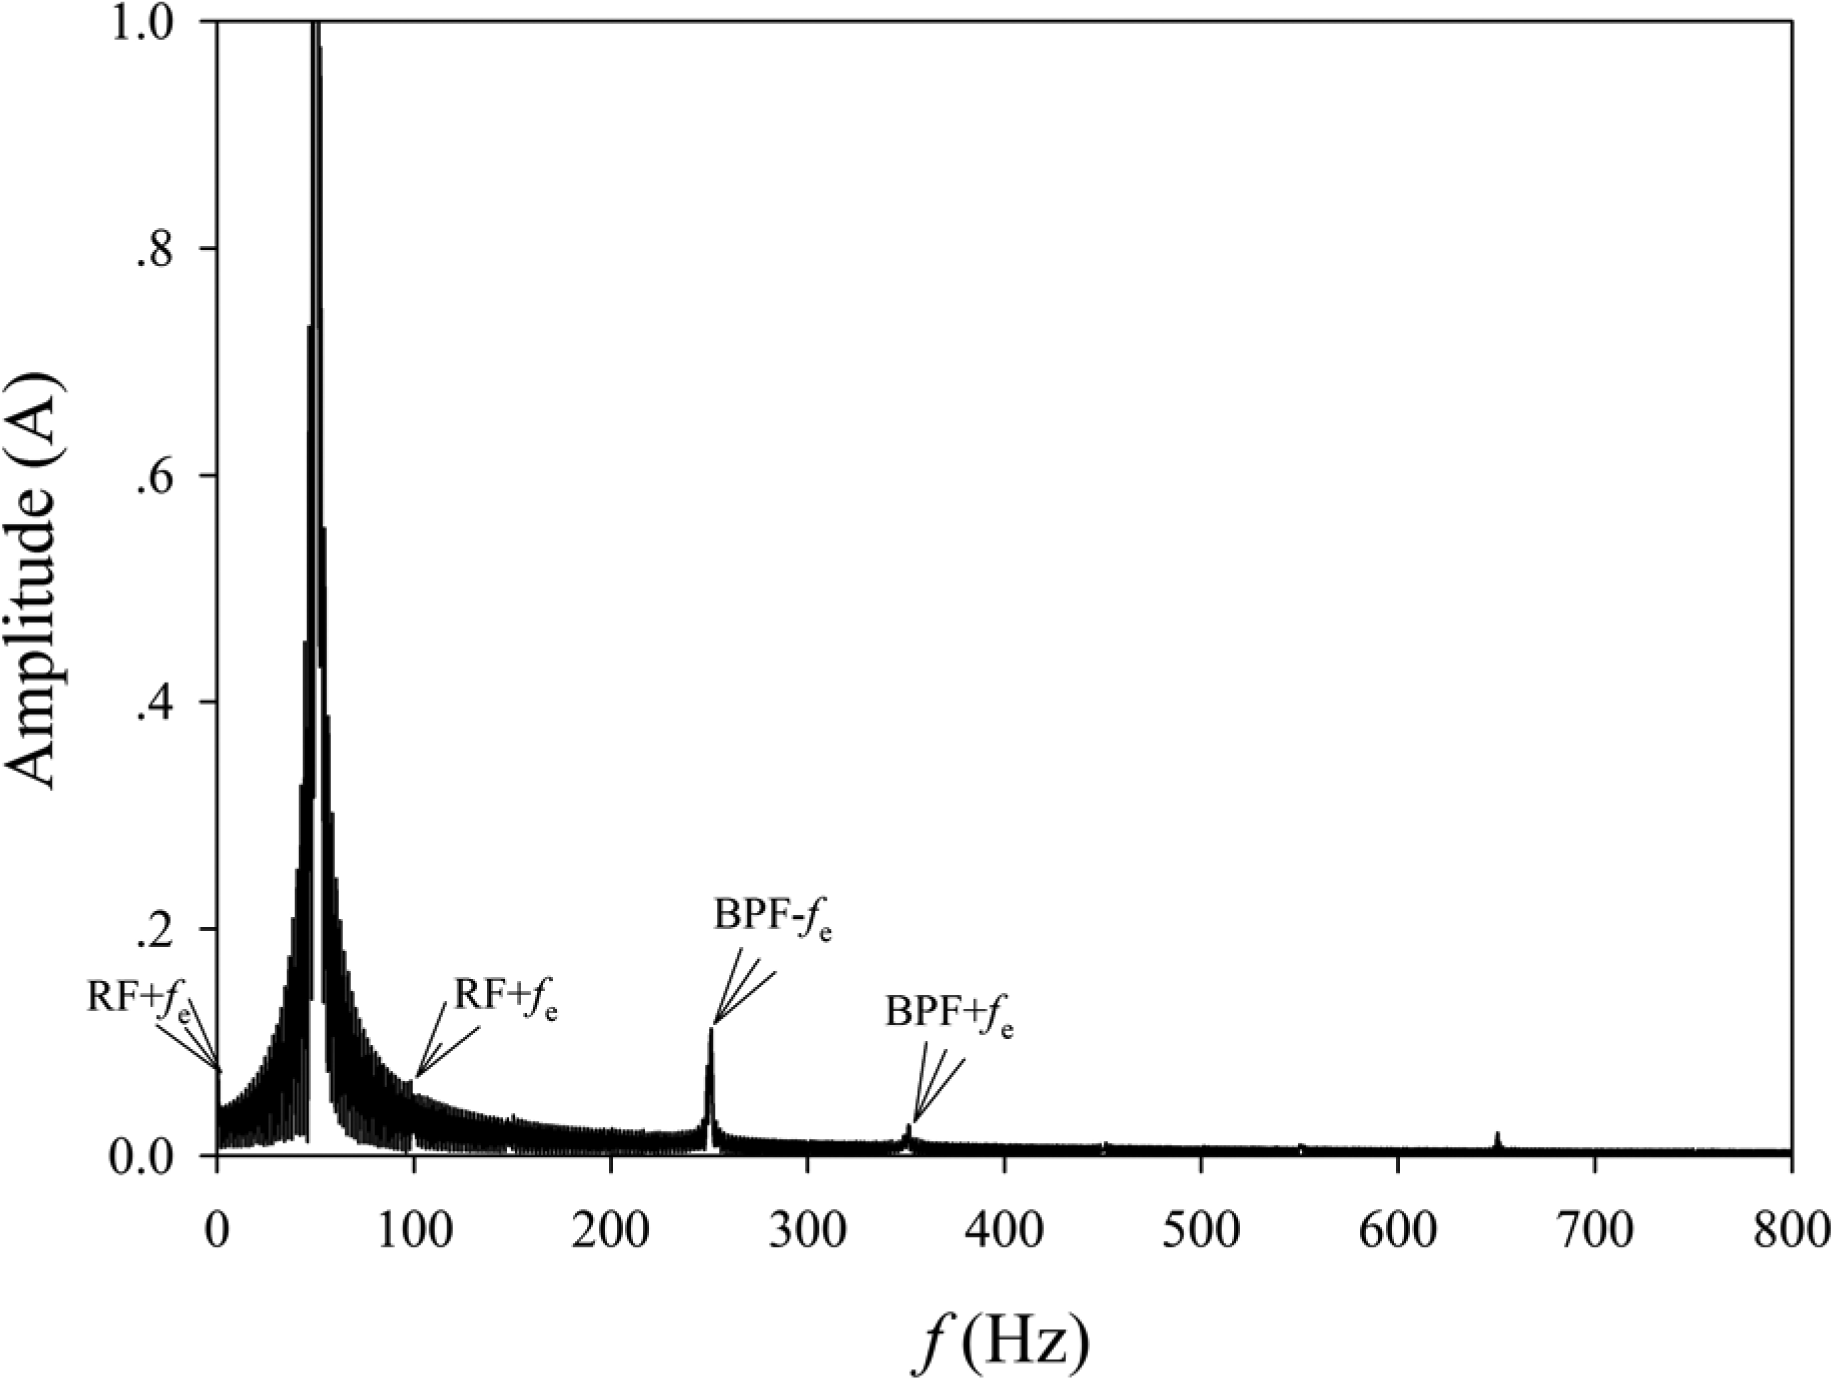
Frequency characteristic component in stator current.
The main energy of the stator current is concentrated on the fundamental frequency. As shown in Figure 8, the fundamental frequency component varies with the flow rate, the load is directly related to the value of the fundamental frequency component, and the change law is close to the flow shaft power characteristics.

Fundamental frequency component of the current at the operation point.
Considering that the pump has six blades, the blade pass frequency characteristics of the centrifugal pump are approximately 300 Hz in the current signal. The characteristic frequency is reflected in the current spectrum as the sidebands around the separated fundamental and is shown at approximately 250 and 350 Hz. The high-order harmonic frequency is also shown as the modulated fundamental; however, the amplitude is relatively small. The reason for this phenomenon is that the high-order harmonic frequency component effect may be small or the rotational inertia of the motor and pump inherently acts as a low-pass filter.
The rotation frequency and its harmonic frequency were also shown as sidebands around the fundamental, but their impact on the stator current frequency characteristic is far less than that of the blade pass frequency for normal operation point.
Analysis of the signature of the motor current at cavitation condition
Time-domain characteristic analysis
Figure 9 shows the current signal for the cavitation development process. All the stator currents are sinusoidal ACs, and their size and direction change over time according to the sine law. With the development of cavitation, all the current signals are nearly the same, except for the signal peak, wherein it is difficult to distinguish the development process of cavitation. As shown in Figure 10, the two curves show the dimensionless performance curve of the motor current and head with the change in net positive suction head drop.

Motor current performance under the cavitation condition: (a) NPSH = 9.8 m (no head drop), (b) NPSH = 3.9 m (2% head drop), and (c) NPSH = 2.7 m (3.1% head drop).

Motor current performance under the cavitation condition.
As cavitation sets in, the load on the pump impeller will decrease because the vapor content is more than the water content; furthermore, the current drawn by the motor will decrease. Moreover, another interesting phenomenon deserves attention. In the early stage of head drop (less than 1%), the RMS current dropped slightly along with some slight fluctuations. When the head drop reaches 1%, the RMS will decrease until a 2% head drop because the smooth layer produced by a few bubbles improves the pump performance. When the head drop reaches 2%, the RMS current will increase until the onset of cavitation (3% head drop). The reason for this phenomenon may be the jammed channel impeller caused by bubbles, which causes additional energy consumption. When the cavitation is fully formed and its levels are increased, the content of vapor will rapidly increase and the load on the pump impeller will be reduced, thus causing the rapid current to decrease.
Frequency-domain characteristics analysis
The wave amplitude is different in different operation conditions. By continuously averaging the power over an adequate period, a running average can be tabulated to realistically characterize the entire data sample. Thus, a variety of acquisition data conditions are normalized dimensionless before spectrum transform.
Figure 11 shows the current signal frequency spectrum for the cavitation development process. The frequency domain exhibits some different characteristics during the development. Cavitation develops progressively with the increase in head drop. This could evidently result in the fact that the unstable flow regime becomes more severe. Four different cavitation statuses have shown that the current signal turns stronger along with the increase in head drop. This may be caused by unsteady flow state which requires more energy consumption. As shown in Figure 11, the noise level, noise distribution, rotation speed, and van pass frequency component on the correspondent power spectral densities (PSDs) may provide indicators in the cavitation incipient.
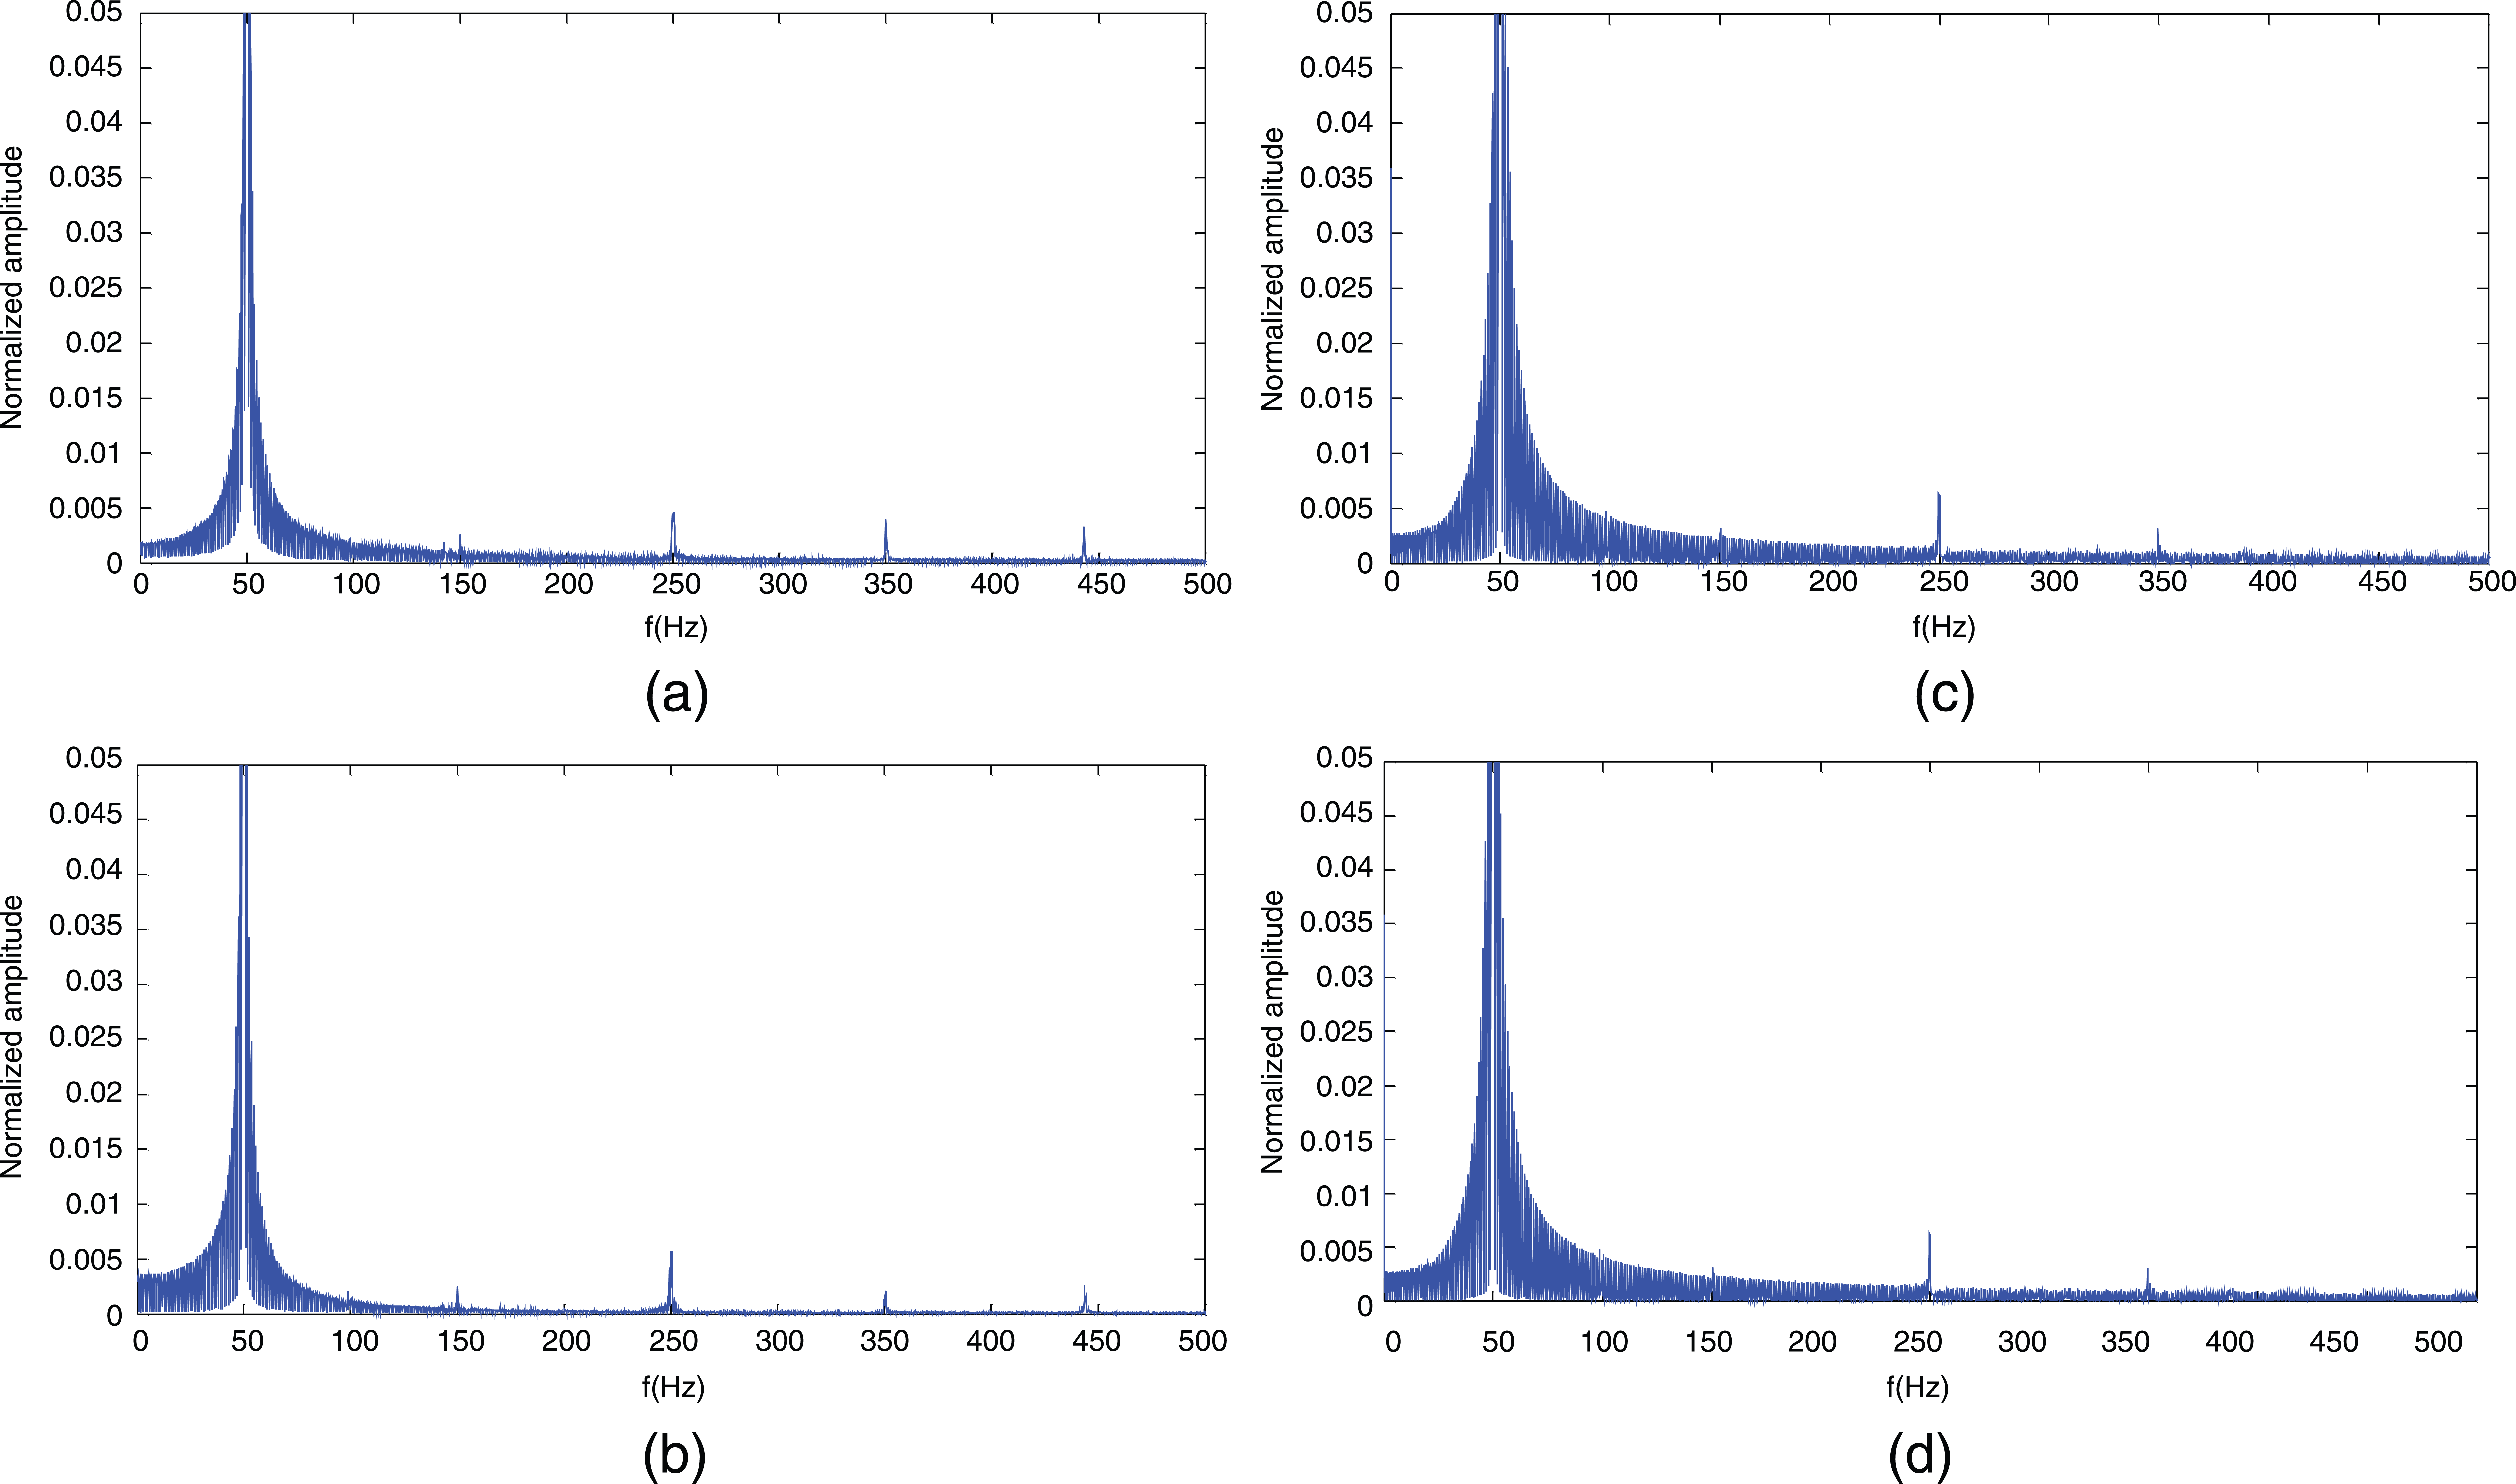
Frequency domain of the motor current at the cavitation progress: (a) NPSH = 9.8 m (no head drop), (b) NPSH = 3.9 m (2% head drop), (c) NPSH = 3.04 m (3% head drop), and (d) NPSH = 2.7 m (3.1% head drop).
As shown in Figure 11, it only could conclude that frequency domain of the motor current would be different at the different cavitation progress, however, through analysis of the quantization method may get much more explicit information. As the current amplitude would be changed during the cavitation progress, all the current waveforms were first normalized in order to eliminate the influence of different amplitudes
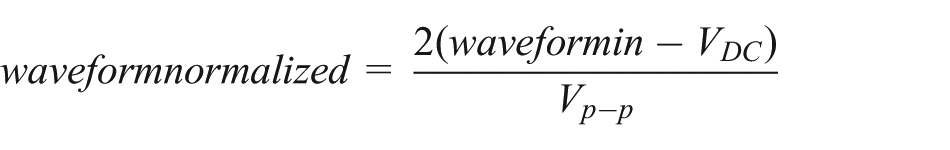
where waveform normalized is the normalized waveform, waveform in is the original waveform data, VDC is the direct current (DC) component of the waveform, and Vp-p is the peak-to-peak value of the waveform.
Then the spectrum of normalized data was transformed, and every frequency component was picked up from spectrum. The main energy of the stator current is concentrated on the fundamental frequency F s. As shown in Figure 12, the F s remains more or less flat when the head drop is less than 1%. This result indicates that the energy performance remains stable, and that the operation characteristic of the pump shows almost no change in this area.

Fundamental frequency component of current at cavitation operation.
For the 1%−2% head drop area, the flow regimes may reach the stable regime 17 and the cavities beginning at the impeller eye develop progressively as they travel with the flow. Thereafter, the layer may be smoothened by a few bubbles, thus improving pump performance and increasing the energy needed for effective work.
For the 2%−3% head drop area, the pump may operate in an unstable regime, wherein strong recirculation occurs within the pump and adjacent inlet pipe work, thus causing the pump inlet pressure in the unstable regime to show periodic pulses. Moreover, in this regime, the hydraulic instability may be very severe, as much more energy is used to overcome this regime. For this reason, the F s effective representative energy part would decrease rapidly until cavitation is formed.
Pulsating in shaft frequency F r in centrifugal pump was caused by the static and dynamic asymmetries in impeller channels and the pump shaft or bearing clearance.18–21 As a result, the F r component is relatively much smaller than others for normal operation. However, the F r component will rapid increase from the onset of cavitation until it is fully formed (Figure 13).

Rotation frequency component of current at cavitation operation.
The wake flow is an important source of the “blade passing frequency F v” and its harmonics in the pump 18 because the characteristic frequency is reflected in the current spectrum as sidebands around the separated fundamental. As shown in Figure 14, the left sideband F v− component was much larger than the right sideband F v+ when the pump operates under normal point. This may be caused by rotational inertia of the motor and the pump inherently acts as a low-pass filter. In the process of cavitation development, the F v component presents significant fluctuations.
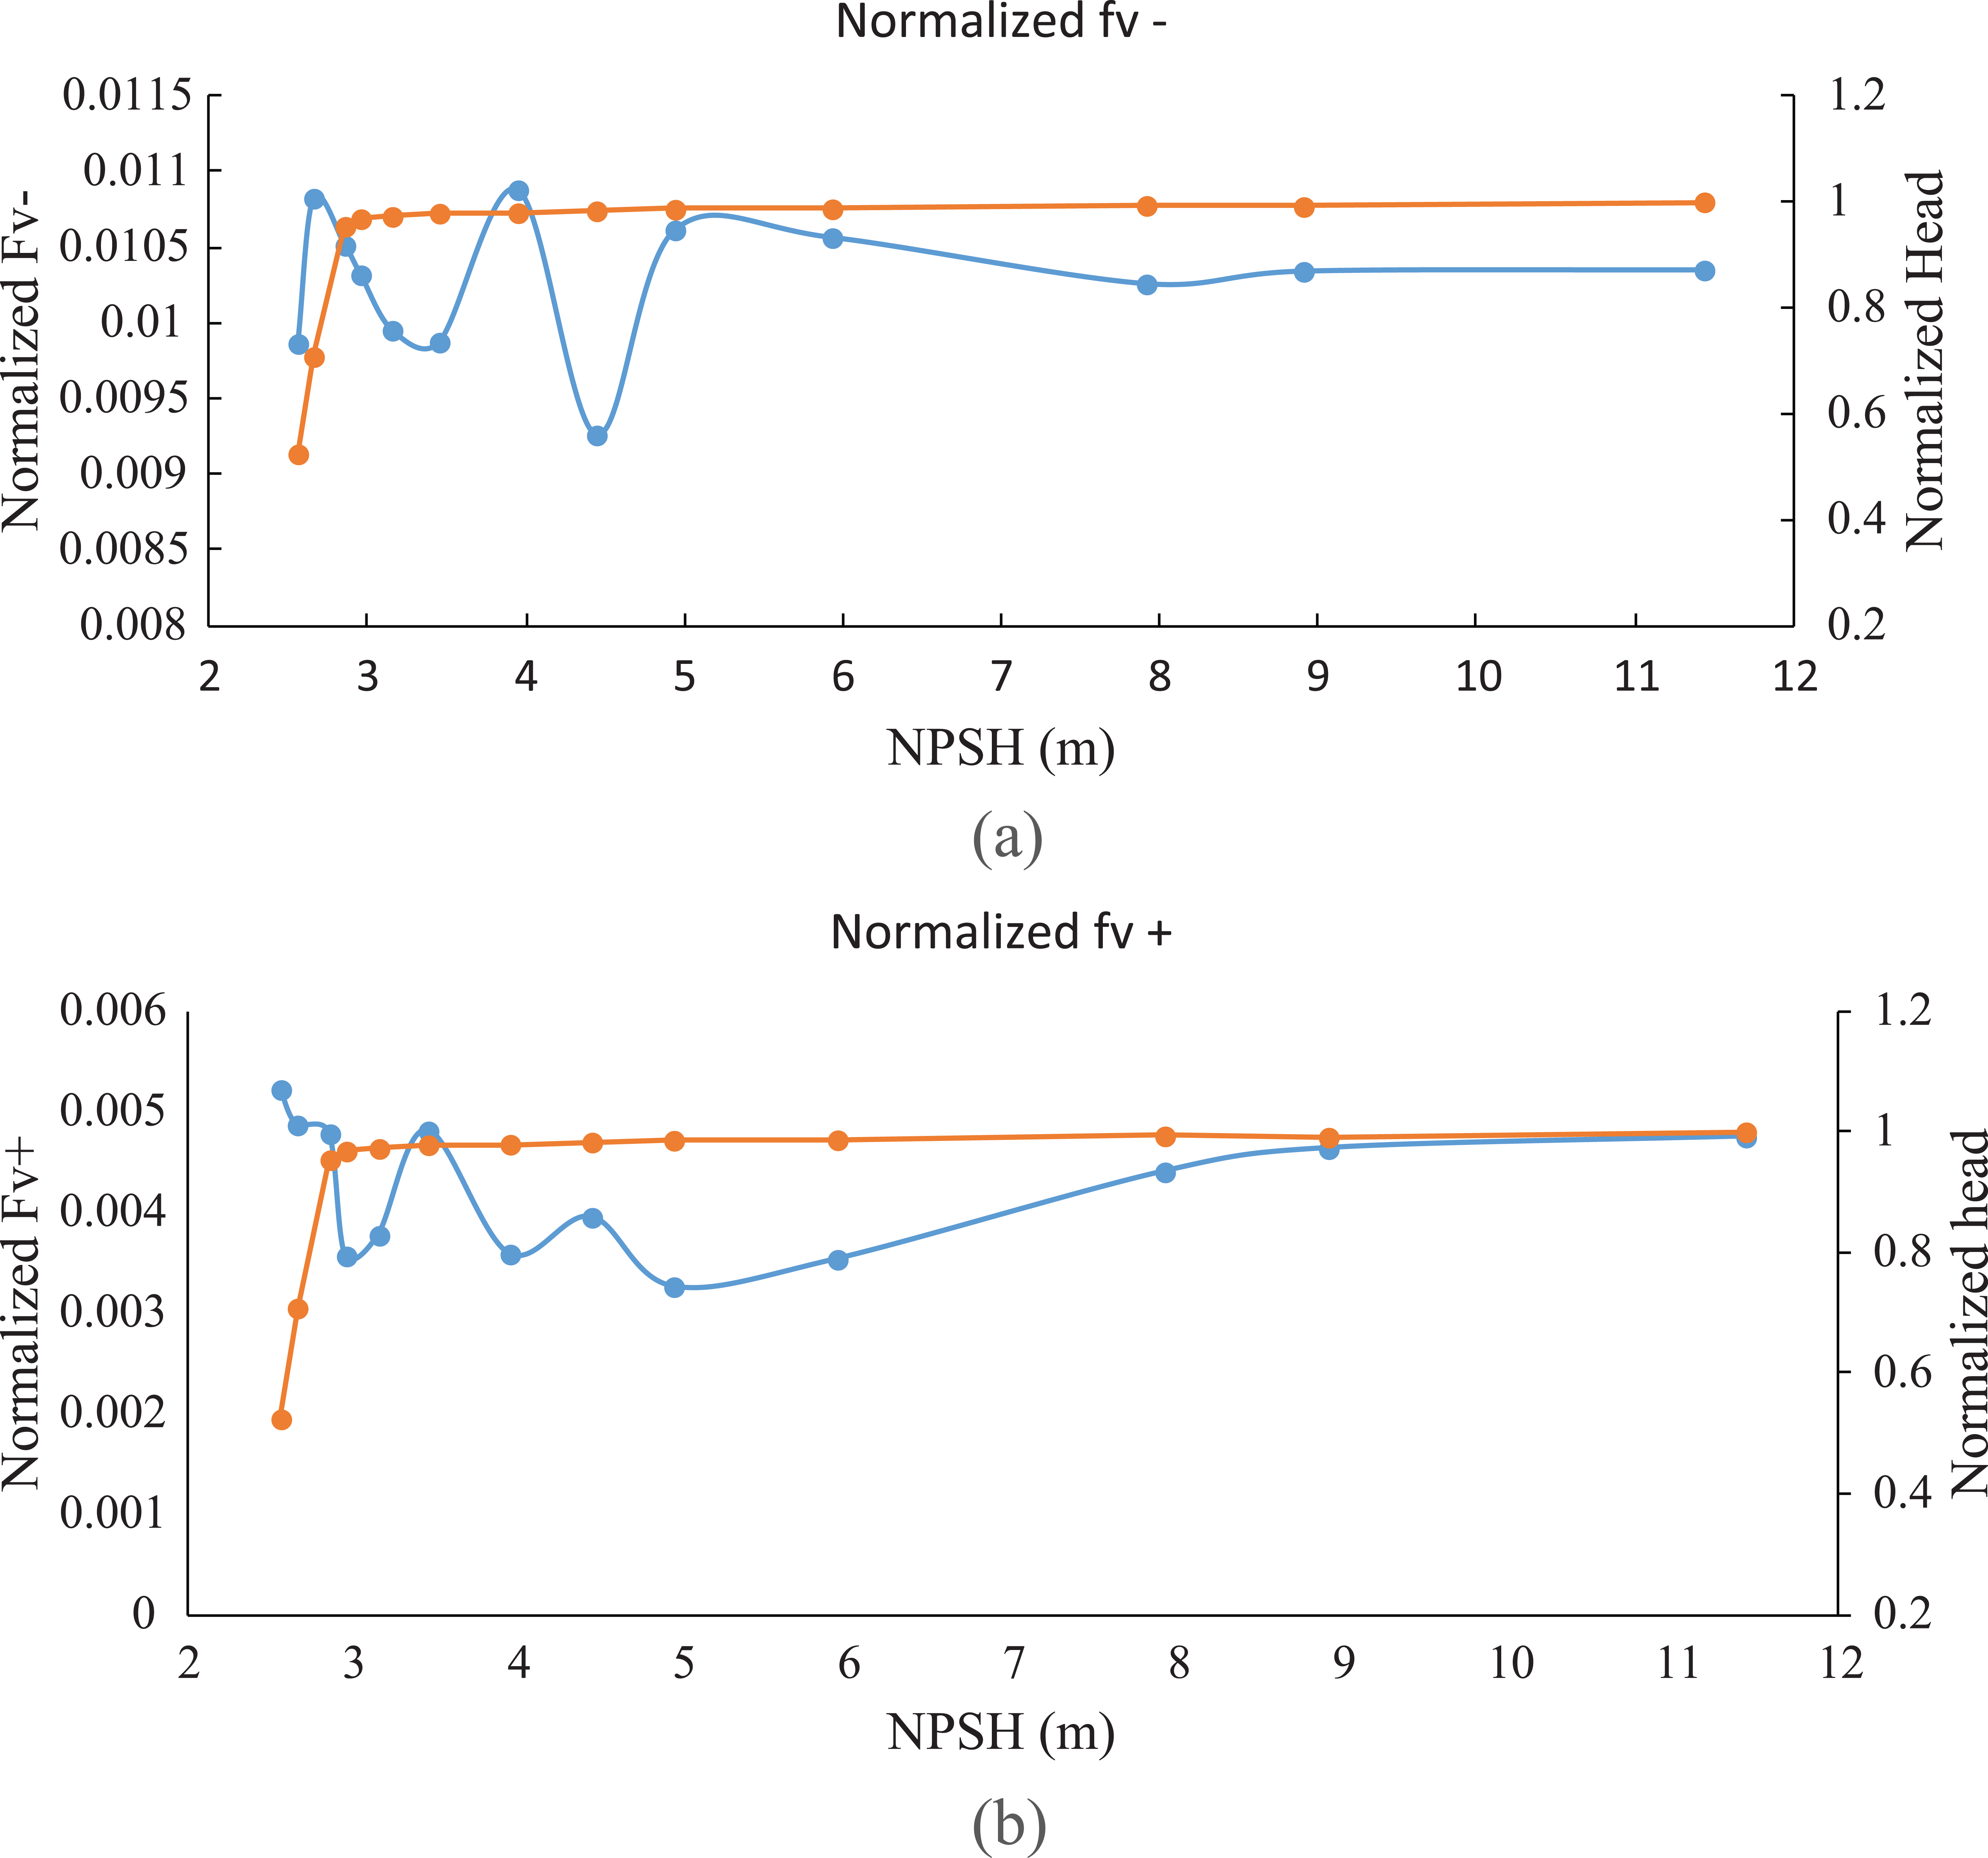
Blade passing frequency component of the current at cavitation operation: (a) left sideband and (b) right sideband.
The broadband noise content is a result of hydrodynamic and mechanical sources. 19 Hydrodynamic sources strongly depend on the flow conditions. Meanwhile, the contributions of mechanical sources include noise from the rotation of the pump shaft and bearings. The broadband content is a result of flow turbulence, viscous forces, boundary layer vortex shedding, and boundary layer interaction between high-velocity and low-velocity regions of the process fluid, and by vortices generated in the clearances between the rotor of the centrifugal pump and the adjacent stationary part of the casing.
With operation at inception cavitation and subsequent recirculation at the impeller inlet, strong vortices are created in the shear layer between the main flow and the recirculating fluid, which would increase broadband below rotation frequency (100 Hz). As shown in Figure 15, the low-frequency noise below rotation frequency increases until the 2.1% head drop, but dropped rapidly until the formation of cavitation. During the full development of cavitation, the low-frequency noise component presents significant fluctuations. The low-frequency noise distribution between 0–50 Hz and 50–100 Hz will be changed when cavitation is fully developed. Moreover, other frequency-band broadband noise levels almost follow the same law as low-frequency noise.

Noise distribution of current at cavitation operation.
The noise component in the current signal can also be seen in Figure 16, which shows that the noise component remains more or less flat when the head drop is less than 1%. This result may also indicate that the flow regime remains stable and the operation characteristic of the pump has almost no changes in this area. The noise component would be increased between 1% and 1.5% head drop. Moreover, in this area, the flow turbulence might enhance or some unstable flow state might appear.

Noise component of current at cavitation operation.
The noise component decreases rapidly between the 1% and 2% head drop, and the layer may be smoothened by a few bubbles, thus improving pump performance. Thereafter, the noise component will increase rapidly, and the component may even be estimated to be approximately 40% of the total energy of the current.
Conclusion
From exploring the characteristics of motor current for centrifugal pump at cavitation conditions, the following conclusions can be drawn:
The stator current is still a sinusoidal AC strictly to the law of sine, with the cycle of the supply power fundamental frequency and the signal waveform form almost unchanged during the whole process cavitation. The RMS of the current will fluctuate due to the different flow regimes in the cavitation progress and will decrease because the vapor density is smaller than the water density when cavitation is fully formed.
The stator current spectrum is composed of fundamental frequency component, harmonics component, and noise. The noise level, noise distribution, rotation speed, and van pass frequency components would show some features in cavitation progress, and these indicator indexes will be changed according to the stage of cavitation development.
The MCSA is a feasible and cost-effective method for the stage of cavitation condition.
Footnotes
Academic Editor: Jiin-Yuh Jang
Declaration of conflicting interests
The author(s) declared no potential conflicts of interest with respect to the research, authorship, and/or publication of this article.
Funding
The author(s) disclosed receipt of the following financial support for the research, authorship, and/or publication of this article. This project was supported by the key project of the National Natural Science Foundation of China (No. 51239005), National Natural Science Foundation (No. 51409125), the China Postdoctoral Science Foundation (No. 2014M551515), Priority Academic Program Development of Jiangsu Higher Education Institutions, Jiangsu University fund assistance (No. 13JDG082), Jiangsu postdoctoral research grants program (No. 1302026B), and University Natural Science Foundation of Jiangsu Province (No. 14KJB470002).