
Abstract
The saturated flow boiling heat transfer coefficients and frictional pressure drops characteristics of R1234ze(E), R600a, and L-41b (R1234ze(E)/R32 (27/73 mass %)) inside an 8 mm inner diameter horizontal tube were investigated. The experiment was carried out at the saturation temperature of 20°C with heat flux ranging from 5.0 to 10.0 kW·m−2 and mass flux ranging from 200 to 400 kg·m−2·s−1. The influence of mass flux, heat flux, and quality on the heat transfer coefficients and frictional pressure drops were examined and discussed. The results show that the local heat transfer coefficients of R1234ze(E) are averagely 33% and 18% lower than those of R600a and L-41b, respectively. The frictional pressure drops of R1234ze(E) are 21% lower than those of R600a but 6% greater than those of L-41b. Meanwhile, the experimental data of local heat transfer coefficients and frictional pressure drops are compared with some well-known correlations available in literatures.
Introduction
As refrigerants, hydrofluorocarbons (HFCs) are widely used in refrigeration and heat pump system. Although HFCs are non-ozone depleting, they do have large global warming potential (GWP) value, which could lead to global warming.1,2 The refrigerant with GWP value more than 150 has been banned in the new vehicle air-conditioning by the United Nations (UN) F-gas regulation 3 since 1 January 2011, and most recently, the new F-gas regulation 4 announced to prohibit the domestic refrigerators and freezers containing HFCs with GWP value larger than 150 from 1 January 2015. From an environmental point of view, it is urgent to find some low GWP alternatives for HFC refrigerants in vapor compression refrigeration systems.
The promising alternatives are hydrofluoroolefines (HFOs), for example, R1234yf and R1234ze(E), which have attracted great attention because the GWP value was found to be less than 1 in recent study. 5 R1234yf has already been considered to be the most excellent alternative of R134a in vehicle air-conditioning and R1234ze(E) was supposed to be the most promising alternative in heat pump system.6,7 In order to cover more wide range of air-conditioner, heat pump, and refrigeration systems, zeotropic mixture of R1234ze(E) and R32 will be more effectively used due to much better thermodynamic characteristics and mild impact on environment. The zeotropic mixture of R1234ze(E) and R32 with mass fraction of 27/73 is suggested to be a substitute of R410A in the recent study by The Air-Conditioning, Heating, and Refrigeration Institute (AHRI) and was named L-41b. 8 Most of the studies available in literatures on R1234ze(E) and the mixture of R1234ze(E) and R32 focused on thermodynamic properties (Akasaka R; 9 Tanaka K et al.; 10 Akasaka R; 11 Brown JS et al. 12 ) and drop-in replacements in existing refrigeration system (Francisco M et al.; 13 Adrian MB et al. 14 ). However, flow boiling heat transfer characteristics of R1234ze(E) and the mixture of R1234ze(E) and R32 are rarely reported. Hossain et al. 15 investigated the flow boiling heat transfer characteristics of R1234ze(E) and the mixture of R1234ze(E)/R32 with mass fraction of 55/45 in horizontal tube with inner diameter of 4.35 mm and compared with those of R410A and R32 at the same operating conditions. The conclusions indicate that the local heat transfer coefficients of R1234ze(E)/R32 (mass ratio: 55/45) are slight lower than those of pure R1234ze(E) due to the inferior liquid thermal conductivity and the effect of mass transfer resistance of the mixture. Grauso et al. 16 investigated the flow boiling characteristics of R1234ze(E) for saturation temperatures varying from −2.9°C to 12.1°C over wide ranges of mass flux and heat flux and obtained the similar results by comparing with those of R134a at the same operating conditions. However, no data of the local heat transfer coefficients and frictional pressure drops of R1234ze(E) and the mixture L-41b are available during flow boiling at inner diameter larger than 8 mm at saturation temperatures of 20°C.
In this work, we experimentally investigated the local heat transfer coefficients and frictional pressure drops during saturation flow boiling of R1234ze(E) and the mixture L-41b in horizontal tube with an inner diameter of 8 mm. The results obtained for the pure R1234ze(E) and the mixture L-41b were compared with the experimental data obtained for R600a at the same operating conditions. The experimental results were obtained at the saturation temperature of 20°C, heat flux ranging from 5.0 to 10.0 kW m−2, and mass flux ranging from 200 to 400 kg m−2 s−1. Moreover, the experimental heat transfer coefficients and frictional pressure drops are compared with the predicted results obtained by using some prediction models from the literatures.
Experiment
Figure 1 shows the schematic of experimental apparatus in this study. The magnetic gear pump drives the refrigerant coming from the liquid reservoir. The refrigerant flow rate can be adjusted by the electric motor speed by an inverter or bypass valve installed between inlet and outlet of the gear pump. The refrigerant in the main loop passes through sub-cooler to offset the enthalpy increasing in pump and to ensure the refrigerant is in sub-cooled condition when it passes through the mass flow meter. A Coriolis mass flow meter is installed between the sub-cooler and the preheater. After Coriolis mass flow meter, the refrigerant flows through preheater where heat is supplied to the refrigerant. The inlet vapor quality of the test section can be adjusted by the voltage supplied to the preheater. Before the test, the preheater is calibrated. After that, the refrigerant passes through the test section and condenser, sequentially. Note that the condenser is installed in a thermostatic bath which consists of a refrigeration system, a heating system, and a stirrer. The temperature of thermostatic bath can be adjusted in the range between −20°C and 30°C. After condenser, liquid refrigerant goes back to the liquid reservoir. The observer sections are installed at the inlet and outlet of the test section, allowing to see the two-phase flows.

Schematic diagram of the experimental system.
Figure 2 illustrates the detail of the test section. The test tube is made of copper with an inner diameter of 8 mm and a length of 2400 mm. The wall temperature at five points along the axial of the test section is measured by the thermocouples embedded in the top, bottom, right, and left of the exterior test tube wall. Two pressure transducers are used to measure the inlet and outlet pressures of the test section. The pressure drop between the inlet and the outlet of the test section is measured by a differential pressure transducer. The electric heating tape is wrapped around the outer wall of the tube, and heat flux in the test section is varied by adjusting the input power of the electric heating tape. In order to reduce the heat loss, the test section is insulated by using glass wool, insulation cotton, and trapping tape, as shown in Figure 2. The total heat loss from the test section is estimated to be less than 3.0%. The test conditions for the experiment are listed in Table 1.

Schematic diagram of the test section.
Test conditions for the experiment.

Data reduction, data acquisition, and uncertainty analysis
Data reduction
The local saturation flow boiling heat transfer coefficient is defined as followed


where q is the inner wall heat flux of the tube, Q test is the total heat amount in the test section which can be obtained by measuring the total heat input and the heat losses, Δz is the total length of the test section, and T sat is the saturation temperature of the fluid. The saturation temperature is determined by measuring the pressure at the inlet of the test section and the pressure drop, which is assumed to linearly distribute along the test section. For the mixture, T sat is assumed to be the average thermodynamic equilibrium temperature. T wi is the average temperature of the inner wall and can be calculated by equation (3)

where T wo is the temperature of outer wall and d out and d in indicate the diameter of outer tube and inner tube, respectively. In equation (3), the average temperature of outer wall is taken with thermocouples embedded in the top, bottom, right, and left. The two-phase flow pressure drop inside tube consists of three parts, that is, the static pressure drop, the momentum pressure drop, and the frictional pressure drop, which is given by equation (4)

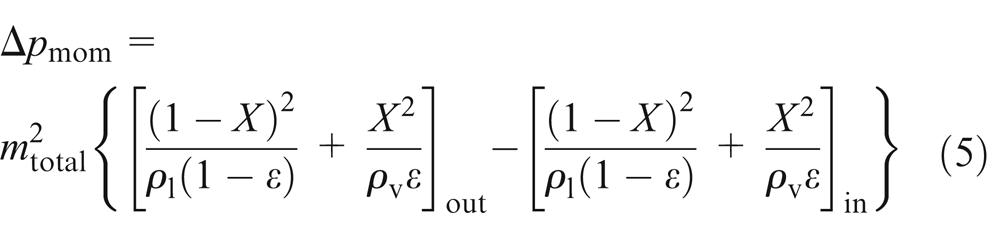
The static head identically equals 0 for a horizontal tube. The momentum pressure drop is given by equation (5)
In this work, the void fraction ε is obtained by using the Steiner version of the Rouhani and Axelsson 17 drift flux model, which is given in equation (6)

The vapor quality at the inlet of the test section can be calculated from the energy balance in the test section and the preheater as follows


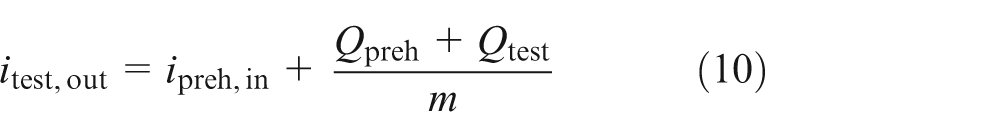
where i indicates the specific enthalpy; the subscript “in” and “out” indicate the inlet and outlet of the test section, respectively; and the subscript “v” and “l” indicate the vapor and liquid, respectively. Q preh is the electrical heat power applied to the preheater, and Q test is the electrical heat power applied to the test section. Here, all the thermodynamic parameters of pure substances are determined with the aid of REFPROP 9.0. 18 The thermodynamic parameters of L-41b are obtained by using non-ideal mixing rule proposed by Kedzierski et al. 19 Table 2 summarizes the thermodynamic parameters of the test fluids. The average vapor quality is defined by equation (11)

Thermodynamic parameters of test fluids.

GWP: global warming potential.
Data acquisition and uncertainty analysis
All the test parameters are recorded by a data acquisition system and transmitted to a computer when the system reaches the steady-state conditions. The temperatures and pressures of the test section are continuously monitored. The criterion for the steady-state conditions is that the variations of the wall and refrigerant saturation temperatures are less than ±0.1 K within 10 min. The flow meters, pressure transducers, thermocouples, differential pressure gauge, and associated instrumentation are all calibrated before using. The refrigerant mass flux is measured by a Coriolis mass flow meter with an uncertainty of ±1% Range Span (RS). The power of the preheater is measured by a wattmeter with an uncertainty of ±0.4%. The pressure is measured by an absolute pressure transducer with an uncertainty of ±0.05% Full Scale (FS). The saturation fluid temperature is measured by the PT100 Ω resistance thermometer with an uncertainty of ±0.1°C. The temperature of the outer wall is measured by T-type thermocouples with an uncertainty of ±0.1°C. The temperatures of thermocouples on the upper surface of the tube are slightly higher than those on the bottom. But, the maximum temperature deviation between top and bottom is within 1°C for the same point along the axis of the test section in high vapor quality. Table 3 summarizes the measuring ranges and uncertainties of the measurement instruments. Based on the analysis of error propagation reported by Moffat, 20 the experimental heat transfer coefficients obtained in this work present a mean uncertainty of 7.9% with a minimum value and a maximum value of 2.3% and 12.4%, respectively. For frictional pressure drops, the mean uncertainty value is 3.78% with a minimum value of 1.86% and a maximum value of 10.9%. The mean uncertainty of vapor quality is 2.2% with a minimum value of 1.13% and a maximum value of 7.4% at the lowest mass flux.
Measurement instruments and their uncertainties.

FS: full scale; RS: range span.
Experimental results and discussion
Heat transfer coefficients and correlation prediction
Experimental heat transfer coefficients
Figure 3 shows the local heat transfer coefficients of R1234ze(E), R600, and L-41b as a function of vapor quality obtained at saturation temperature of 20.0°C ± 0.5°C with two heat fluxes (5.0 and 10.0 kW m−2) and several mass fluxes ranging from 200 to 400 kg·m−2 s−1. The local heat transfer coefficients of these three fluids are found to be quite similar at each studied operating condition. By comparing Figure 3(a)–(c), the heat transfer coefficient of R1234ze(E) is around 33% less than that of R600a and 18% less than that of L-41b. From literatures, it is well accepted that heat transfer coefficient of zeotropic binary mixture is less than the two pure substances because of the concentration gradients. However, in this investigation, the local heat transfer coefficient of the mixture L-41b is greater than that of pure R1234ze(E). This can be explained by the fact that the main composition of L-41b is R32 with great heat transfer performance as suggested by many researchers. Since the heat transfer degradation of zeotropic mixture L-41b is relatively weak, the heat transfer performance of L-41b is greater than that of R1234ze(E), which is completely different from that of R1234ze(E)/R32 (ratio: 55/45) obtained by Hossain et al. 15 It can be explained by the fact that heat transfer degradation of R1234ze(E)/R32 (ratio: 55/45) is stronger than that of L-41b due to the difference of temperature glide at saturation temperature of 20°C (ΔT R1234ze(E)/R32 (ratio: 55/45) = 8.9°C, ΔT L-41b = 3.1°C).

Comparison of local heat transfer coefficients at constant saturation temperature for several mass fluxes and heat fluxes: (a) heat transfer coefficients of R1234ze(E) versus vapor quality, (b) heat transfer coefficients of R600a versus vapor quality, and (c) heat transfer coefficients of L-41b versus vapor quality.
The local heat transfer coefficient of R1234ze(E) first gradually increases with vapor quality and then falls at high vapor quality. The local heat transfer coefficients of R600a and L-41b show the similar trends at each investigated operating condition. The effect of the mass flux and heat flux on the local heat transfer coefficients at the constant saturation temperature is shown in Figure 3. The increase in the mass flux leads to a significant enhancement of heat transfer coefficients for each fluid. This behavior suggests that the ratio of vapor and liquid densities of the three fluids is very low. Particularly, the ρ v/ρl ratio at 20°C is only about 0.0192, 0.0142, and 0.0347 for R1234ze(E), R600a, and L-41b, respectively. This causes a strong increase in the mean fluid velocity during evaporation and a consequent enhancement of the convective boiling contribution. The increase in the heat flux leads to a slight increase in the local heat transfer coefficients in the whole range of vapor quality. The heat flux has a stronger effect on the heat transfer coefficients in low vapor quality range than that in high vapor quality due to the dominant nucleate boiling in low vapor quality. When the heat flux increases from 5 to 10.0 kW m−2, the heat transfer coefficient of R1234ze(E) at mass flux of 400 kg m−2 s−1 increases by 25.6% and 36.8% at vapor quality of 0.2 and 0.7, respectively. Similar local heat transfer coefficients are obtained for R600a and L-41b.
Correlation of heat transfer coefficients
Until now, various predictive methods or correlations have been developed to predict the flow boiling heat transfer coefficients of fluids. The well-known correlation models include superposition, asymptotic, and enhancement. In this article, five empirical correlations (Kandlikar; 21 Kew and Cornwell; 22 Gungor and Winterton; 23 Wattelet; 24 Shah 25 ) are used to predict the local heat transfer coefficients of pure R1234ze(E) and R600a, and four empirical correlations (Bivens and Yokozeki; 26 Choi et al.; 27 Liu and Winterton; 28 Sami et al. 29 ) are used to predict the local heat transfer coefficients of the mixture L-41b.
Figure 4(a)–(c) shows the comparison of predicted results with the experimental data of R1234ze(E), R600a, and L-41b, respectively. For the pure R1234ze(E) and R600a, acceptable prediction results are obtained by the correlations of Kew–Comwell and Shah as shown in Figure 4(a) and (b). For R1234ze(E), the best agreement is achieved by Kew–Comwell method in which 85% of experimental points are in an error bandwidth of ±30% of the prediction. And for the Shah method, 75% of experimental data are in agreement with the prediction within an error bandwidth of ±30%. For R600a, the best agreement is achieved by Shah method in which 90% of experimental points are in an error bandwidth of ±30%. A detailed comparison of experimental heat transfer coefficients of R1234ze(E) and R600a with five predicted results is listed in Table 4. Note that the total absolute average deviation obtained with Kew–Comwell method and Shah method are 24.78% and 30.65% for R1234ze(E), 26.02% and 21.75% for R600a, respectively. However, the methods of Kandlikar, Gungor–Winterton, and Wattelet underestimate the experimental data of R1234ze(E) and R600a. For the mixture of L-41b, the correlation of Choi achieves the best agreement with experimental data as shown in Figure 4(c), in which approximately 90% of experimental points are in an error bandwidth of ±30% of the prediction. The total absolute average deviation and root mean square deviation of the results predicted for L-41b are listed in Table 5. Note that the total absolute average deviation obtained with Choi method and Sami method is 21.87% and 24.20%, respectively, which is acceptable for engineering application.
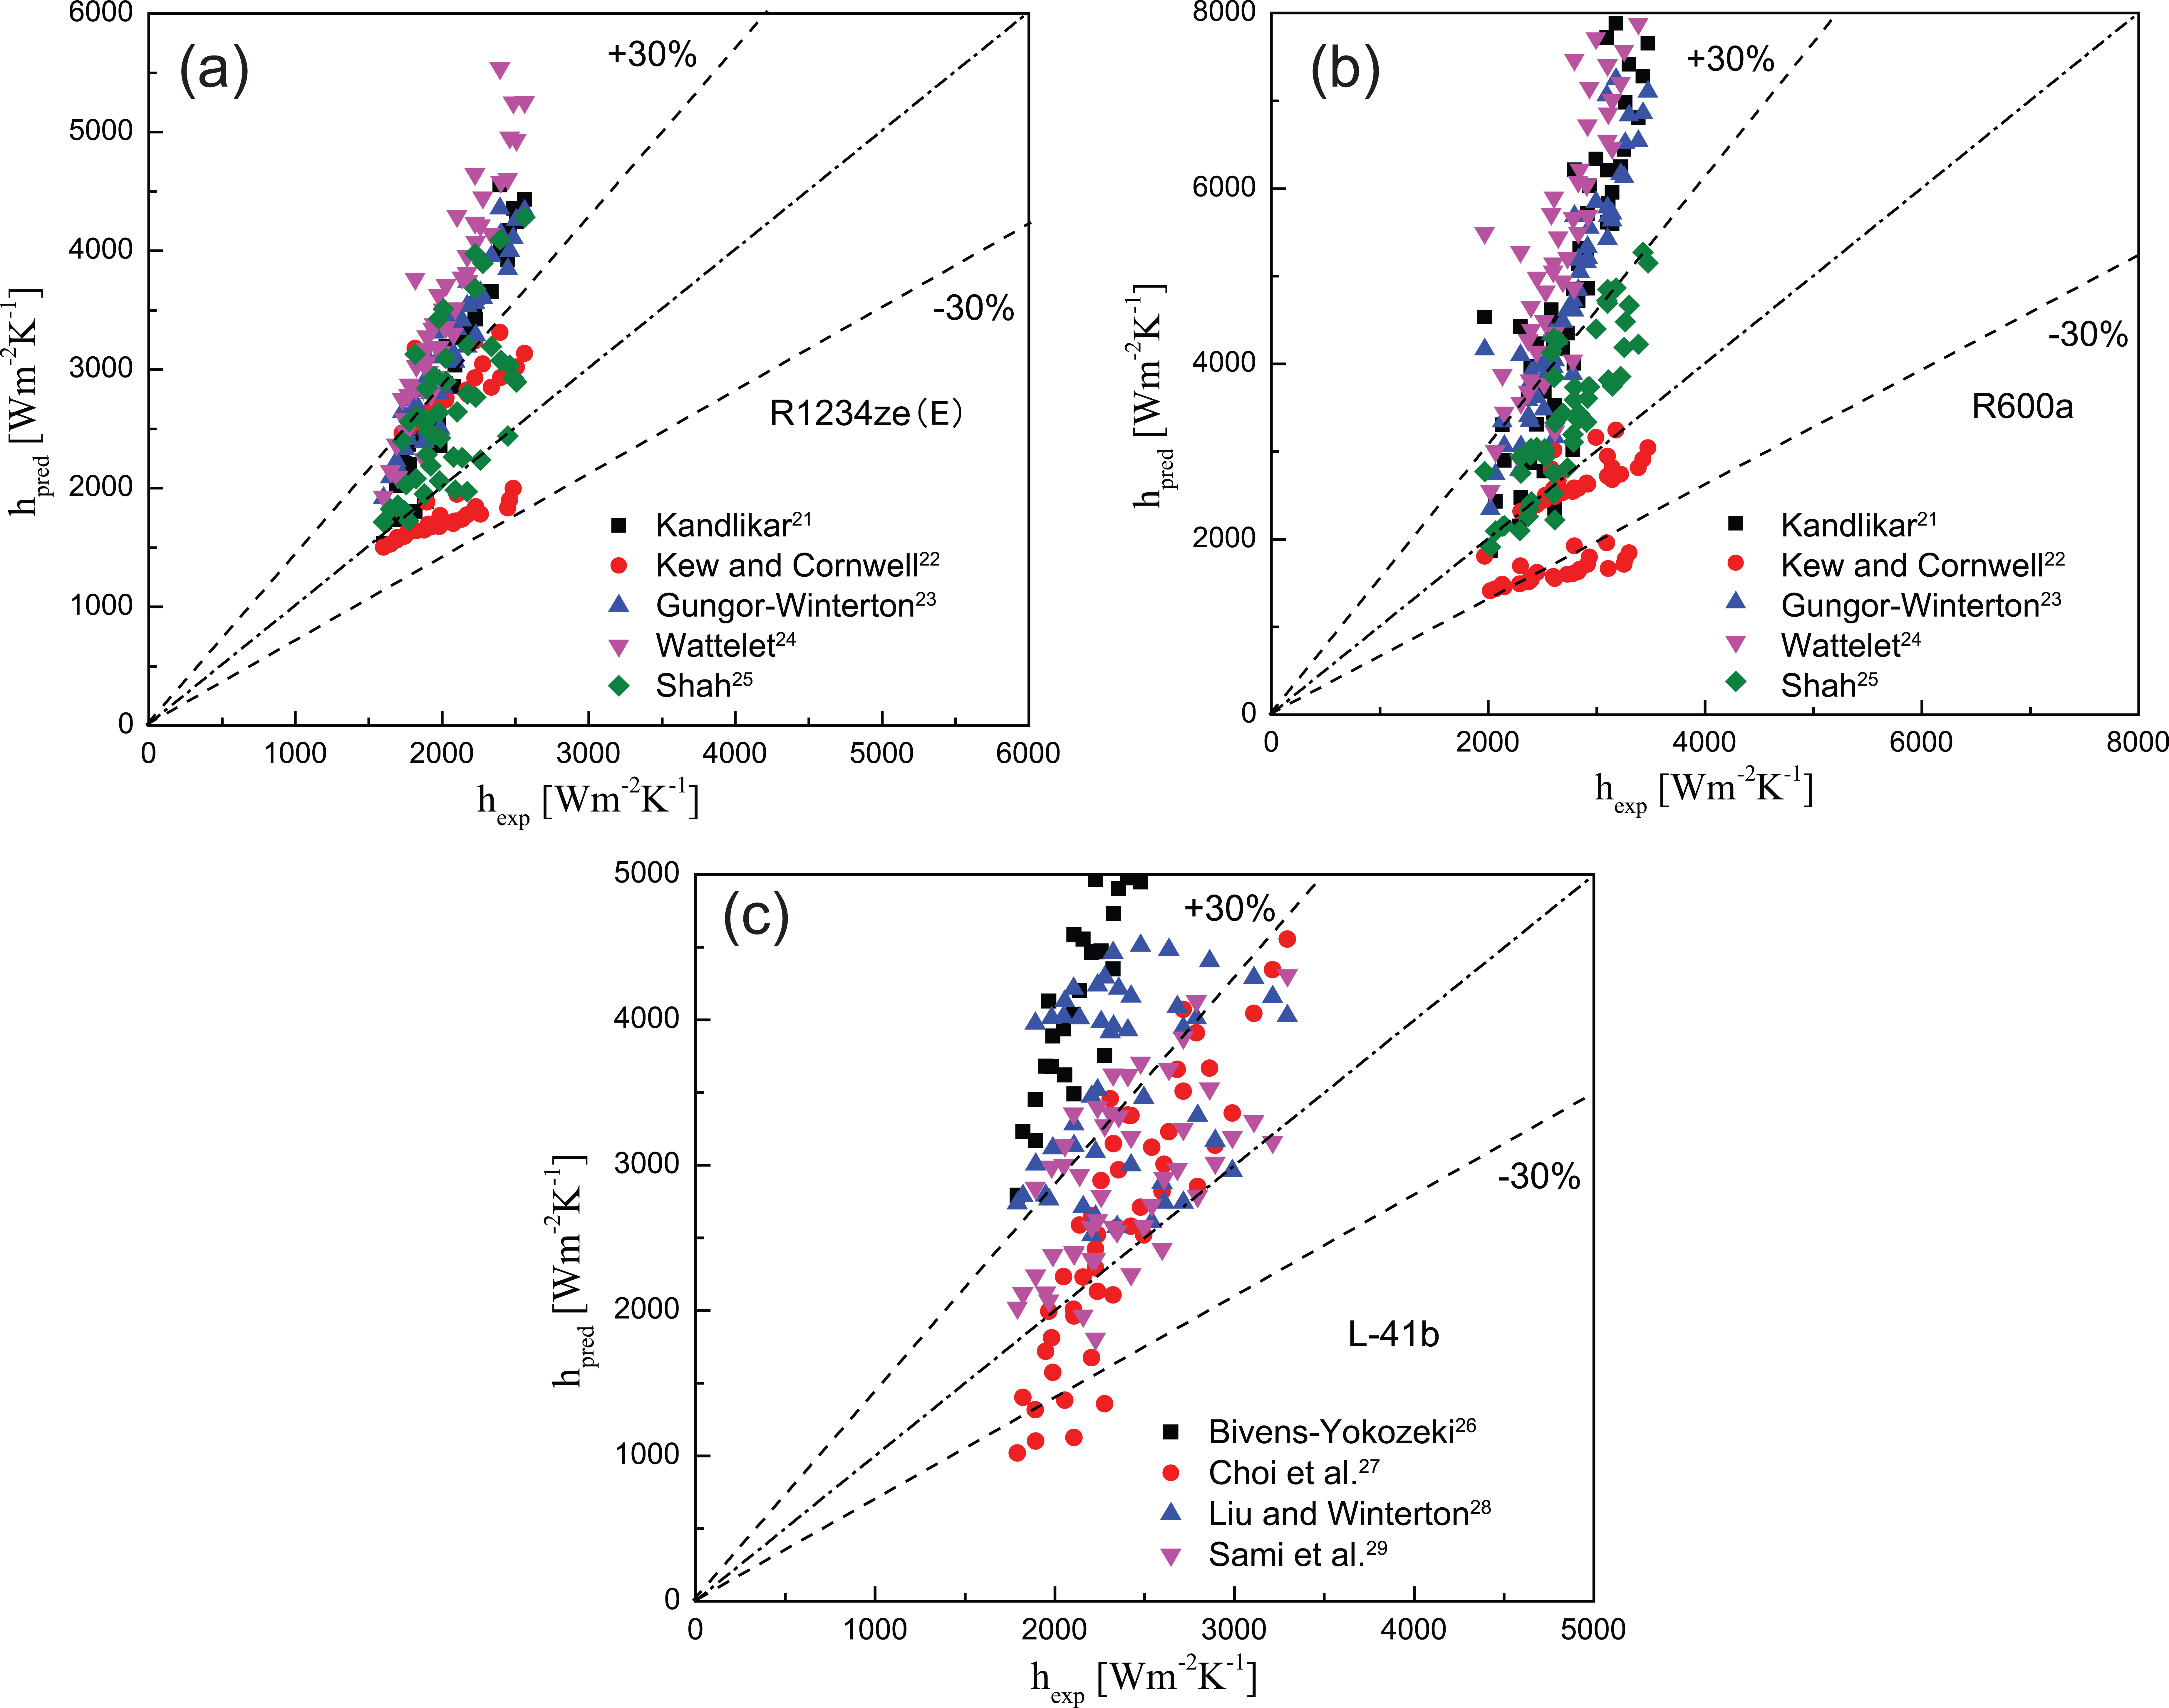
Experimental data compared with several well-known correlations: (a) R1234ze(E), (b) R600a, and (c) L-41b.
Deviations in predictions of heat transfer coefficients for R1234ze(E) and R600a.
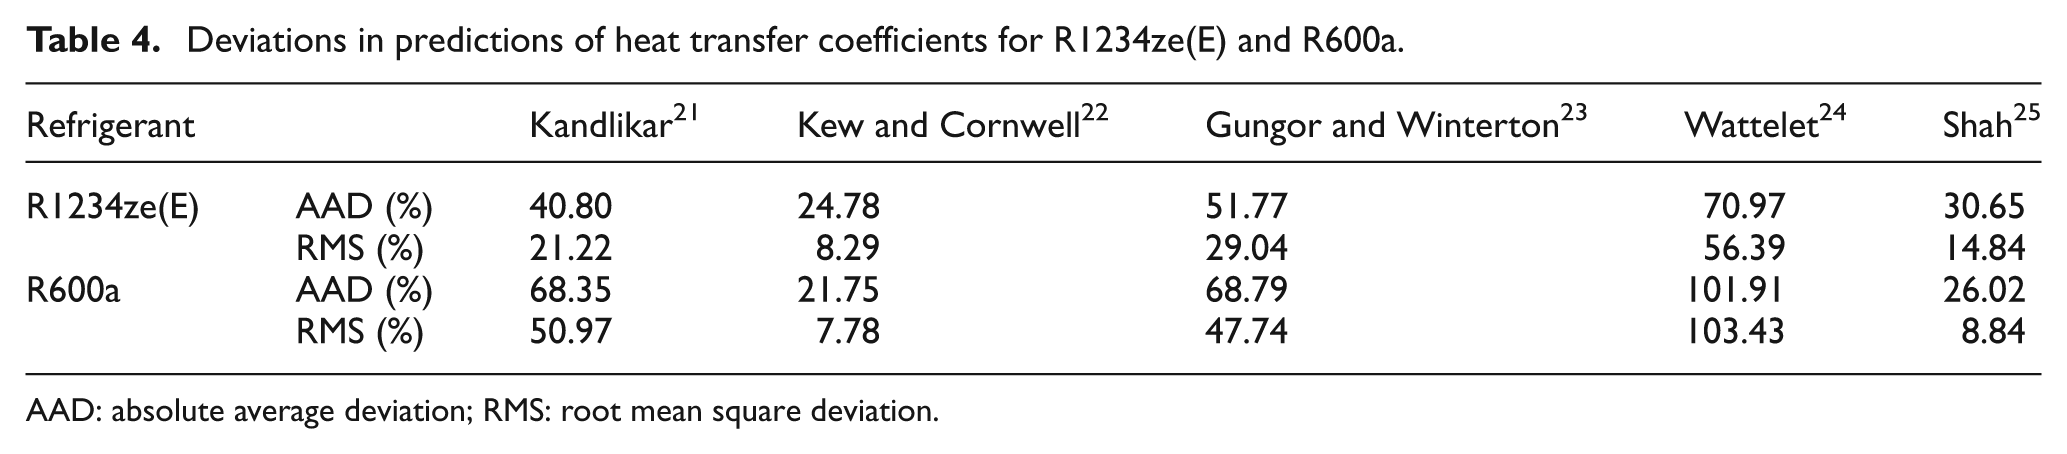
AAD: absolute average deviation; RMS: root mean square deviation.
Deviations in predictions of heat transfer coefficients for mixture L-41b.

AAD: absolute average deviation; RMS: root mean square deviation.
Frictional pressure drops and correlation prediction
Experimental frictional pressure drops
Figure 5 shows the experimental frictional pressure drops of R1234ze(E), R600a, and L-41b at saturation temperature of 20°C for different mass fluxes and heat fluxes. Generally, the experimental data show that the frictional pressure drop of R1234ze(E) is slightly lower than that of R600a and slightly greater than that of L-41b with the difference −21% and +6% for R600a and L-41b, respectively. The main reason is that μ l/μ v ratio is 17.60 for R1234ze(E), 32.45 for R600a, and 11.60 for L-41b at saturation temperature of 20°C.

Comparison of frictional pressure drops at saturation temperature of 20°C and heat flux of 5.0, 10.0 kW m−2 for several mass fluxes: (a) R1234ze(E), (b) R600a, and (c) L-41b.
From Figure 5, it can be seen that the frictional pressure drops initially increase with vapor quality and then reach a peak at high vapor quality, and finally fall. After the frictional pressure drops reach a peak, it is conjectured that the flow pattern of fluids transits from annular flow to dryout flow around the peak reducing interface of liquid phase and tube wall, and ultimately leads to smaller frictional pressure drop. The frictional pressure drop increases strongly with increasing mass flux for each fluid. By comparing Figure 5(a)–(c), it is noted that the strongest variation of the frictional pressure drop with mass flux is obtained for R600a due to the highest ρl /ρ v ratio (ρl /ρ vR1234ze(E) = 52.09, ρl /ρ vR600a = 70.37, ρl /ρ vL-41b = 28.79), and consequently leads to largest dependence on mass flux. The increment of the average frictional pressure drop for R1234ze(E) is around 27.6% less than that of R600a but 8.7% larger than that of L-41b, when the mass flux increases from 200 to 400 kg m−2 s−1. However, the heat flux has no significant influence on the frictional pressure drop in the whole range of vapor quality. Similar phenomenon was observed by Haberschill et al. 30 with R22 and R407C.
Correlation of frictional pressure drops
Several empirical approaches for developing frictional pressure drop prediction methods for two-phase flow have been proposed. The correlations (Friedel; 31 Groennerud; 32 Lockhart–Martinelli; 33 Mueller-Steinhagen and Heck 34 ) are the most widely used as they require less knowledge of flow characteristics. The Friedel correlation is recommended to predict the frictional pressure drop for μ l/μ v < 1000 and mass fluxes less than 2000 kg m−2 s−1 in horizontal and upward flow. The Groennerud correlation is developed for refrigerants and can be used to predict the frictional pressure drop over the entire range of vapor quality. The Lockhart–Martinelli correlation is developed based on the two-phase frictional multipliers and can be used widely. The Mueller-Steinhagen and Heck correlation is developed for a variety of fluids and can be used in large range of channel diameters over entire range of vapor quality in horizontal flow. In this section, the experimental frictional pressure drops will be compared with four empirical approaches described above.
Figure 6 depicts the comparison of the experimental data and the prediction data of the frictional pressure drop of R1234ze(E) obtained at the mass flux of 200 and 400 kg m−2 s−1. It can be seen that the Friedel method has the best prediction at the mass flux of 200 kg m−2 s−1, while the Groennerud method provides a better prediction at the mass flux of 400 kg m−2 s−1. In general, the Groennerud method gives the best prediction with an absolute average deviation of 28.37%.

R1234ze(E) experimental frictional pressure drops data compared with several well-known empirical correlations: (a) G = 200 kg m−2 s−1 and (b) G = 400 kg m−2 s−1.
Figure 7 shows the frictional pressure drop experimental data of R600a obtained at the mass flux of 200 and 400 kg m−2 s−1 comparing to the prediction data. It can be seen that the Groennerud method predicts well for R600a at both mass fluxes, it also predicts the maximum value correctly, and the deviation of maximum value is 14.5%. According to the flow pattern map presented by Wojtan et al., 35 the maximum is supposed to occur in annular flow at vapor quality around 0.7, which is correctly predicted by the Groennerud method. The data predicted by the other three methods are slightly far away from experimental data, in particular, the deviation is larger at high vapor quality for the Friedel method and Mueller-Steinhagen et al.’s method.

R600a experimental frictional pressure drops data compared with several well-known empirical correlations: (a) G = 200 kg m−2 s−1 and (b) G = 400 kg m−2 s−1.
Figure 8 shows the frictional pressure drop experimental data of mixture L-41b at the same mass flux of R1234ze(E) and R600a comparing to the prediction data. As shown in Figure 8(a), no method can predict well at low mass flux, especially in the high vapor quality. When the mass flux increases to 400 kg m−2 s−1, the Groennerud method, the Friedel method, and the Mueller-Steinhagen et al.’s method can give a good prediction, and the Groennerud method can also predict the peak and the trend.

L-41b experimental frictional pressure drops data compared with several well-known empirical correlations: (a) G = 200 kg m−2 s−1 and (b) G = 400 kg m−2 s−1.
In general, it is found that the prediction of Groennerud correlation shows the best agreement with the experimental data at mass flux of 400 kg m−2 s−1 for all three fluids. However, at low mass flux of 200 kg m−2 s−1, no method can provide precise prediction for all three fluids. Table 6 summarizes the absolute average deviation and root mean square deviation between the prediction with each method and the experimental data.
Deviations in predictions of friction pressure drops for R1234ze(E), R600a, and mixture L-41b.

AAD: absolute average deviation; RMS: root mean square deviation.
Conclusion
Saturation flow boiling heat transfer coefficients and adiabatic frictional pressure drops of R1234ze(E), R600a, and L-41b have been experimentally evaluated in a horizontal smooth tube with an inner diameter of 8 mm. The influences of mass flux, heat flux, and quality on the heat transfer coefficients and the frictional pressure drops have been examined and discussed. Moreover, the experimental data are compared with several well-known correlations available in literatures for both local heat transfer coefficients and adiabatic frictional pressure gradients. The following conclusions have been obtained:
In the investigated operating conditions, the local heat transfer coefficients show the same trend with vapor quality for each fluid. The local heat transfer coefficient strongly increases with the mass flux and slightly increases with the heat flux. The heat transfer coefficient of R1234ze(E) is 33% less than that of R600a and 18% less than that of L-41b. The mass flux has a strong effect on the frictional pressure drops, but the heat flux does not show any significant influence on the frictional pressure drops. The frictional pressure drop of R1234ze(E) is slightly lower than that of R600a but slightly greater than that of L-41b with the difference of −21% and +6% for R600a and L-41b, respectively. Therefore, the mixture L-41b is suggested to be the promising refrigerant due to the best performances on heat transfer and pressure drop.
Comparing the experimental data and the prediction data of the local heat transfer coefficient, the best predictions are made by Kew–Comwell correlation and Shah correlation for R1234ze(E) and R600a, respectively. The total absolute average deviation obtained with Kew–Comwell method and Shah method is 24.78% and 30.65% for R1234ze(E) and 26.02% and 21.75% for R600a, respectively. For the mixture of L-41b, the correlation of Choi achieves the best agreement with approximately 90% of the experimental data in the error bandwidth of ±30%, and the total absolute average deviation obtained with Choi method is 21.87%. Comparing the frictional pressure drop experimental data with the predictive results, it was found that the Groennerud correlation is the acceptable method for predicting the experimental data and predicting the maximum value and the trend, which could be used for engineering application.
Footnotes
Appendix 1
Academic Editor: Sergio Nardini
Declaration of conflicting interests
The author(s) declared no potential conflicts of interest with respect to the research, authorship, and/or publication of this article.
Funding
This study was supported by National Natural Science Foundation of China (51176124), International Science and Technology Cooperation Projects (2012DFR70430), and the Innovation Fund Project for Graduate Student of Shanghai (JWCXSL401)