
Abstract
Subject to temperature disturbance, exchangers in heat exchanger network will interact. It is necessary to evaluate the degree of temperature fluctuation in the network. There is inherently linear relationship between output and inlet temperatures of heat exchanger network. Based on this, the concept of temperature-change sensitivity coefficient was put forward. Quantitative influence of temperature fluctuation in the network was carried out in order to examine transmission character of temperature fluctuation in the system. And the information was obtained for improving the design quality of heat exchanger network. Favorable results were obtained by the introduced method compared with the experimental results. These results will assist engineers to distinguish primary and secondary influencing factors, which can be used in observing and controlling influencing factors accurately.
Introduction
Heat exchanger network (HEN) synthesis is a means of utilizing the heat available in a process. 1 As an integrated process design method, the pinch technology proposed by Linnhoff and Townsend 2 has formed the backbone of other methods. Umeda 3 has divided the process synthesis into five stages: development, planning, basic design, detailed design, and improvement. The complex problem is how to ensure each stage synthesis is optimum. In order to overcome the above difficulties, predecessors have put forward lots of synthesis methods. Challand et al. 4 presented some computer programs based on dual temperature approach method. And these programs help in establishing energy conservation targets. In this method, heat recovery approach temperature (HRAT) is at the pinch point. At the same time, exchanger minimum approach temperature (EMAT) is introduced as a decision variable, and heat transfer through pinch point is allowed. The pseudo-pinch design method (PPDM) was introduced by Wood et al., 5 which was based on the principle of thermodynamics. This method increased freedom of streams matching comparing with pinch method. Suaysompol and Wood 6 presented the flexible pinch design method (FPDM), which used a heuristic procedure. In this method, fixed energy designs could be achieved with relatively simple networks. Based on the above method, a computer-aided design package for HENs was introduced. 7 Huang et al. 8 proposed a mixed-integer nonlinear programming (MINLP) formulation and a solution strategy to incorporate non-isothermal mixing in HEN, which used the stagewise superstructure and proposed logical constraints to obtain superior HEN.
Other than the aforementioned sequential synthesis approaches, simultaneous synthesis methods also can be used for HEN synthesis. A general-purpose algorithm was presented early in 1989 by Yuan et al. 9 This method was based on superstructure model and arrived at the solution by MINLP. This algorithm was also applied to the multistage reactor optimization, but it was limited in no shunt and no split streams. López-Maldonado et al. 10 presented a mathematical programming formulation for the synthesis of HEN, which took into account total cost as well as environmental impact. Bjork and Westerlund 11 introduced a new global method for the synthesis of HEN. This new method was achieved by modifying the MINLP model, which solved the problem of excluding the optimal solution due to the isothermal mixing hypothesis. And some auxiliary approaches regarding the retrofit of existing HENs, which were in strict relation with the problem of synthesis, were proposed.12–14
However, none of the models described above can truly reflect the effects of temperature fluctuations on HEN operation. The inlet or outlet temperatures of process streams are fixed seldom over the entire lifetime. The heat recovery system should be subordinated to the processing plant to keep constant temperatures. 15 The inlet temperatures and the mass rates of streams in HEN deviate frequently from the anticipated setting values because of turndown requirements, seasonal variations, change in feedstock, and so on. If the temperature deviations from the settling values exceed a specified limit, the stability of the system will suffer and that may even result in system shutdown. In order to keep the anticipated output values in a given scope, it is necessary to evaluate the degree of disturbance result from input deviation.
This problem can be solved by two ways. One is arrived at through analyzing a given network to determine whether it is optimal. And the other is to get an initial optimum system. However, as we all know, the latter is more difficult to achieve compared with the former way.
Based on the inherently linear relationship between the outlet and inlet temperatures of HEN, this work introduces a concept of temperature-change sensitivity coefficient. Quantitative influence of temperature fluctuation in the network is carried out in order to examine transmission character of temperature fluctuation in the system.
Response of temperature deviation in HEN
In a network, exchangers will interact with each other subject to temperature disturbance. As a result of the seasonal variation or other factor influence, the inlet temperatures of streams often fluctuate and their downstream heat exchangers’ characteristics would be varied correspondingly. This kind of influence can be transmitted in the system. This phenomenon can be demonstrated easily by Figure 1, which was partly selected from an ammonia synthesis plant. Given the hot stream HOT1 is prone to fouling, and that initially such fouling is concentrated in exchanger E1, which is hotter than exchanger E4. The result is that fouling reduces heat transfer coefficient, raises the outlet temperature, and this eventually leads to more fouling in exchanger E4. The result could not have been predicted, if only single heat exchanger was taken into analysis. Only based on the overall system, the effects can be determined. So, it is worthy to study the behavior of HEN suffering from fluctuation.

Section of a heat exchanger network.
The concept of downstream paths proposed by Kotjabasakis and Linnhoff 16 can be used for analysis qualitatively of the influence resulting from temperature fluctuation. Peter Fryer 17 considered the influence of temperature fluctuation in the network synthesis optimization. The ultimate aim is to provide techniques, which enable the analysis results to be included in network design. And this will also aid the designer to take into account forbidding matches between streams and selecting optimal temperature difference, and so on. The analysis result is also very important for a given network optimized operation. And it is of benefit to initial synthesis of a new system. That will help in determining operation parameters, adjusting reasonably distribution of transfer area, and maintaining the HEN at its best operating status. The network analysis solves this kind of question basically.18–21
Quantitative analysis of influence
In order to carry out this kind of quantitative analysis, the concept of temperature-change sensitivity coefficient was put forward in this article. The method was presented to check the effect degree resulting from temperature disturbance. And based on this concept, the sensitivity table can be generated, showing the numerical relationship between inlet and outlet temperature deviation. This kind of sensitivity table can be used for the rapid screening of sensitivities.
In Figure 2, an example network is shown with downstream paths. A continuum connection between any two points in the diagram is a path. For example, there are two paths between point t2 on stream HOT2 and point t9 on stream HOT1 and between point t3 on stream HOT3 and point t9. But part of path2 is against the flow of stream COLD1, so it is not “downstream.” However, path1 is completely the same as the stream flow direction, so it is downstream. According to the concept of downstream paths, the disturbance of point t3 cannot be propagated to point t9. However, the disturbance of point t2 can be propagated to point t9. Based on this analysis, the disturbances at points t1, t2, t4, t5, and t6 can be propagated to point t9. It can be shown as follows


Downstream paths.
There will be

where
Solution strategies
Figure 3 shows a single heat exchanger. The heat balance equations and the design equation can be transformed into


A single heat exchanger.
where
Fryer, 22 Kotjabasakis and Linnhoff, 23 and Kern 24 have proposed equation (3) in different forms.
Equation (3) shows that the temperatures are linear. So, the outlet temperatures can be expressed as the function of the inlet temperatures, which can be shown as follows

where
Assuming that UA and all CP remain constants, there are two known temperatures, thus the other unknown temperatures can be calculated by using equation (4).
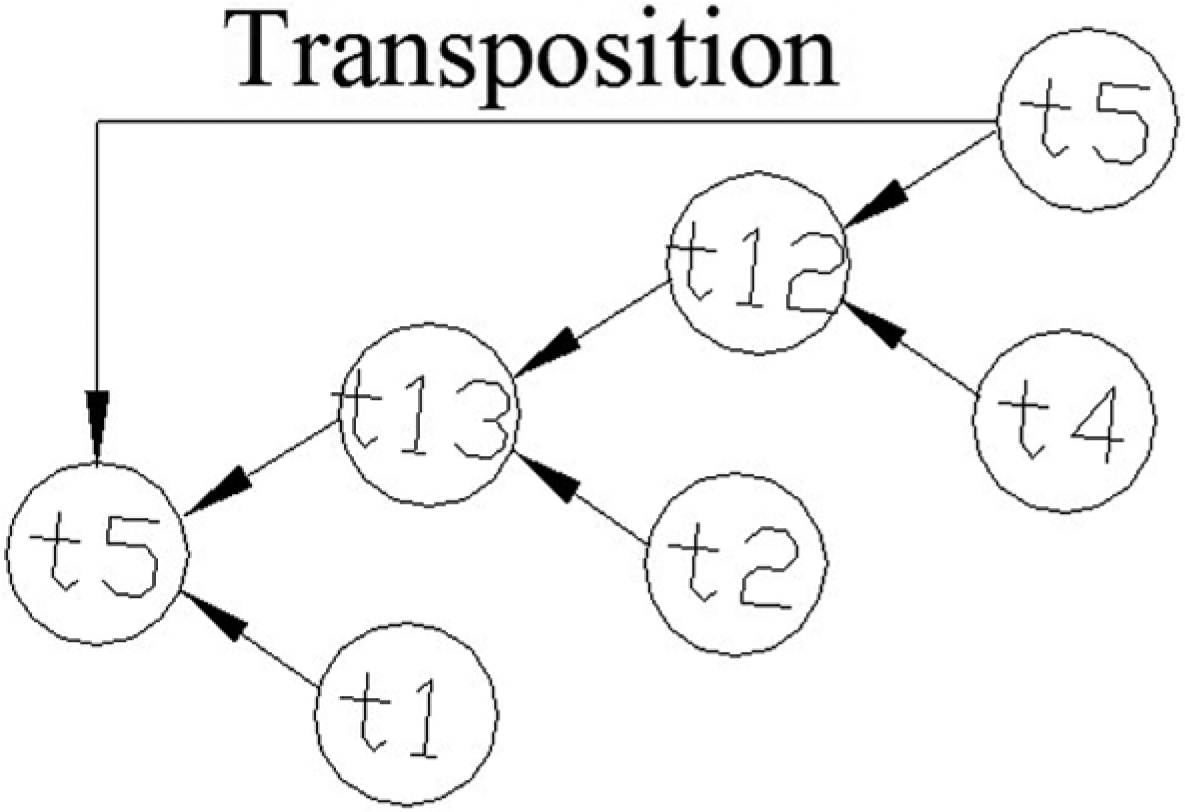
Figure 4 23 shows a simple network with loop. It can be dealt as a whole system. The temperatures between heat exchangers can be duplicated by using equation (4). If there are n heat exchangers in a network, there will be 2n equations. It is difficult to apply equation (4) in the same manner as that in single heat exchanger. But the solution can be gained by using transposition just as shown in Figure 5. T5 is determined by t1 and t13, and t13 is unknown. And so forth, t13 is determined by t2 and t12, and t12 is unknown. Then, t12 is determined by t4 and t5. Finally, the solution will be gained by using a simple transposition. So, given the exchanger parameters, the heat capacity, and inlet temperatures, all the remaining temperatures in a network with or without loops will be gained.

A simple network with loop.
Solution with transposition.
Table 1 shows the sensitivity table for the example shown in Figure 4. It is sufficient to provide all correlations between changers in all supply temperatures and the response in all other network temperatures. It will help designer to evaluate the response of the outlet temperatures to deviation of the inlet temperatures.
The coefficients of temperature propagation.

For example, as shown in Figure 4, according to equations (3) and (4),
As shown in Figure 4 and the above results, it can be concluded that if the disturbance factor is nearer the control variable, the influence will be greater. And the disturbance will weaken extending along the downstream paths.
Experimental facility and test conditions
Figure 6 shows a schematic of the experiment facility. The test facility has two independent systems: one is the heating and cooling medium system and the other is heat exchanger itself including two heat exchangers, volume flow control, test facility, and automatic data record subsystem.

Testing equipments.
The heating medium is saturated steam produced by a fuel oil boiler, and the cooling medium is cool air which is blown into shellside by a centrifugal blower. Their volume flow can be adjusted by the valves in the pipes. The data gathering and processing subsystem includes temperature sensor, flow sensor, pressure sensor, and data acquisition station. The experiment involves two heat exchangers. Shellsides of the two heat exchangers are in series. Cooling air was pumped into shellside of the first heat exchanger E1 and then flowed into the shellside of the second heat exchanger E2. The flow volume of cooling air was adjusted by the valves. The volume flow scope was from 25 to 50 m3/h. The tubesides of the two heat exchangers were parallel. And saturated steam was in the tubeside at 0.1 MPa, which provided a constant temperature in the tubeside. The connection schematic is shown as in Figure 7.
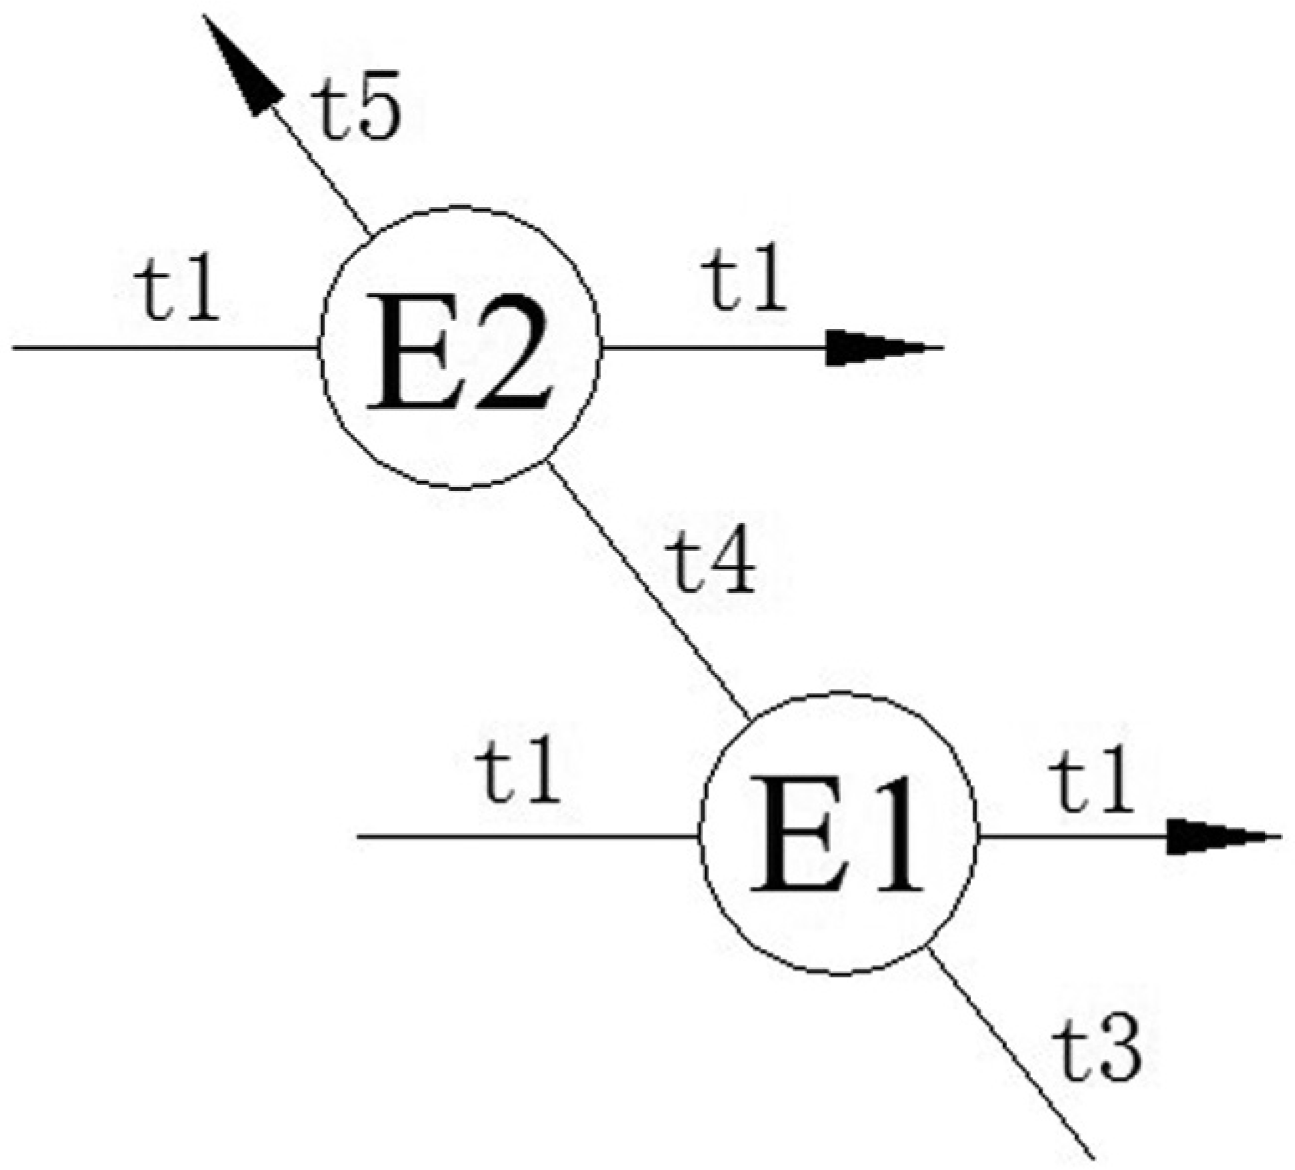
Sketch of testing facility.
Data reduction
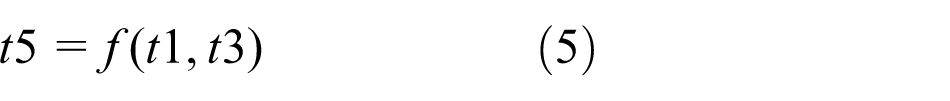
Just as shown in Figure 7, temperature t5 can be expressed as the function of temperatures t1 and t3
According to the concept of temperature-change sensitivity coefficient, temperature t5 would be written as

where
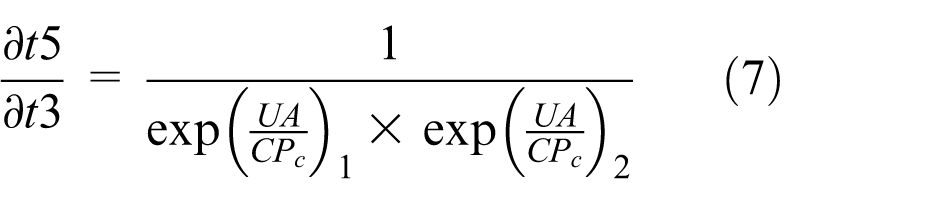

and

Results and discussion
Figures 8 and 9 show that the influence degree of steam temperature t1 imposed on temperature t5 is weak gradually with the increase in cool air volume flow. And the impact of temperature t3 imposed on t5 has the reverse function. Obviously, with the increase in cool air volume flow, the dominant position of the influence of steam temperature undulation is weakening gradually.

The difference of

The difference of
Figures 8 and 9 also show that temperature t1 has greater influence degree imposed on temperature t5 than that of temperature t3. If the disturbance is nearer, the influence degree will be greater. The influence degree will weaken extending along the downstream paths. Temperature t1 always occupies the dominant influence on temperature t5, because temperature t1 has direct relationship with temperature t5. However, the influence of t3 imposed on temperature t5 is indirect. The reason for the trends shown in Figures 8 and 9 is that with the increase in the cool air whose temperature is t3, the influence degree of t3 is greater.
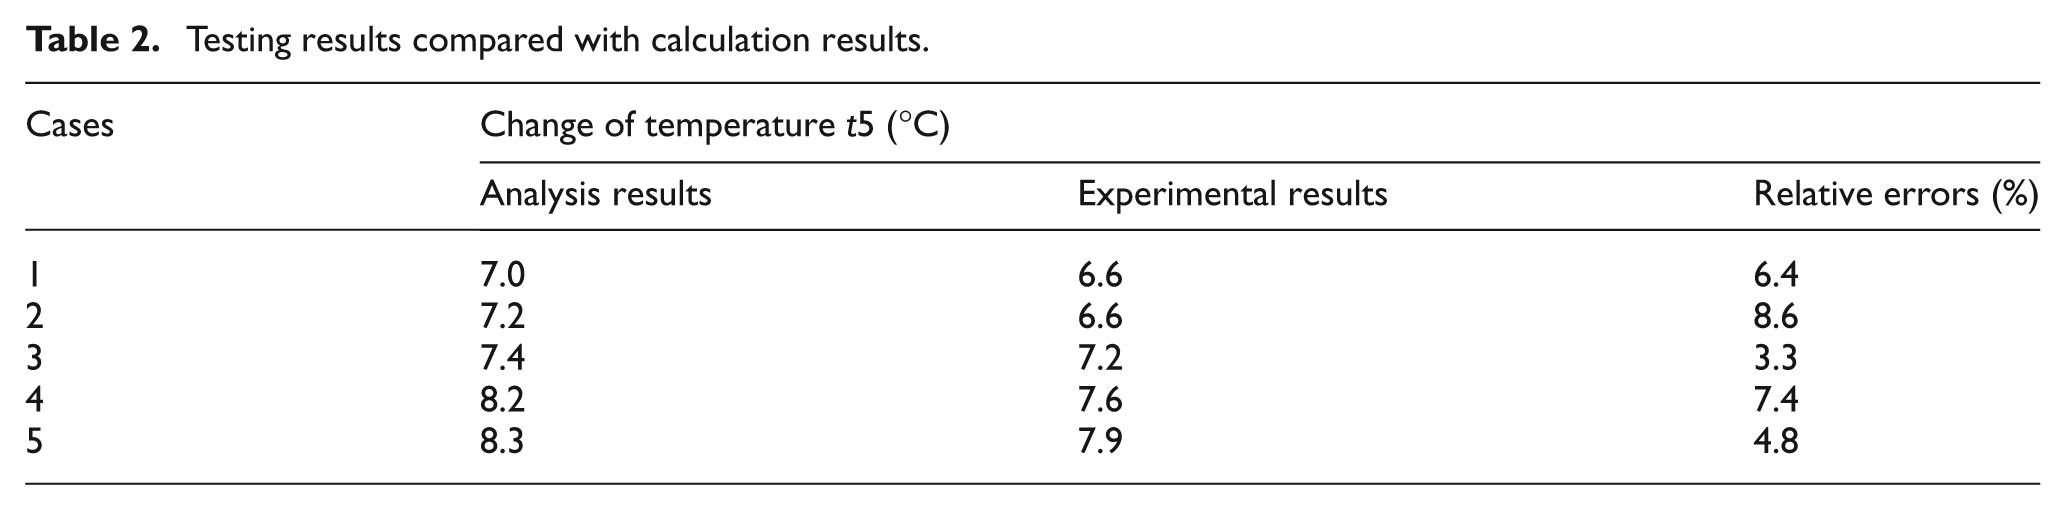
Table 2 shows the comparison of analysis results with the experimental results. The relative errors of the two results are within 10% for five cases. And the experimental results are smaller than the analysis results, which may result from the heat loss during experiment due to improper heat preservation. There would be better results if heat preservation is improved.
Testing results compared with calculation results.
Summary and conclusion
Based on the inherently linear relationship between the output and inlet temperatures of HEN, the concept of temperature-change sensitivity coefficient was put forward. Quantitative analysis of temperature disturbance can be carried out with the concept. Favorable results were obtained. So, it can be concluded that the analysis of temperature-change sensitivity coefficient can be used to value the influence degree resulting from temperature disturbance in an HEN.
Footnotes
Appendix 1
Academic Editor: Hongwei Wu
Declaration of conflicting interests
The author(s) declared no potential conflicts of interest with respect to the research, authorship, and/or publication of this article.
Funding
Financial support was provided by China Postdoctoral Science Foundation (Foundation item: Project Nos 2014M552011 and 132300410104) and it is greatly appreciated.