
Abstract
Corrosion is a factor that decreases the ultimate strength of a structure, which can lead to structural failure in an aged structure. This study proposes a reliable method to predict the ultimate strength reduction caused by pitting corrosion of a structure at various ages. Hence, the objectives of this study are as follows: (1) finding relationship between the ultimate strength reduction and pit depth and (2) finding relationship between the ultimate strength reduction and the age of structure. The presented method has six steps and was assessed by applying it to the simplified example of a thin-plate panel structure. The ultimate strengths of the panel with different pit depths were calculated using finite element analysis. The effects of material and geometric nonlinearities as well as the initial imperfections and buckling were also considered. A linear regression model, representing the relationship between the ultimate strength reduction and pit depth, was then developed. Furthermore, using the experimental data, the weighted mean value of ultimate strength reduction was acquired for different age groups of the panel. The introduced stepwise approach contemplates the nonlinearity of pitting corrosion with time by considering the experimental data. As corroborated by the successful application of the presented methodology, this method is more accurate, compared to the accepted practices available in the literature.
Introduction
For the offshore structures, such as offshore platforms, ships and land-based structural systems (i.e. pipelines), the decrease in the structural strength and structural integrity engendered by corrosion is a paramount challenge that should be examined in the design phase of a structure. As the age of a structure increases, the loss of the structure’s thickness caused by corrosion will cause a decrease in the ultimate strength of the structure and potentially a loss of integrity through pit, whose loss is particularly critical when protective coating systems, such as galvanizing or painting coatings, are ineffectual. 1
Conventionally, a deterministic approach is used to assess the remaining life of the offshore structures, but it is now recognized that the probabilistic method is a better approach because it is more robust and reliable. 2 Several probabilistic models have been proposed with the majority of them focused on predicting the amount of pitting corrosion for a structure with different ages.3–8 Paik et al. 9 scrutinized the ultimate strength characteristics of steel plates under compressive loadings and compared their numerical results with the experiments. Considering the various pitting corrosion intensities and plate geometric shapes, a new parameter, namely, “the smallest cross-sectional area,” was then introduced. Using regression analysis, a closed-form design formula, which relates to the ultimate strength of a plate to its smallest cross-sectional area, was also proposed. Jelovica et al. 10 evaluated the amount of reduction in the buckling strength of sandwich plates as a result of general corrosion. The main findings were that a 0.5-mm decrease in plate thickness will cause 25.5% decrease in their buckling strength, which is quite severe. Silva et al. 7 examined the reliability of rectangular steel plates under compressive loadings and time-variant corrosion wastage. The probabilities of failure of plates for their expected lifetime were computed and the percent reduction in the reliability indices for the servicing ages of plates was obtained. Nakai et al.11–13 calculated the compressive buckling strength and tensile strength of hold frames of bulk carriers with pitting corrosion. The compressive buckling strengths of pitted members were smaller than or equal to that with uniform thickness loss. Notwithstanding, the decrease in tensile strength was found to be 2.5 times more in the presence of pitting corrosion than with general corrosion.
As explained above, although the influence of corrosion on steel plates has been investigated,9,14–16 no study has suggested a stepwise semi-empirical method that predicts the ultimate strength reduction (USR) of a structure caused by pitting corrosion and a connection between the USR and age of that structure. This relationship is of critical importance because this information could help designing a more optimized structure that avoids structural collapse. Hence, this study aims to expound a novel step-by-step process that (1) approximates the USR of structures with pitting corrosion as well as (2) the correlation between the ages and USR of those structures. For demonstration purposes, the proposed methodology was applied on a simplified thin-plate panel structure and each step was explicated thoroughly. Moreover, a range of factors affecting the ultimate strength of stiffened plates, such as buckling, material nonlinearities, geometric nonlinearities and initial deflections, were also included in the analyses.
Proposed method for predicting USR of structures with pitting corrosion
As described briefly below, the proposed methodology describes six steps to find the USR of a structure generated by pitting corrosion as well as the link between the USR and ages of the structure (Figure 1). Each step is discussed in depth in the next sections.

Procedure of the proposed method.
In Step 1, the loading and boundary conditions of a structure are determined. The boundary conditions may comprise information, such as edge boundaries of the structure. In Step 2, the material properties and geometry dimensions of a structure, which include Young’s modulus, Poisson’s ratio, material nonlinearity information as well as the structure dimensions, are acquired. In Step 3, the pitting corrosion experimental data for each age of the structure are gathered. These statistics may include the pit depth and density of pit data. In Step 4, the initial deflections of the structure sourced by the manufacturing process are calculated. In Step 5, the ultimate strengths of the structure for different pit depths are obtained using finite element (FE) analysis. The USR values for different corrosion levels are also determined in this step. In FE analysis, the boundary conditions, material properties and geometry dimensions, geometric and material nonlinearities as well as the initial deflections are used as the input parameters. These input specifications have been explained previously in Steps 1–4. In Step 6, the pit depth relationship with the USR as well as the impact of age on the USR are delineated and discussed. The former relationship is determined by regression analysis, whereas the latter is estimated by applying the experimental data in statistical analysis.
Application of the proposed method on a thin-plate panel structure
The proposed method was applied on a panel used in the offshore structures and each step was elucidated below.
Step 1: loading and boundary conditions
Step 1.1: loading conditions
The plates used in the body of the offshore structures, such as ships and offshore platforms, are likely to be subjected to both in-plane and out-of-plane loads. Examples of in-plane loads on the offshore structures include edge shear, axial compressive/tensile loads in both longitudinal and transverse directions and longitudinal and transverse in-plane bending. The out-of-plane loads encompass lateral loads induced by water pressure. 13 A precise definition of the loading conditions plays a key role in the accuracy of analysis, but for a demonstration of this approach, only the compressive axial loadings are accounted (Figure 2).
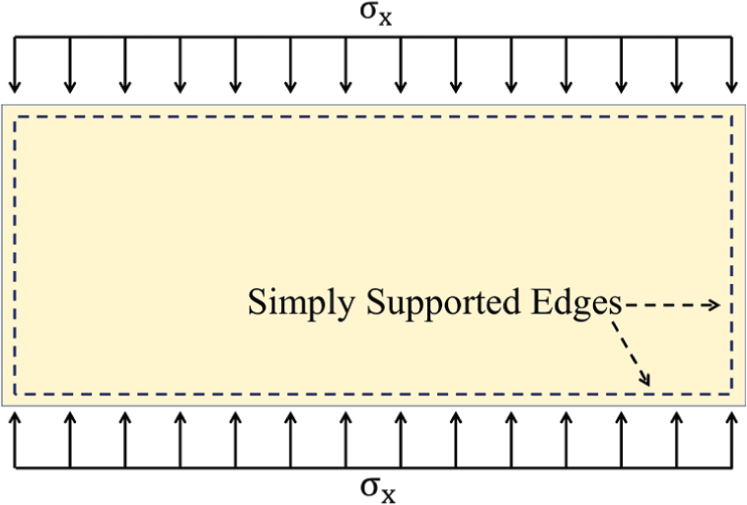
Axial compressive loading conditions with a top view.
Step 1.2: plate edge boundary conditions
A stiffened plate, which is used separately for examination, is part of the entire structure. For this reason, correct idealization of the edge boundaries, which represent the influences of other components of the structure on the plate, is important. A plate’s edge might have three distinct boundary conditions, that is, zero restrained (simply supported), partially restrained and infinite restrained (clamped). In reality, the edges are surrounded by support members; therefore, they are not simply supported nor clamped. -Nevertheless, in ocean engineering practice, the plate edges are simplified as clamped or simply supported.
17
In this report, all four edges of the plate are assumed to be “simply supported” with a symmetric condition, as shown in Figure 3, where
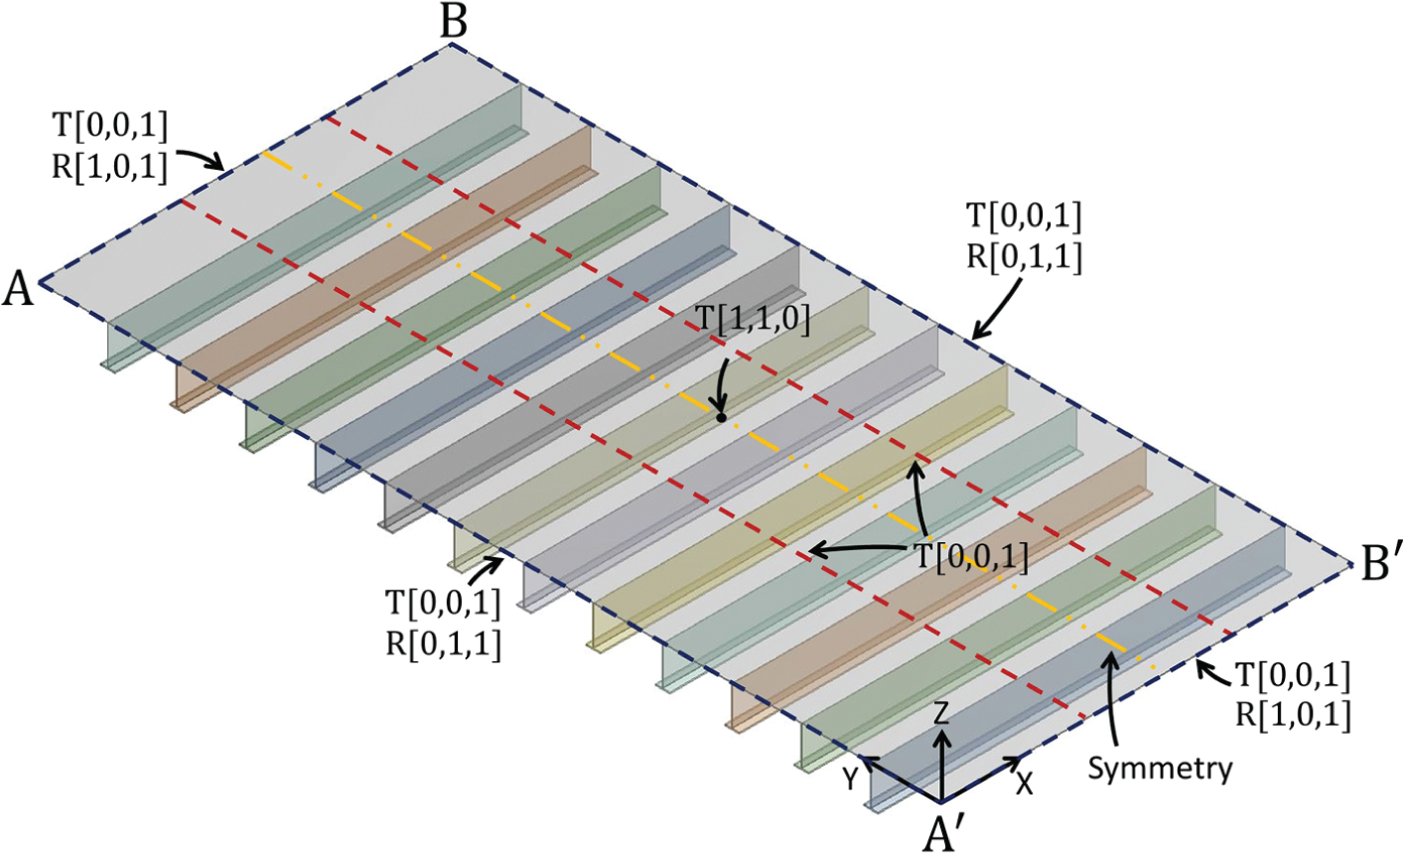
Simply supported boundary conditions with symmetric conditions.
Step 2: material properties and geometric dimensions
Step 2.1: material properties
The materials used in a body of the offshore structures are normally mild- or high-tensile steels. Aluminum alloys are also used in designs where the weight of the structure is critical. In the present application, the plates are made of high-tensile steel with the material and mechanical properties listed in Table 1.
Material properties of the stiffened plates.

Step 2.2: geometry dimensions
The geometries of thin-plate panels used in the offshore structures are generally rectangular, and a schematic example of this common bare panel is presented in Figure 4, where
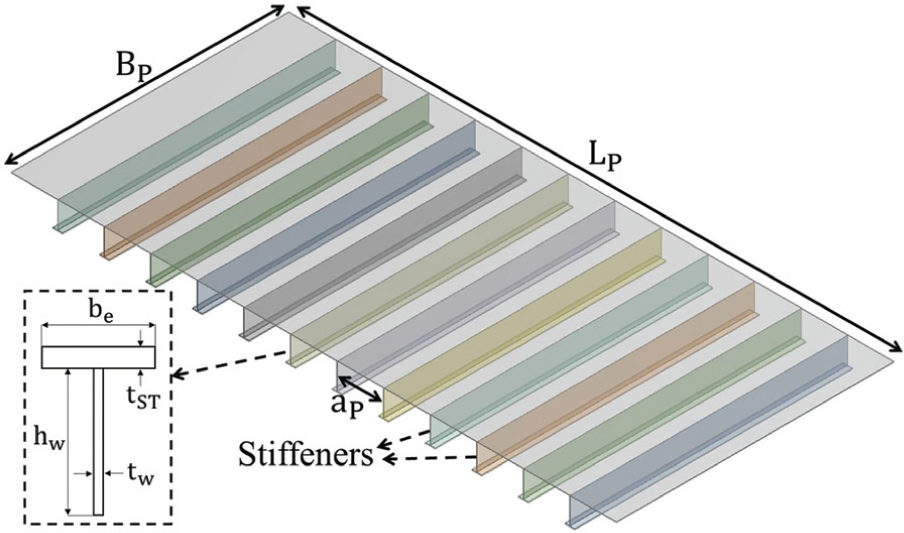
Schematic of a rectangular panel: Lp, panel length; Bp, panel breadth; ap, stiffener spacing; be, stiffener breadth length; tSB, stiffener breadth thickness; hw, stiffener web height; tw, stiffener web thickness.
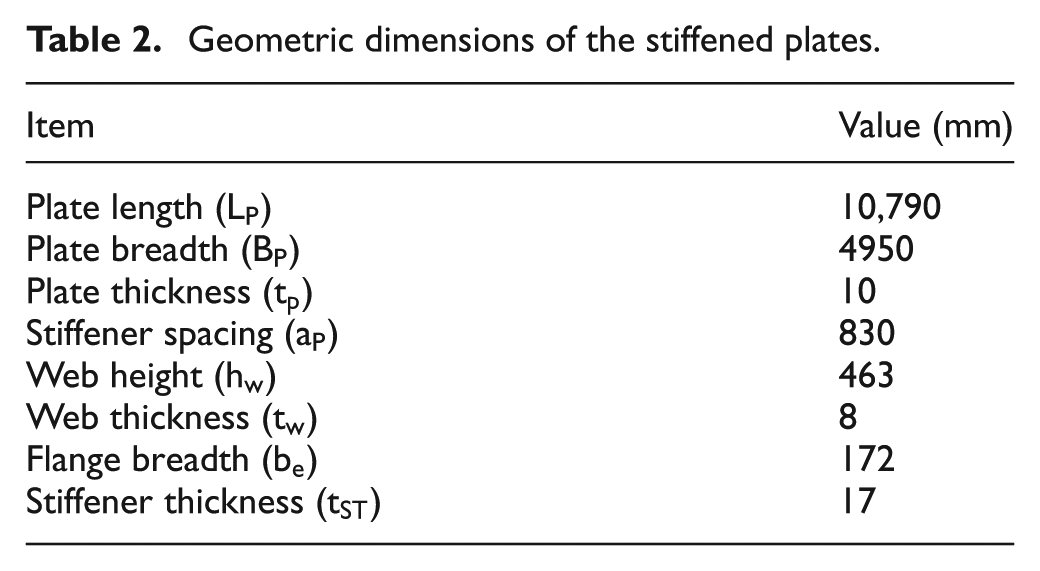
Geometric dimensions of the stiffened plates.
Step 3: pitting corrosion experimental data
A structure with a coating system resists pitting corrosion for up to 10 years of its service lifetime depending on its coating system type. After this period, both the depth and density of pits will grow gradually as the structure ages. This pitting corrosion may have wide and shallow or narrow and deep shapes, which can quickly pierce the walls of a structure 11 (Figure 5). In this study, the pitting corrosion is distributed uniformly on the surface of the panel (opposite to the stiffeners). The pitting corrosion is simplified as cylindrical to remarkably reduce the number of nodes and elements of the mesh in FE analysis. In reality, the pit diameters range from 25 to 80 mm with the lower values having higher likelihood. 18 In this study, a constant pit diameter of 25 mm is used for the FE analysis.

Various pitting corrosions: (a) narrow and deep, (b) elliptical, (c) wide and shallow, (d) subsurface, (e) undercutting, (f) horizontal and (g) vertical pitting corrosion.
Paik et al. 19 collected a total of 1935 steel panels with pit corrosion data and analyzed their statistical characteristics to find a correlation between the growth of the pit depth as a function of panel’s age. A part of their work, which is displayed in Table 3, was utilized in this analysis with prior permission from the authors and the publishing company. This table categorizes all the experimentally collected steel panels into different groups based on their age and pit depth. For example, a total of 25 panels had 11–12 years of age, where among these panels, 20 of them had 0–0.5 mm pit depth and the other 5 panels had 0.5–1 mm pit depth. In other words, Table 3 shows the frequency of the pit depths as a function of time (age of a structure). However, because this table lacked pitting density data, the plates in this study were presumed to have a pitting density equal to 30% of the plate’s surface area.
Thickness loss due to corrosion in seawater ballast tank.

Source: reproduced with permission from Elsevier (license number 3580500550531). 19
Step 4: initial imperfections
Initial imperfections prompted by the manufacturing procedure (e.g. welding process) reduce the strength of the panels. For example, initial distortions and residual stresses are the two primary initial imperfections that prevail in steel panels. These imperfections are produced by successive expansion and shrinkage during the heating and cooling processes. In the case of welded aluminum plates, softening of the material in the heat-affected zone should also be taken into consideration. The initial imperfections should be included as the parameters of influence in ultimate strength analyses. 19 Detailed descriptions of the mechanics and configurations of initial imperfections with their mathematical idealizations can be found elsewhere.20–22 In this work, the initial deflections of the plates were calculated using the subsequent equation, whereas residual stresses and global initial deflections are neglected

where
Step 5: ultimate strength analysis
Step 5.1: three-dimensional modeling and meshing
Using the geometry dimensions and material properties, as described in Step 2, a solid model of the structure was designed by ANSYS DesignModeler®. This solid model was then meshed and the mesh quality was assessed to ensure that the numerical error was low. Figure 6 gives an example of a three-dimensional (3D) model with mesh.

Example of a 3D model panel with finite element meshes.
Step 5.2: nonlinear FE analysis
This study performed nonlinear FE analysis, and structural nonlinearities (e.g. material and geometric nonlinearities) were considered. Typically, linear analyses are used because they are easier to compute, their computational costs are lower and their solutions could be superposed on each other. Despite the benefits of linear assumptions, in the presented method, linear analyses are inadequate and the nonlinearities should be considered because this method aims to find the ultimate strength of the panels under their finite deformation during buckling. Nonlinearities exist in all physical problems and they are divided into three main types, that is, material nonlinearities, geometric nonlinearities and contact nonlinearities, 23 and this study with no contact assumptions adopted only the material and geometric nonlinearities.
Material nonlinearities
In linear FE analyses, the stress–strain relationships are found exclusively by the modulus of elasticity (E). However, because this study assumed finite deformation behaviors during buckling, the material nonlinearities were considered using the elastic–perfectly plastic material neglecting the strain-hardening effect (Figure 7(a) and (b)).

(a) Schematic of typical stress–strain curve and (b) elastic–perfectly plastic model of high-tensile steel.
Geometric nonlinearities
In the presence of large deformation, the changes in the geometric configuration of the structures may lead to nonlinear responses. These geometric nonlinearities produced by large displacements and rotations were also considered in this study.24–26
Step 5.3: USR
USR analyses for all the panels are done in this step. Nonlinear FE analyses were performed using the ANSYS computer software suite. In these analyses, the longitudinal compressive stress (
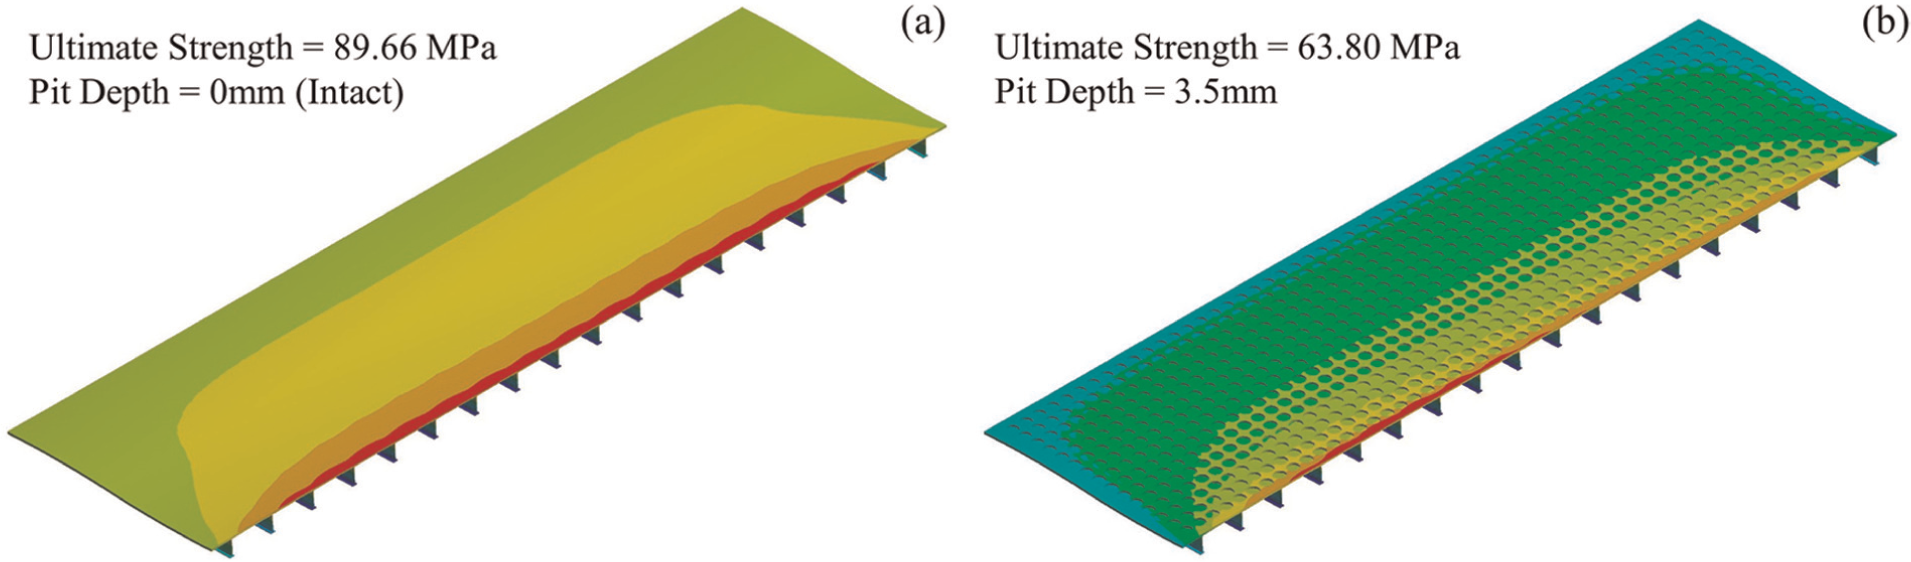
Finite element analysis results of two example panels with pit depths of (a) 0 mm (intact) and (b) 1 mm, under ultimate limit state.

Axial compressive average stress–strain relationships of the panels under x-direction compressive loadings: (a) stress–strain curves and (b) stress divided by yield strength versus strain curves.

(a) Ultimate strength behavior of panel with various pit depths, (b) relationship between the USR and pit depth with linear regression approximation and (c) weighted mean USR versus age relationship.
The intact plate’s ultimate strength was then considered as a reference and the value of the USR of each panel with distinct pit depths was obtained using the following equation

where
As expected, the ultimate strength of the panel decreased with increasing pit depth (Figure 10(a)).
Step 6: relations of USR, pit depth and structure age
The first objective was to find a relationship between the USR and pit depth. The USR versus pit depth plot showed a linear relationship (Figure 10(b)) and was fitted by the following linear equation with

A structural engineer in the related research community can use the stepwise method introduced in this study to obtain this relationship. This relationship can then be used in the design of a structure which can withstand this predicted USR caused by pitting corrosion.
The effects of age on the USR (Table 4) were found by modifying and combining the experimental pit data (Table 3) and the USR relationship with pit depth (Figure 10(b)). The results of Table 3 were summed up to form three categories of ages (i.e. 11–15, 16–20 and 21–26 years) as shown in Table 4. In Table 4, the pit depth values were also replaced by their corresponding USR percentage values (e.g. 0–0.5 mm was changed to 0%−7%). In addition, the weighted mean of the USRs for each category was computed by the following equation (Table 4)

Effect of age of the panel on the USR and the weighted mean USR.
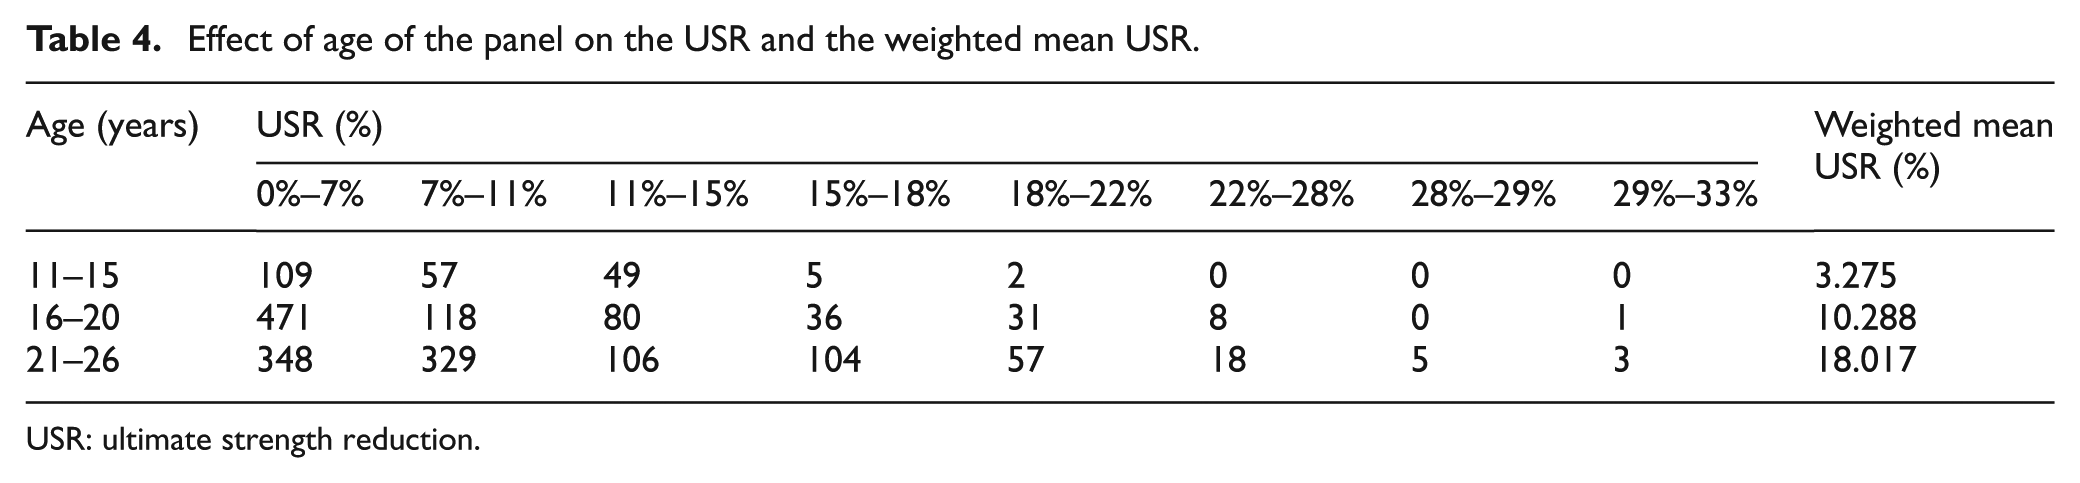
USR: ultimate strength reduction.
where

This weighted mean USR increased with increasing age of the structure (Figure 10(c)).
The pit depth is a factor with a considerable influence on the USR of a structure. By conducting statistical analysis, a regression model was generated, as shown in equation (3). This regression model could be used to find the USR of a structure for different pit depths. On the other hand, the relationship between the ages of the structure and their USR was insignificant; hence, using the age of the structure to predict its USR is imprecise. Hence, the age of the structure was categorized into three groups in order to organize the statistical data in a meaningful way.
Conclusion
Several deterministic ultimate strength models were developed by the researchers to approximate the USR values caused by pitting corrosion, but none of them shows an accurate prediction, simply because pitting corrosion varies nonlinearly with the age of a structure. A semi-empirical approach proposed in this study fits this challenge best because the deterministic approach is impractical.
The aim of the study was to investigate the effect of pitting corrosion depths and structure ages on the USR and it was successfully achieved by our newly proposed stepwise semi-empirical method (as shown in Figure 1) to predict the ultimate strength of the offshore structures, to calculate the ultimate strength reduced by the effects of pitting corrosion and structure ages and to find semi-empirical relationships between the structural ages and the USR as well as between the pitting corrosion depths and the USR. The proposed method was presented by a stepwise procedure that made this unique method of this study simple and easy to understand. Moreover, the simplicity and step-by-step process of the proposed method enabled it to be suitable for real-world implementations. To demonstrate these features, the feasibility of this original work was examined by an application on a panel used in the offshore structures. The relationships between the structural ages and the USR as well as between the pitting corrosion depths and the USR can be used by the related research community for examining the mechanical integrity of floating offshore sub-structures, because these relationships have the advantage of directly calculating the USR as a function of structure ages (Figure 10(c)). However, it is currently limited to three ranges of ages, and further statistical data of pitting corrosion and structure ages will be needed to reveal yearly changes in the USR caused by pitting corrosion. Regarding the newly proposed method in this study, it was divided into six steps with each step explained in detail by applying it to a thin-plate panel. In Steps 1 and 2, the specific data about the problem, such as boundary conditions, loading conditions and material properties and geometry dimensions, were collected. In Steps 3, the pitting corrosion experimental data were obtained from another study with permission. 19 In Step 4, initial deflections of the structure were calculated. This information was later used in Step 5 to calculate the ultimate strength of the structure. Step 6 contained the result evaluations. The pit depth relationship with the USR as well as the correlation between the structure ages and the USR were shown. The former relationship was determined by regression analysis, whereas the latter was obtained by statistical analysis using the experimental data. In future work, the proposed method can be extended to full structure applications, such as predicting the USR of ships and spar platforms and validated through experiments. Furthermore, the density of pits (DoP) is a significant factor that effects the USR of the plates and will be considered in future studies.
Footnotes
Acknowledgements
Sajad Rahmdel and Kwanghoon Kim contributed equally to this work.
Academic Editor: Liyuan Sheng
Declaration of conflicting interests
The author(s) declared no potential conflicts of interest with respect to the research, authorship and/or publication of this article.
Funding
The author(s) disclosed receipt of the following financial support for the research, authorship, and/or publication of this article: This research was supported by Basic Science Research Program through the National Research Foundation of Korea (NRF) funded by the Ministry of Education (NRF-2013R1A1A2062436) and Leading Foreign Research Institute Recruitment Program through the NRF grant funded by the Ministry of Science, ICT & Future Planning (No. 2009-00495).