
Abstract
An extracted fault component of an abnormal sound is useful for faulty diagnosis. The existing fault component extracting approaches based on time–frequency analysis should filter the original signal to eliminate the background noise. However, these approaches will significantly change the fault component. In this article, a method for extracting the fault component of an abnormal sound signal is presented. This method is based on the linear superposition method and cross-correlation analysis. The method can eliminate the background noise and acquire the waveform of fault component. According to the feature of the shocking fault component, the acquired signal was intercepted into several segments, and the cross-correlation analysis was adopted to remove the wrong segment without the fault shocking component. The correct components were then linearly superposed together to eliminate the background noise. Finally, two experiments were performed to evaluate the effectiveness of the proposed fault component extracting method. The results show that the approach satisfactorily extracts the fault shocking component. The precise faulty component can be extracted by this method, which judges the engine condition precisely. The fault type can be diagnosed easily by this method. This method can be used in other fields to extract a particular component from a complicated signal.
Introduction
The acoustic and vibration signals of an engine often provide considerable dynamic information about an engine’s condition, which is a mixed signal that contains fault ingredient, other normal acoustic signals, and background noise. Many useful signal analysis methods, such as Fourier transform, wavelet analysis, empirical mode decomposition, and blind source separation, can be used to extract fault features for diagnosing engine conditions.1–3
The Fourier transform transfers a signal from the time domain to the frequency domain. Thus, Fourier transform is a simple method for extracting the frequency feature of a fault engine acoustic signal or a vibration signal to diagnose the engine fault. However, this method cannot handle a non-stationary signal well and can be substituted by the wavelet analysis method. 4 Wavelet analysis is used for the multi-scale analysis of a signal and extracted frequency features of a signal. Paulraj et al. 5 used Daubechies “db4” wavelet to decompose a vibration signal into five levels and then extracted the fault features by back-propagation neural network. Czech et al. 6 used vibro-acoustic signals to diagnose damages on the mechanical elements of car’s combustion engine by wavelet analysis and artificial neural networks. The result shows that this approach can efficiently diagnose some faults. Many studies have investigated engine fault diagnose by wavelet analysis method. However, choosing the appropriate wavelet function to extract fault features from the sound signal of an engine is difficult.
The empirical mode decomposition method proposed by Huang NE et al. 7 can handle nonlinear and non-stationary signals well. Yadav and Kalra 8 introduced energy and correlation measures based on empirical mode decomposition, which are used to determine the most representative intrinsic mode functions (IMFs) for extracting fault-induced characteristics features from vibration or acoustic signals. Wang et al. combined empirical mode decomposition with support vector machine to extract the fault features and detect the abnormal states of vehicle engines. The results show that the proposed method can deal with both stationary and non-stationary signals. 9 However, an end effect restraint problem cannot be solved and intrinsic mode functions are not equal in different situations.
Blind source separation is the separation of a set of source signals from a set of mixed signals, without the aid of information about the source signals. Many algorithms have been used in the method for signal separation.10–12 However, the algorithms of blind source separation are immature to handle practical problems.
The methods involved above mostly transfer a signal from a time domain to a frequency domain for signal processing and filtering. Nevertheless, the processing changes the background signal and concerned signal component. This article presents a new approach that extracts faulty component of a noise signal of an engine in the time domain to diagnose engine faults without changing the concerned component of the signal.
Shocking acoustic signal features
This section studies the features of shocking acoustic signals to find the differences between shocking signal waveform and background noise wave and the relationship of the same type of shocking signals under different force actions. The degree of hearing clarity of a shocking signal component with a different energy is then studied.
An engine can have two fault types: scraping fault, which is caused by scratches between two parts, and shocking fault, which is caused by collision, breakage, or deformation. This article will mainly discuss scraping fault. Four types of shocking signals can exist between different objects, as shown Figure 1; these signals have the same features and change acutely at the starting location. The shocking acoustic signal waves between two objects under different forces’ action are similar, as shown in Figure 2.

Shocking acoustic signal between different objects: (a) plastics and wood, (b) metal and metal, (c) plastic and metal, and (d) wood and wood.
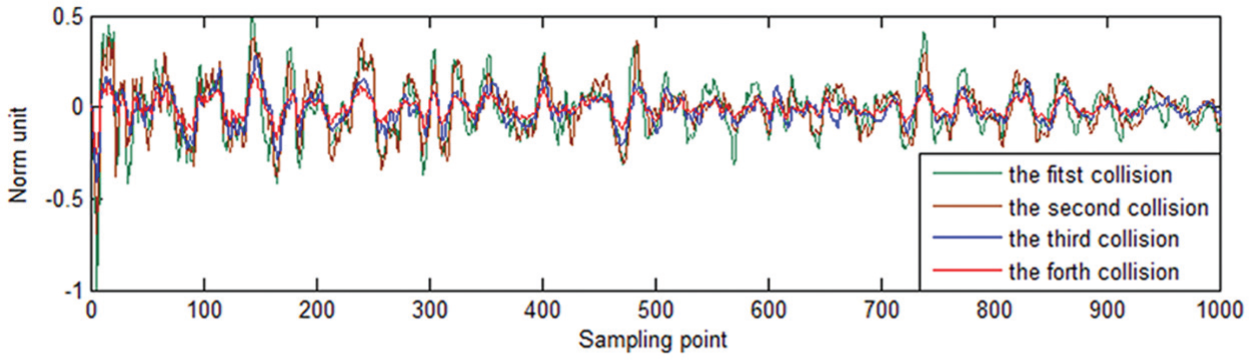
Shocking signal waves between a metal plate and metal rob under different forces’ action.
When an abnormal sound appears, the fault component should be large enough. Otherwise, the fault component will be masked by the background noise. The relationship between the maximum value ratio of pure shocking signal-to-background noise and hearing clarity degree is shown in Figure 2. This relationship is obtained from a hearing experiment using Coolpro software. When the hearing clarity degree reaches to 40%, an abnormal sound is heard obviously and the range of maximum value ratio is from 1.4 to 1.6. The value ratio is the ratio between energy of fault component and energy of background that cannot contains the former. In this article, the research object is the abnormal sound that can be heard by the ears. Therefore, the maximum value ratio of the faulty component must be larger than 1.4.
Signal processing method
Most engine faults occur periodically, and the period is related to engine speed. However, given the non-stationary engine running speed, the intervals of the abnormal sound are not identical. Therefore, the average interception method can be used to intercept the signal. In this section, the signal interception methods are introduced. x(n) denotes the shocking signal component, and y(n) is the background noise. The acquired superposition signal is represented by the following formula

where n is the sampling point.
To extract the fault component, several segments from the original signal can be intercepted, and the starting point of each segment is the initial position when the shocking fault occurred. The lengths of each segment represented by si (k) are identical. According to the linear superposition principle (LSP), each segment is linearly superposed, and their mean value is calculated as follows

where


where
If the value of
To analyze the value, we first calculate the energy of signal by using time linear superposition twice

To illustrate the energy, we assume that the energy of shocking fault component and background noise is equal in every intercepted segment

Given the randomness of
Segment intercepted method
In this section, the segment intercepted method and starting point chosen method are studied. When the abnormal sound appears, the shocking fault component has an acute change that cannot be easily masked by background noise (Figures 1 and 3). To illustrate the method, all extreme maximum points of the shocking fault component are assumed negative. The values are ai (i = 1, 2, 3, …, n) and the corresponding values of the background noise are bi (i = 1, 2, 3, …, n). Given the randomness of bi , some negative values and the mixed signal (si ) can be expressed as follows


Relationship between the maximum value ratio of the pure shocking signal-to-background noise and hearing clarity degree.
Equation (4) illustrates that when the shocking fault component mixed with background noise, some points among all the extreme maximum points must fit with the maximum value of the shocking fault component. We can set a threshold to choose some points as the alternative extreme maximum points of the shocking fault points. The method of calculating the threshold is described as follows:
Step 1: intercept a segment from the mixed acoustic signals of an engine that contains 10–20 engine operation cycles.
Step 2: find all the extreme value points.
Step 3: set the smallest value from the 10 biggest chosen points of the absolute value as the threshold.
However, these points are not the initial positions when the shocking fault component occurs. According to the feature of the shocking signal, we can set
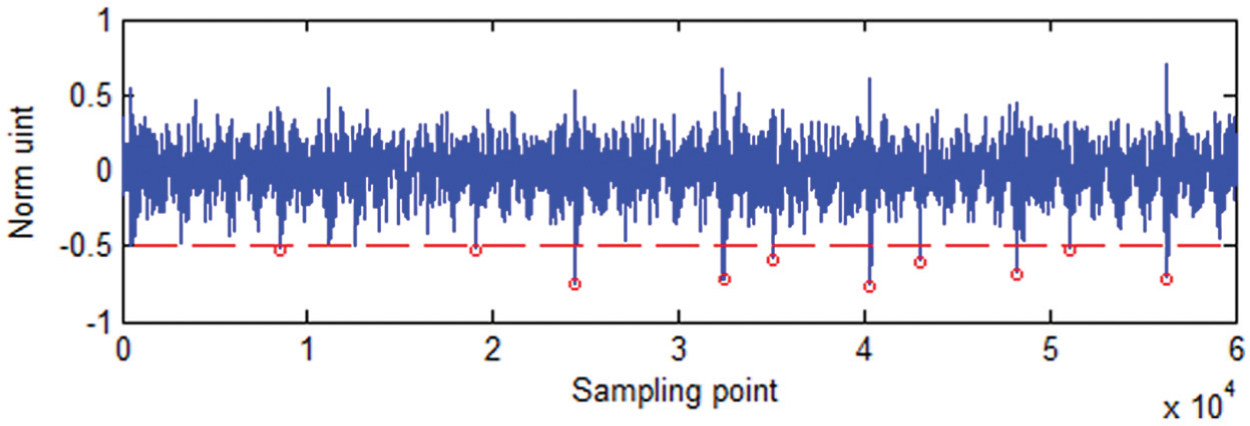
Example signal of abnormal sound with threshold and alternative extreme maximum points.
Cross-correlation analysis
Some alternative extreme maximum points are incorrect because the background noise signal has randomness. The cross-correlation analysis method is used to identify these points. The steps are described as follows:
Step 1: the signals of the intercepted segments are filtered. The shocking fault component is a stationary process with zero mean value. Therefore, the intercepted segments can be low-pass filtered to decrease the interference of high frequency

where
Step 2:

where

where


where a(·) represents the shocking fault component and b(·) represents background noise.
The two adjacent filtered intercepted segments can be seen as Gaussian noise with zero mean value; therefore, the value of

where
By substituting equation (7) into equation (9), we find the following

where
Step 3: once the intercepted segment with fault component has been chosen, this segment is used to choose all the intercepted segments with the shocking fault component by the cross-correlation analysis method.
Six groups of data can be acquired from a failure engine to identify the above research, which is shown in Figure 5. The third group of data and one set of the sixth group of data contain shocking fault components. The correlation cross-coefficient function is shown in Figure 6.


Cross-correlation coefficient function.
When the intercepted segments contain a shocking fault component, the maximum value of cross-coefficient function is larger than others and the symmetry is perfect (Figure 6).
Experiment and data processing
In this section, we will test the method presented in the above section by using two experiments.
The faults of cylinder misfire and loose bearing cap bolt are common. These faults affect engine performance. When an engine is in the state of a cylinder misfire and has loose bearing cap bolts, the vibration and noise increase. In this article, the acoustic signals acquired from an experimental bench are shown in Figure 7, where the engine is disassembled from a J4R truck produced by FAW. The parameters of the engine are shown in Table 1. The sampling rate of acoustic sensor is 44,100 Hz, the signal-to-noise ratio is 77 dB, and the frequency range is from 20 Hz to 20 kHz. The sensor was placed onto the ceiling of the experimental bench room to reduce the impact of vibration. The fuel injector of the third cylinder was stopped when the fault source of the cylinder misfires, which is the first experiment. The second experiment is about loose bearing cap bolt fault, which would not destroy the engine. The acoustic signals acquired are shown in Figure 8, where the points with red circles are the alternative extreme maximum points.
Diesel engine parameters.


Experimental bench.

Acoustic signals of cylinder misfire and bearing cap bolt loose faults.
In the experimentation on cylinder misfire, the 10 alternative extreme points are all the correct points according to the cross-correlation analysis, which are shown in Figure 9(a). Therefore, to check the extracted shocking fault component, we separated the points into two groups that contain five segments each. In the experimentation on the loose bearing cap bolt, only nine points are correct, as shown in Figure 9(b). We find that the red curve, which is the cross-correlation coefficient between the first and sixth segments, is asymmetric and is different from the other curves. Therefore, the first group contains five segments and the other group contains four segments. According to the periodicity, the sixth segment should contain the shocking fault component. However, the sum value between another extreme point’s value and the value of the corresponding background noise is larger than the extreme maximum point of the shocking fault component in this segment, thus leading to the wrong starting point being chosen.
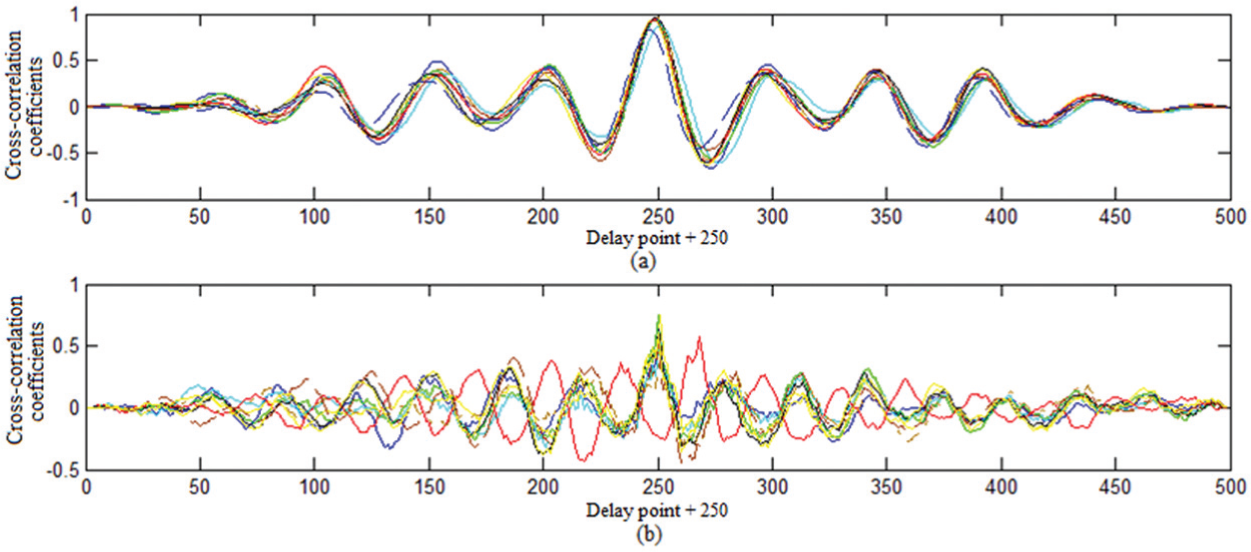
Cross-correlation coefficient function (each segment contain 250 sampling points, figure (a) and (b) respectively represent the cross-correlation coefficient functions between the first segment and the other nine segments intercepting from cylinder misfire fault signal and loose bearing cap bolt fault).
The enveloped waveforms of the above two experimentations are shown in Figure 10. Figure 10(a) shows that the two curves are composed of five segments. In Figure 10(b), the blue curve is the linearly enveloped mean function of the first five intercepted segments and the red curve represents the linearly enveloped mean function of the other four segments. Figure 10 illustrates that the waveforms of two enveloped functions in each group have high similarity. Therefore, the shocking fault component can be extracted by the method mentioned above and the two new signals can be deemed as the fault components individually. The data processing of extracting faulty component is in time domain. The background noise significantly weakens and the faulty component is completely reserved. However, the extracted faulty component is significantly changed if the extraction using other filtering methods is in the frequency domain.

The enveloped function waveforms of two experiments' intercepted segment: (a) cylinder misfire fault and (b) loose bearing cap bolt fault.
When the signal of the shocking fault component is extracted, the wavelet method or Fourier transform method can be used to analyze the type of fault. This method will be introduced in future article.
Conclusion
This article presents a new method for extracting shocking faulty components from the abnormal sound signals of a failed engine for diagnosis. The observations and conclusions of the study are summarized as follows.
A new extracting shocking fault signal method is proposed by cross-correlation analysis and linearly superposing several intercepted segments. The shocking fault component is extracted from the abnormal sound signal of the failure engine. By comparing the cross-relativity among several intercept segments, the correct segments were chosen and then superimposed together to eliminate the background noise.
The results show that the new approach can precisely extract the shocking fault component, the precision related to the number of intercepted segments, and the chosen starting points.
Footnotes
Academic Editor: Fakher Chaari
Declaration of conflicting interests
The author(s) declared no potential conflicts of interest with respect to the research, authorship, and/or publication of this article.
Funding
The author(s) disclosed receipt of the following financial support for the research, authorship, and/or publication of this article: This work was supported by the Fundamental Research Funds for the Central Universities (No. 3132015091), Liaoning Natural Science Foundation (No. 2014025007), National Key Technology Support Program (No. 2014BAB12B05), and the National Natural Science Fund (No. 51275063).