
Abstract
Since indentation rolling resistance accounts for the major part of total resistance of belt conveyor, it is important to compute it using a proper method during the design and application study of the belt conveyor. First, an approximate formula for computing the indentation rolling resistance is offered. In this formula, a one-dimensional Winkler foundation and a three-parameter viscoelastic Maxwell solid model of the belt backing material are used to determine the resistance to motion of a conveyor belt over idlers. With the help of this formula, the authors analyze the effect of common factors on the rolling resistance. Finally, experiments are carried out under certain condition compared with theoretical analysis. A reasonable correlation exists between the experimental results and the theoretical formulae.
Introduction
When belt backing passes over a series of idlers of belt conveyor, the inelastic deformation and indentation of backing material resulted from viscoelastic property can cause a type of running resistance that is defined as indentation rolling resistance. What is more, energy loss due to indentation rolling resistance is generally considered to be dominant loss mechanism. Vieweg et al. 1 elaborated the dynamic shear property of styrene–butadiene vulcanizates filled with carbon black. O’Shea et al. 2 proposed the effect of viscoelastic property measurements on the predicted rolling resistance. Fletcher and Gent, 3 Payne,4,5 Ulmer, 6 Drozdov and Dorfmann, 7 Vieweg et al.,1,8 Wang,9,10 Qiu, 11 and Qiu and Chai 12 presented the full two-dimensional model to determine the pressure distribution between the idler and belt backing. Hager et al.’s 13 article developed the influence of the pulley cover compounds on resistance. Lodewijks 14 investigated the connection between dynamic properties of rubber and energy loss due to rolling resistance. Wheeler 15 analyzed the indentation rolling resistance with the help of finite element model (FEM) instead of full two-dimensional model. Lauhoff 16 focused on the main factor, such as belt speed, that can affect the energy efficiency. Nordell 17 discussed various types of running resistance on the belt conveyor. Jonkers 18 carried out a lot of field experiments to deduce a formula to calculate indentation rolling resistance. Mao Jun19,20 pointed out that the viscoelasticity of belt primarily causes the indentation resistance. Wheeler and Munzenberger 21 presented the influence of various factors on the indentation rolling resistance using experimental data.
In this article, the authors discuss the viscoelastic property of the backing material and select Maxwell solid model to reflect the viscoelastic property first. Subsequently, with the help of Maxwell solid model in combination with the Winkler foundation deformation, a formula of indentation rolling resistance is inferred to analyze the effect of common factors on rolling resistance. Then, the authors propose an intelligent optimization algorithm to solve the formula. Finally, theoretical result when compared with the test result indicates that the formula has a reasonable reliability.
Theory of indentation rolling resistance
Three-parameter viscoelastic Maxwell model
Generally, the rubber compound which often acts as the backing material of belt often has the viscoelastic property. In order to reflect this property, various arrangements of springs and dashpots are used. Especially, Rudolphi and Reicks 22 adopt 2N + 1 Maxwell model to express the viscoelastic characteristic. What is more, the superiority of using 2N + 1 Maxwell model is that it can achieve a higher accuracy for revealing the viscoelastic characteristic. It is worth noting that the theory of this article is based on the Rudolphi and Reicks’ article. However, in actual practice, the three-parameter Maxwell solid model is often used to reflect the viscoelastic property similar to the one presented in Lodewijks’s 23 article and adapted from May et al. 24 As for this model, it includes a single spring in parallel with another spring and a dashpot as shown in Figure 1, where the constants E 1 and η 1 represent the elastic and dissipative elements of the model and E 0 is referred to the equilibrium modulus.

Mechanical elements of three-parameter Maxwell model.
When the backing material selects the three-parameter Maxwell model to represent the viscoelastic property, the stress response function of the backing material is given by the Prony series 20

where τ is the relaxation time, which is the characteristic period of the three-parameter Maxwell model

Rubber properties and material characterization
Usually, a cyclic mode at various frequencies is utilized to achieve the viscoelastic property through Fourier analysis. As for a sinusoidal strain history of the form ε = ε 0 sin(ωt), ω is the angular frequency and ε 0 is the amplitude, after an initial strain transitory state, the stress of the backing material follows the strain in frequency and at a delayed phase or angle δ. In all, the connection between stress response and strain input is defined as follows

The stress is expressed by σ(ω) and the magnitude of the complex modulus is denoted by

with real and imaginary components E′(ω) and E″(ω), called the storage and loss moduli, respectively. Furthermore, the storage and loss moduli of equation (2) are related to the mechanical element values by the Prony series


In this case, the parameter of δ deserves special attention because it has an important impact on the value of indentation rolling resistance by way of loss factor tan(δ). In this case, the loss factor tan(δ) is defined by

In general, the mechanical properties, storage and loss moduli, are usually measured dynamically using a dynamic mechanical analyzer (DMA) and also by testing in a pure shear mode, and tests are performed in a cyclic mode. In this article, a specimen of the rubber material taken from the backing of a typical belt material is shown in Figure 2.
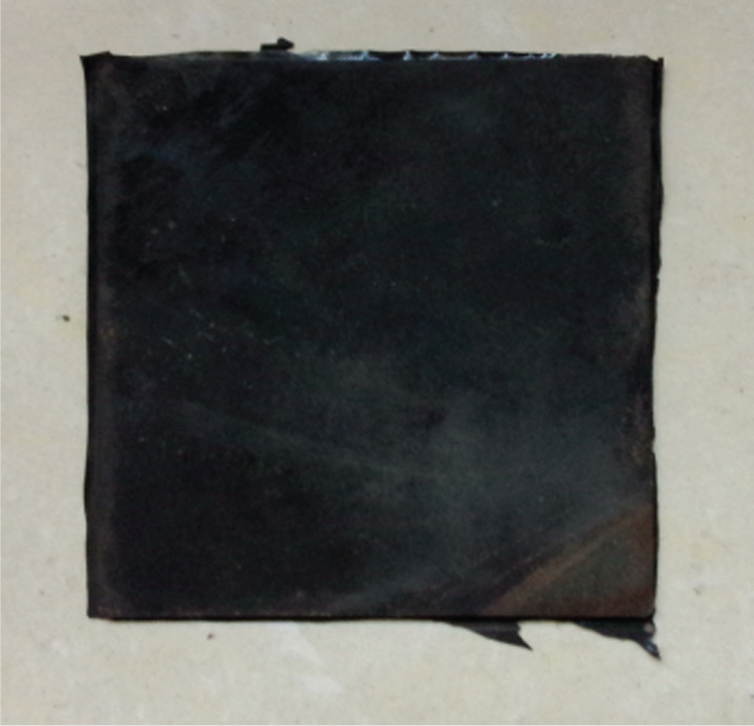
Specimen of the rubber material.
Indentation resistance model
Due to the idlers are generally made of a relatively hard material, such as steel, compared with the much softer material of the backing material as shown in Figure 3, the belt will cause indentation on the contact region between idlers and belt. Furthermore, in virtue of viscoelastic property, when the belt is moving over the idlers, the contact area will cause an asymmetric indentation about the center of idler resulting in an asymmetric pressure distribution between idlers and belt. It produces the indentation rolling resistance of belt as shown in Figure 4.

Stationary idler and belt.

Geometric model of stationary idler and belt versus geometric model of motioning idler and belt.
From Figure 4, it can be seen that when idlers are in stationary state, the contact area is symmetric and contact length is 2a0 ; however, once idler is in motion, the contact area is asymmetric and the absolute value of the first contact point “a” is greater than the absolute value of the point of departure b—/a/ > /−b/.
Generally, a convenient approach to determine the pressure distribution at any point of the contact area is to assume that the backing material can be modeled by one-dimensional Winkler foundation model (see Figure 5). The viscoelastic foundation of depth h rests on a rigid base and is compressed by the rigid idler. Because of the Winkler foundation model, it implies that shear between adjacent elements of the model is ignored. What is more, if the indentation depth h1 is small compared to the thickness of the backing material h, the one-dimensional Winkler foundation model can be applied to approximate the deformation of the backing material due to the indentation of the idler.

Winkler foundation model.
In order to discuss the indentation resistance, the authors first study the relationship between the stationary idler and belt. When idlers are in stationary state, the contact area is symmetric as shown in Figure 4.
Generally, compared to the idler radius R, the maximum indentation depth h0
is very small, and h represents the thickness of the backing material. The contact length between belt and idler is 2a0
and symmetric with Y-axis, when belt is in stationary state (
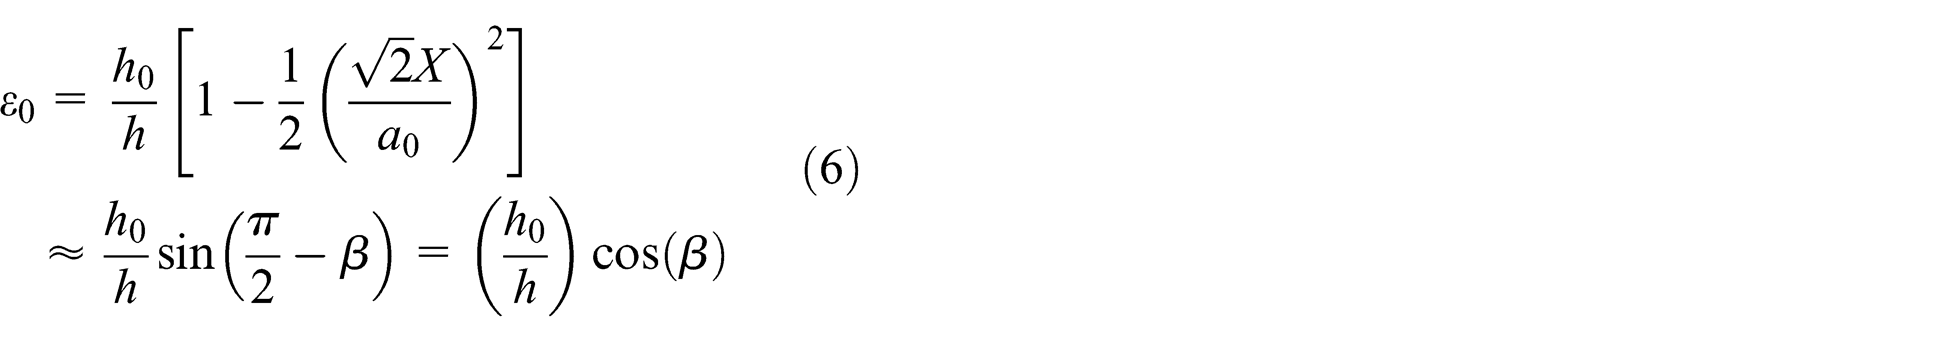
The indentation amount at a point X on the surface of the idler is an approximated parabola as follows

Hence, the compressional strain of the backing material at the coordinate X, modeled as a Winkler foundation through the backing, is as follows

From equation (1), Ψ(0) = E 1 + E 2, the compressional stress between idler and belt is as follows

At equilibrium, the vertical load Fv and the resultant of the stress distribution must be in balance such that
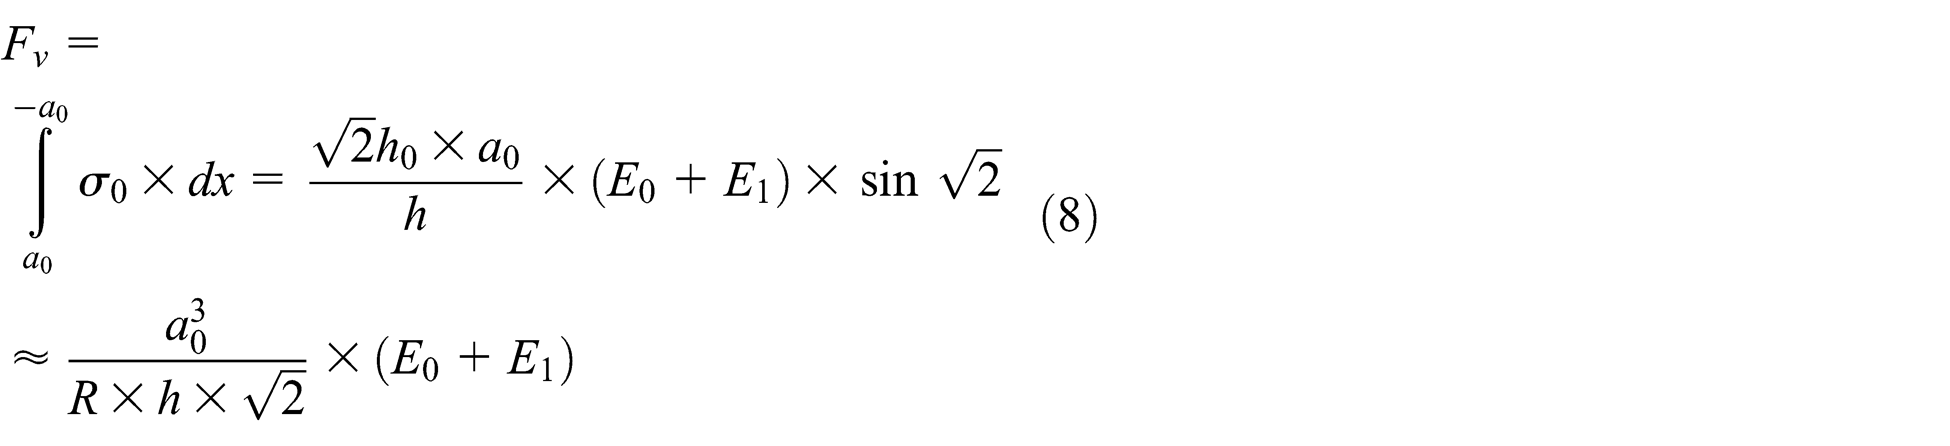
There are following equations as shown

When the belt backing is passing over an idler at uniform speed v as shown in Figure 4 (in practice, the speed of belt often varies from 0.1 to 10 m/s), the contact length between belt and idler is asymmetric of the Y-axis resulting in asymmetric stress distribution. Finally, the asymmetric stress distribution causes the indentation rolling resistance in the horizontal direction.
Generally, the contact length (a + b), both the point of first contact “a” and the point of departure “b,” is determined by the load between belt and idler. What is more, for a given belt speed v, the relationship between belt speed v and angular frequency ω is taken to be as follows

When the belt is in motion, the compressional strain of the backing material at the coordinate X is as follows and h1 is the maximum indentation depth of the backing material, when belt is in motion


At a constant speed, the deformation process of backing is in the essentially steady state with respect to the Eulerian coordinate X = a − vt, where t denotes the time and a the point of contact of the belt and idler (X is fixed with respect to the idler but not rotating with it). Using the translating coordinate speed relationship which is shown as follows

the compressional strain of an arbitrary point on the backing material (equation (9)) may be expressed as a function of t as follows

As for a linear viscoelastic material and a one-dimensional state of stress, the stress response function for a prescribed strain history is as follows

Applying the Winkler foundation and the three-parameter Maxwell model, with the help of equations (1), (9), and (10) and the following equations

The compressional stress for an arbitrary fixed point in the contact area may be expressed as a function of t as follows
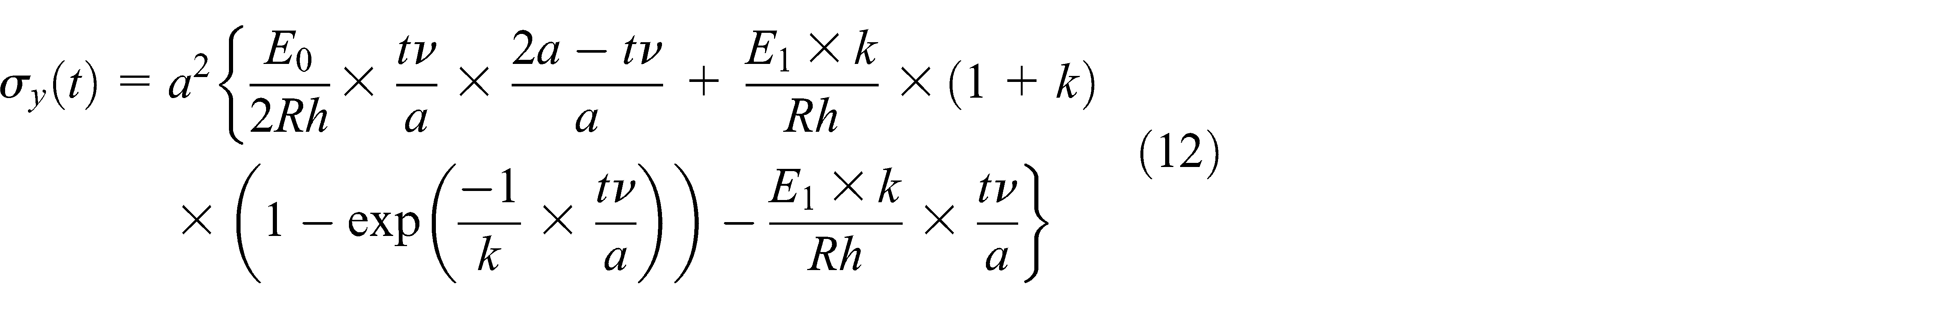
Using the transformation t = (a − X)/v, the compressional stress of equation (11) can be expressed as a function of X as follows that yields the stress distribution between idler and belt backing
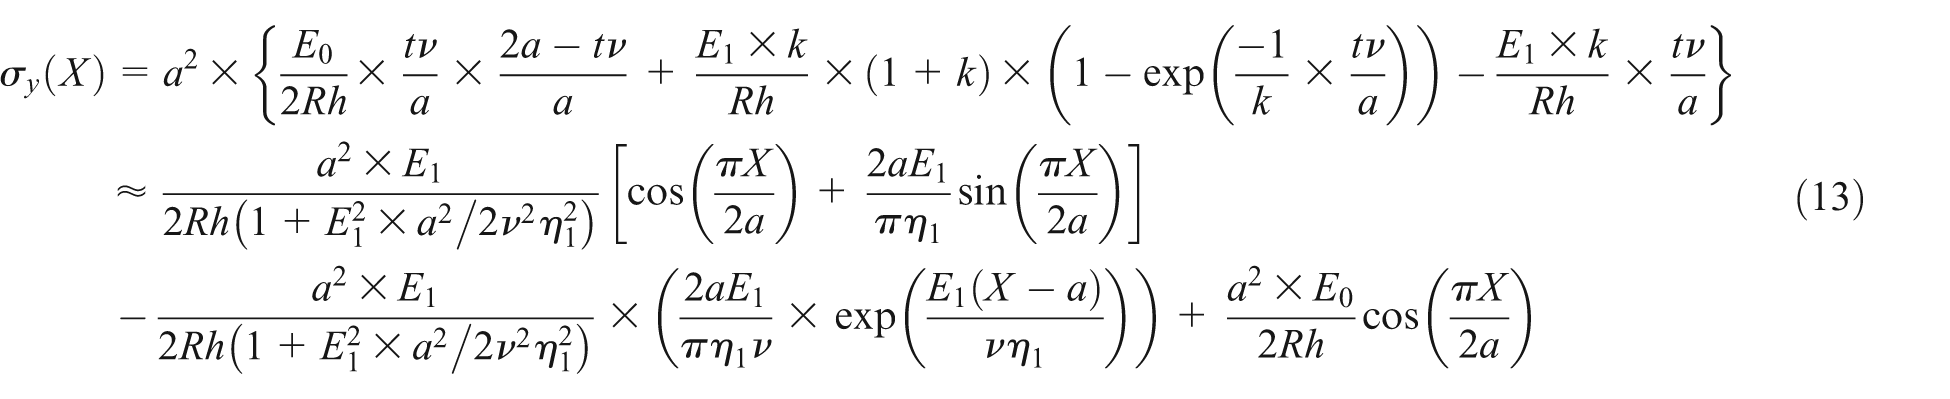

Now, introducing the nondimensional length ζ = b/a, from Figure 4, it is not been ignored that the stress of equation (13) must be equated to zero at X = −b as follows
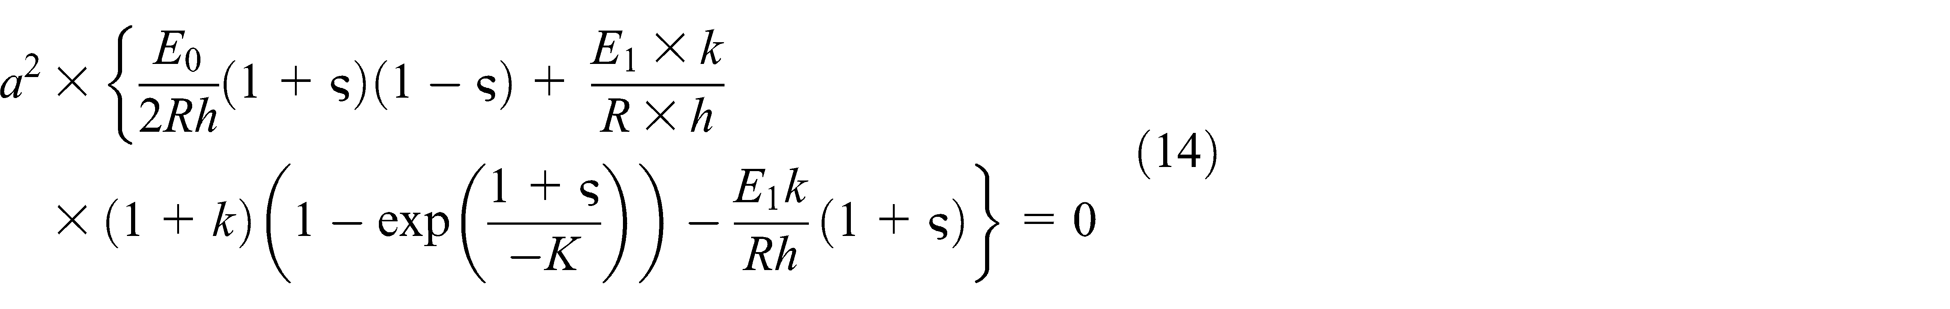
When the belt moves at a constant speed v, the vertical load Fv is constant for a stationary moving belt leading to the fact that the load Fv and the resultant of the stress distribution σ(X) must also be in balance. Therefore

Then, for given material parameters E0, E1 , and η1 and belt system parameters Fv, R, h, B, and v, in order to acquire the value of indentation rolling resistance, the values of a and b which must satisfy equations (14) and (15) with the load Fv should be computed first. The simultaneous solution is readily accomplished by intelligent optimization algorithm as shown in Figure 6.

Intelligent optimization algorithm.
Following this intelligent optimization algorithm to determine an accurate value of ζ = b/a, a, and b, the moment M of the stress distribution about the center of the idler is as follows

Then the indentation rolling resistance Fh is as follows

where R is the idler radius; (a + b) is the contact length; E 0, E 1, and η 1 are the viscoelastic parameters of the backing material; and h is the thickness of the backing material, all have an effect on the indentation rolling resistance. As for the test belt which is the fabric belt, the viscoelastic parameters 20 are shown as follows: E 0 = 7 × 10⁶ Pa, E 1 = 2.5 × 10⁸ Pa, and η 1 = 1875 N s/m2 (Table 1).
Basic parameter of the test piece.

Analysis for theoretical results
As mentioned above, there is a close relationship between rolling resistance and belt system parameters Fv , R, h, B, and v. In this article, the authors mainly concentrate on the influence between the rolling resistance and load Fv and belt speed v, thickness of the backing material h, and idler radius R.
In general, the speed of belt varies from 0.1 to 10 m/s; meanwhile, the variation range of vertical load Fv is from 0 to 2500 N/m. Therefore, the authors apply some representative belt speed points to the test belt (1, 2, 3, 4, 5, 6, 7, 8, 9, and 10 m/s) under some fixed vertical loads Fv (500, 1000, 1500, 2000, and 2500 N/m), idler diameters (89, 108, and 133 mm), thicknesses of backing rubber (2, 4, and 6 mm).
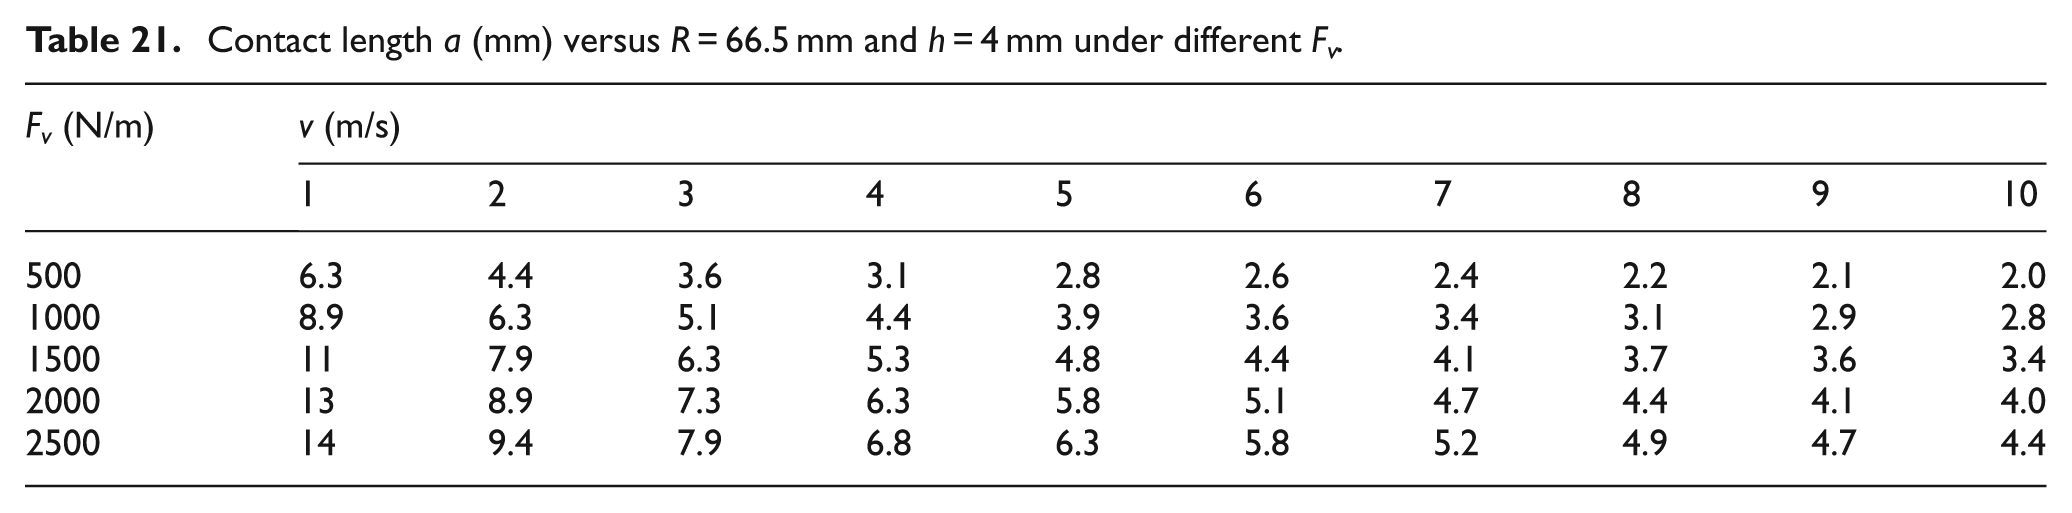
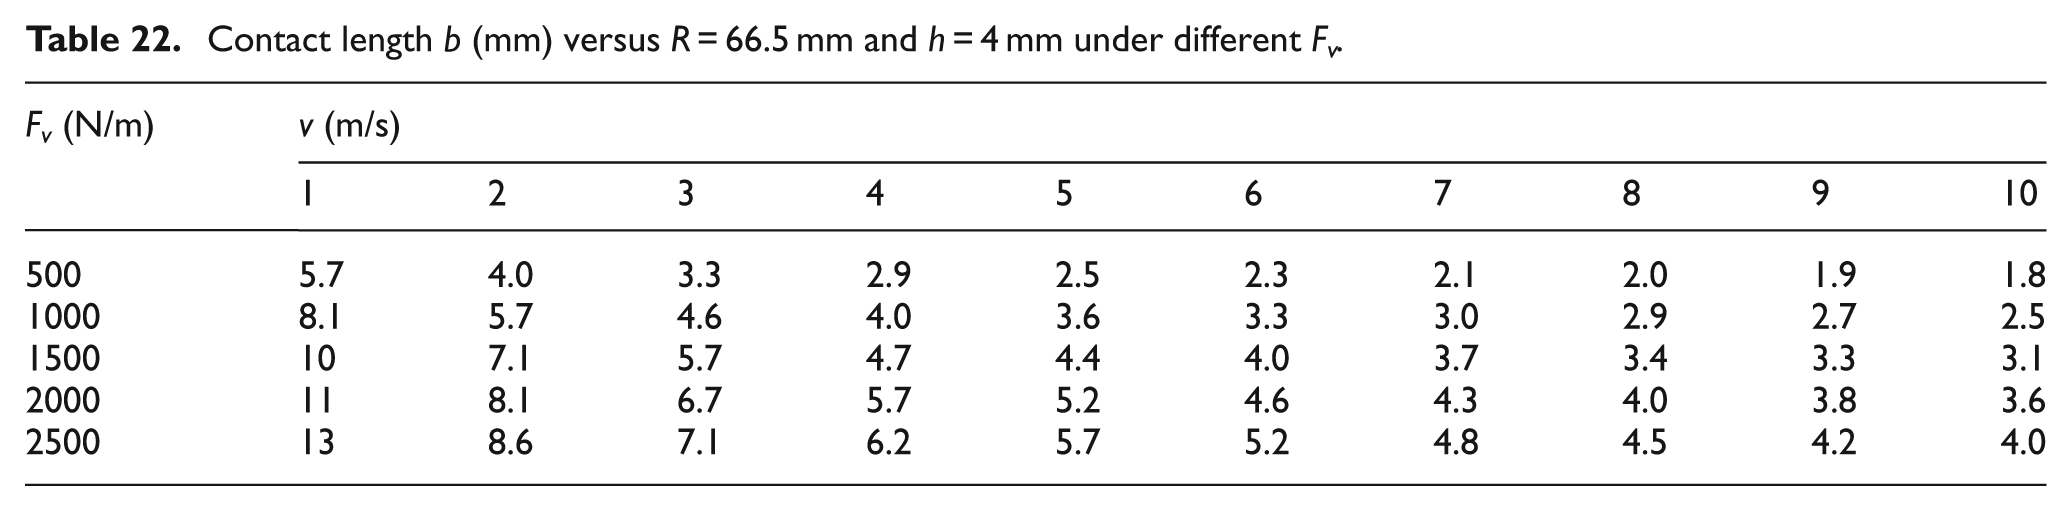
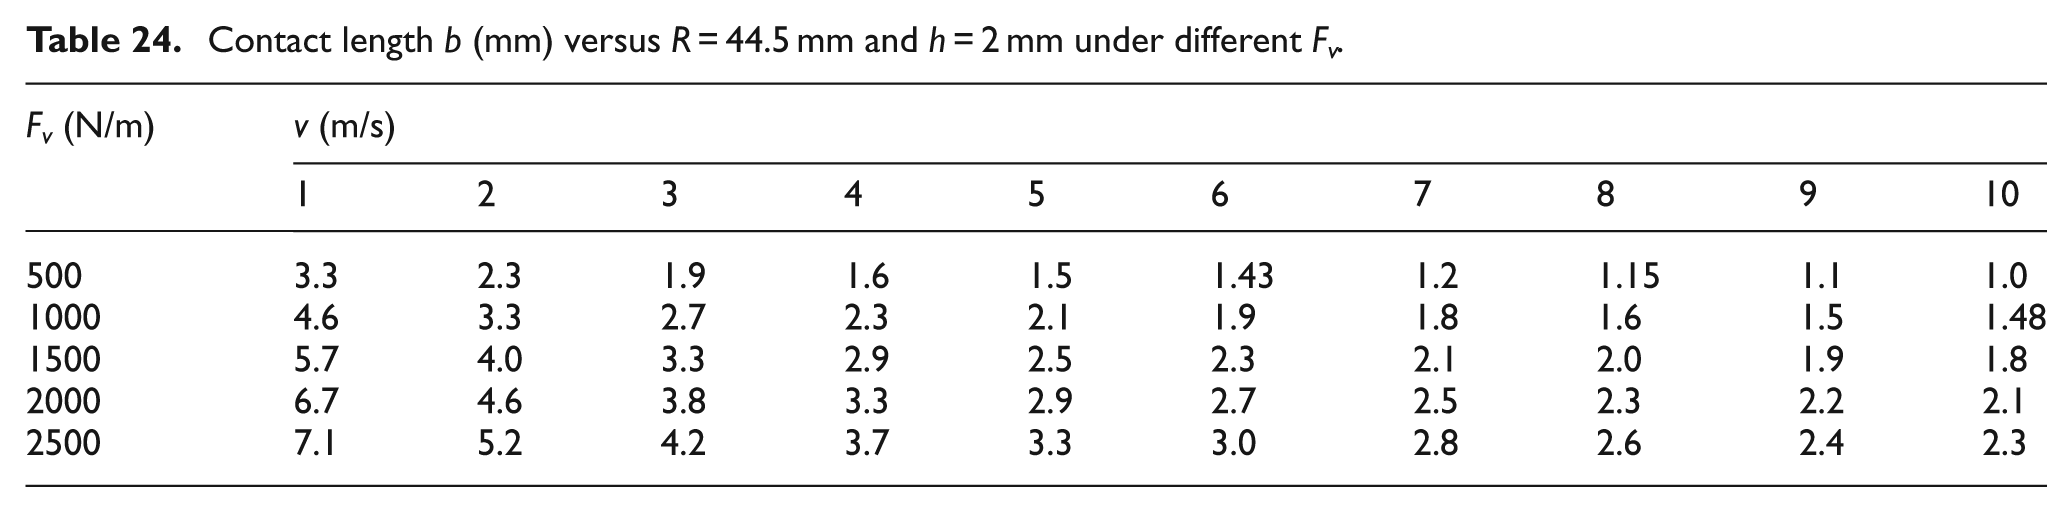
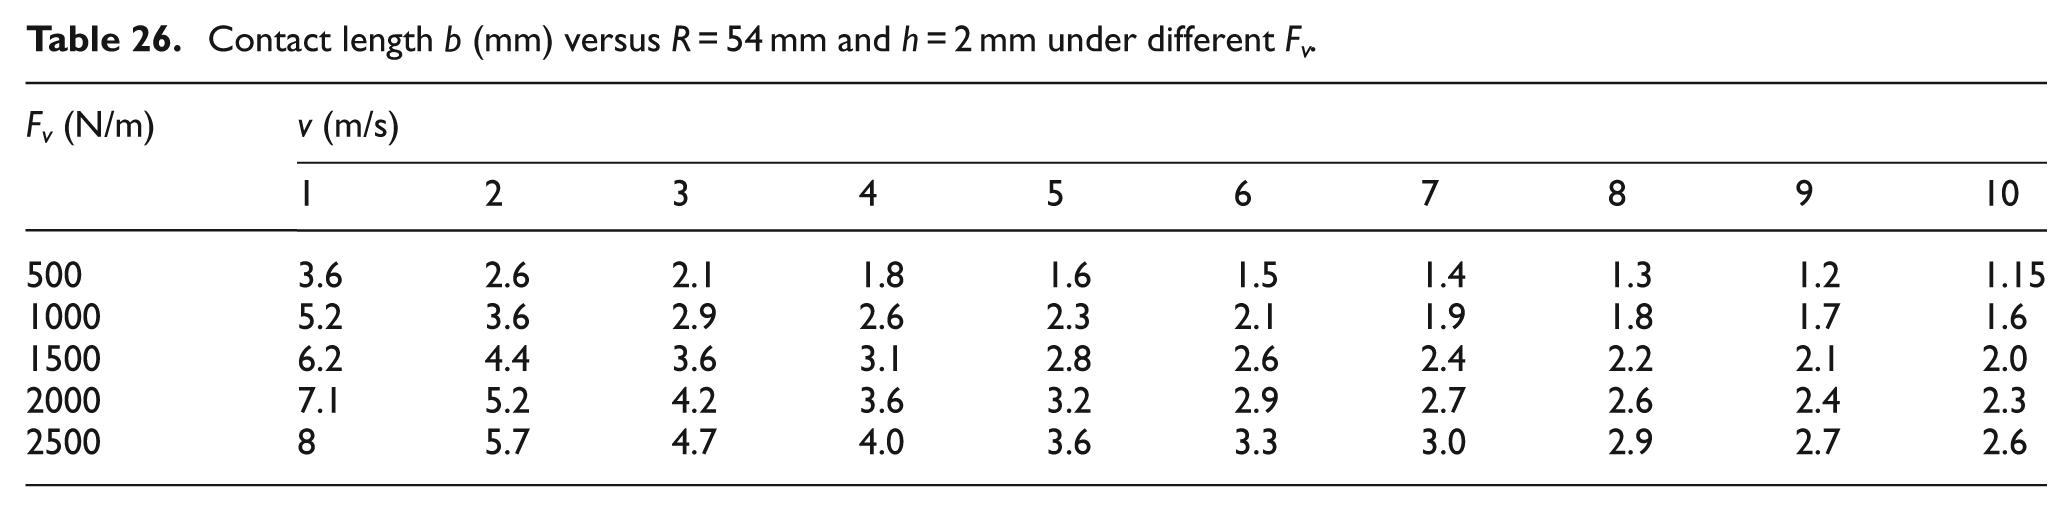
Tables 2–28 show the contact length a + b under different conditions; what is more, these values lay a foundation of the following research in this article.
Contact length a + b (mm) versus R = 44.5 mm and h = 6 mm under different Fv .

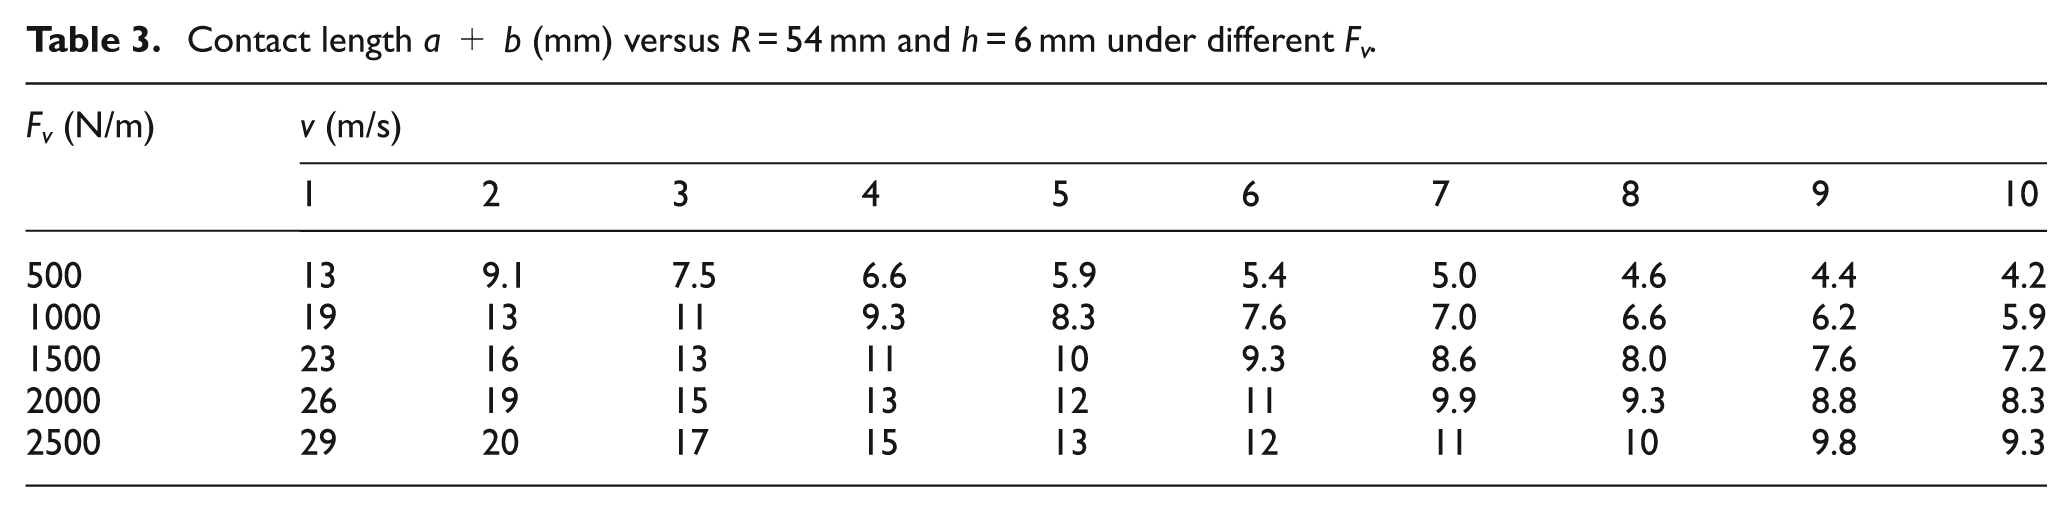
Contact length a + b (mm) versus R = 54 mm and h = 6 mm under different Fv .
Contact length a + b (mm) versus R = 66.5 mm and h = 6 mm under different Fv .

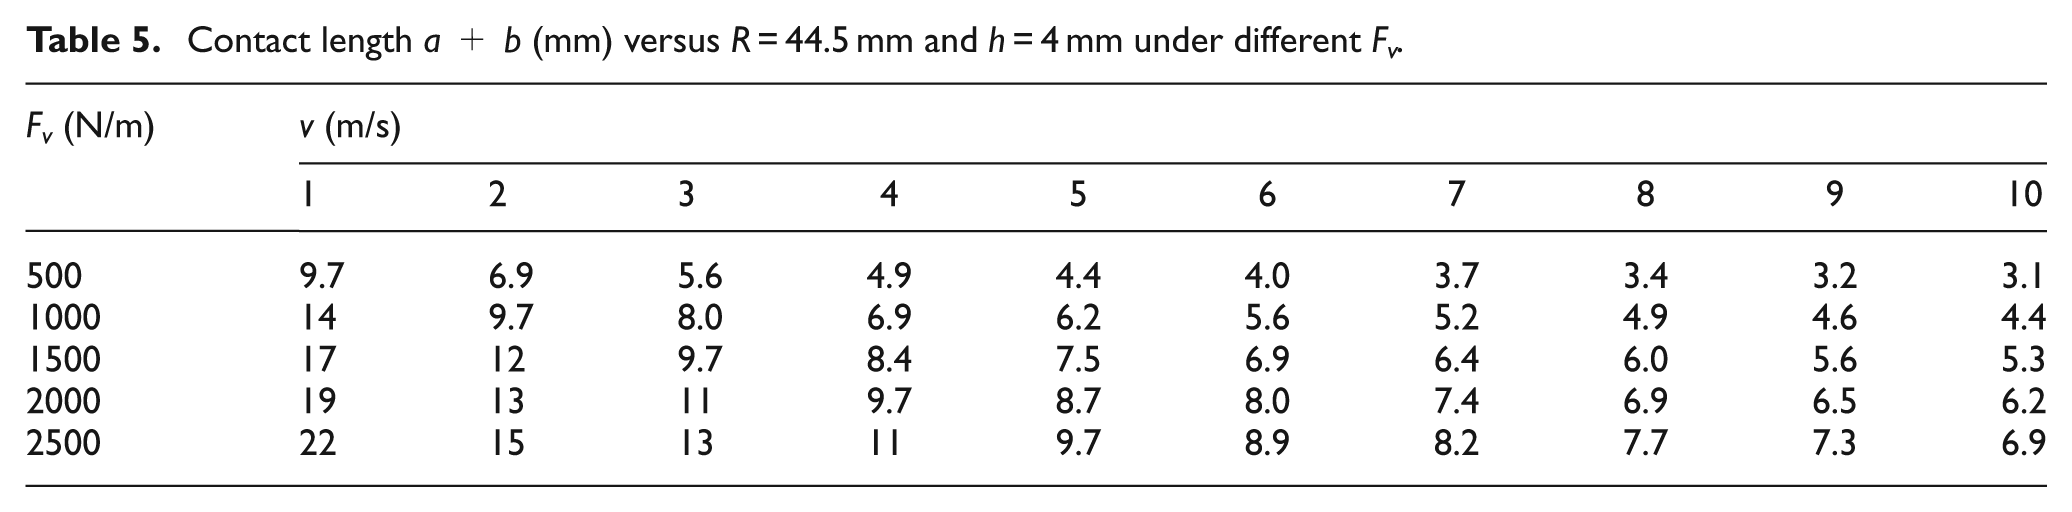
Contact length a + b (mm) versus R = 44.5 mm and h = 4 mm under different Fv .
Contact length a + b (mm) versus R = 54 mm and h = 4 mm under different Fv .

Contact length a + b (mm) versus R = 66.5 mm and h = 4 mm under different Fv .

Contact length a + b (mm) versus R = 44.5 mm and h = 2 mm under different Fv .
Contact length a + b (mm) versus R = 54 mm and h = 2 mm under different Fv .
Contact length a + b (mm) versus R = 66.5 mm and h = 2 mm under different Fv .

Contact length a (mm) versus R = 44.5 mm and h = 6 mm under different Fv .

Contact length b (mm) versus R = 44.5 mm and h = 6 mm under different Fv .

Contact length a (mm) versus R = 54 mm and h = 6 mm under different Fv .

Contact length b (mm) versus R = 54 mm and h = 6 mm under different Fv .
Contact length a (mm) versus R = 66.5 mm and h = 6 mm under different Fv .

Contact length b (mm) versus R = 66.5 mm and h = 6 mm under different Fv .
Contact length a (mm) versus R = 44.5 mm and h = 4 mm under different Fv .

Contact length b (mm) versus R = 44.5 mm and h = 4 mm under different Fv .

Contact length a (mm) versus R = 54 mm and h = 4 mm under different Fv .

Contact length b (mm) versus R = 54 mm and h = 4 mm under different Fv .

Contact length a (mm) versus R = 66.5 mm and h = 4 mm under different Fv .
Contact length b (mm) versus R = 66.5 mm and h = 4 mm under different Fv .
Contact length a (mm) versus R = 44.5 mm and h = 2 mm under different Fv .

Contact length b (mm) versus R = 44.5 mm and h = 2 mm under different Fv .
Contact length a (mm) versus R = 54 mm and h = 2 mm under different Fv .

Contact length b (mm) versus R = 54 mm and h = 2 mm under different Fv .
Contact length a (mm) versus R = 66.5 mm and h = 2 mm under different Fv .

Contact length b (mm) versus R = 66.5 mm and h = 2 mm under different Fv .

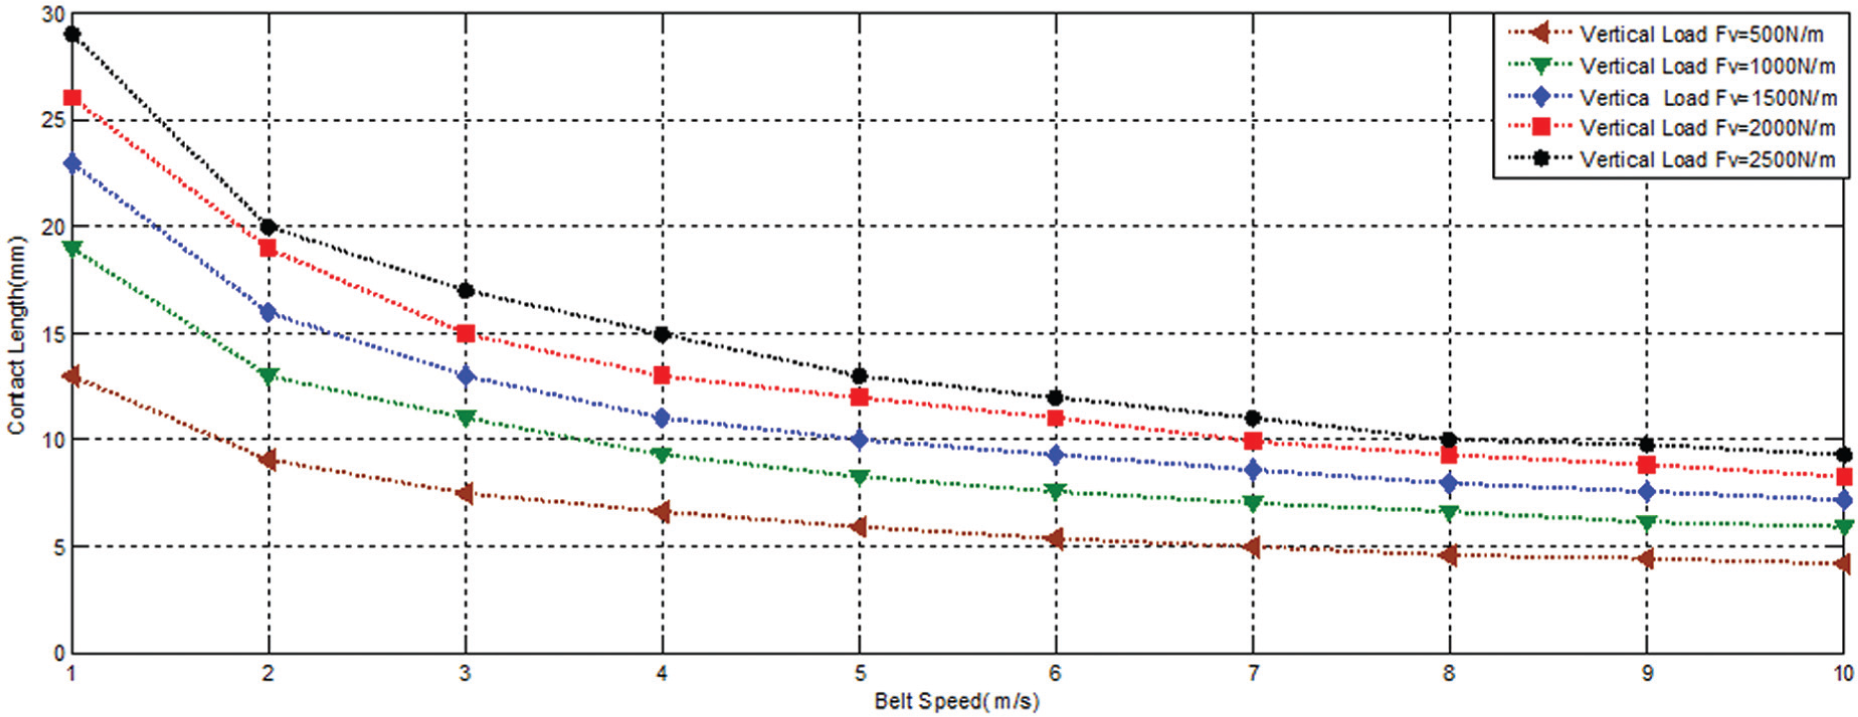
It can be seen from Figures 7–10, the contact length a + b decreases nonlinearly with increasing belt speed v. However, there is a phenomenon worthy of attention that while the value of belt speed is in the lower level, the contact length decreases rapidly with increasing belt speed. As for this style of test belt, the threshold of belt speed v is 6 m/s. Furthermore, from Figures 7, 9, and 10, it can be inferred that once the value of viscoelastic property of the backing material is established, the threshold of belt speed is not correlated with idler radius R and thickness of the backing material h. It means that when we consider the relationship between indentation rolling resistance, by way of contact length a + b and speed v, we should not ignore the effect of viscoelastic property.
Contact length a + b (mm) versus belt speed v at a vertical load of 500, 1000, 1500, 2000, and 2500 N/m under constant values of R = 44.5 mm and h = 6 mm.

Contact length a + b (mm) versus belt speed v at a vertical load of 500, 1000, 1500, 2000, and 2500 N/m under constant values of R = 54 mm and h = 6 mm.

Contact length a + b (mm) versus belt speed v at a vertical load of 500, 1000, 1500, 2000, and 2500 N/m under constant values of R = 66.5 mm and h = 6 mm.

Contact length a + b (mm) versus belt speed v at a vertical load of 500, 1000, 1500, 2000, and 2500 N/m under constant values of R = 54 mm and h = 4 mm.
From Figures 11–13, the contact length a + b increases linearly (a + b = k·Fv + c) with increasing vertical load Fv. What is more, the linear regular is applicable to a variety of circumstances which is not correlated with idler radius R, thickness of the backing material h, and belt speed v.

Contact length a + b (mm) versus belt speed v at a vertical load of 500, 1000, 1500, 2000, and 2500 N/m under constant values of R = 66.5 mm and h = 2 mm.

Contact length a + b (mm) versus vertical load Fv at a belt speed of 2, 4, 6, 8, and 10 m/s under constant values of R = 44.5 mm and h = 6 mm.

Contact length a + b (mm) versus vertical load Fv at a belt speed of 2, 4, 6, 8, and 10 m/s under constant values of R = 54 mm and h = 4 mm.
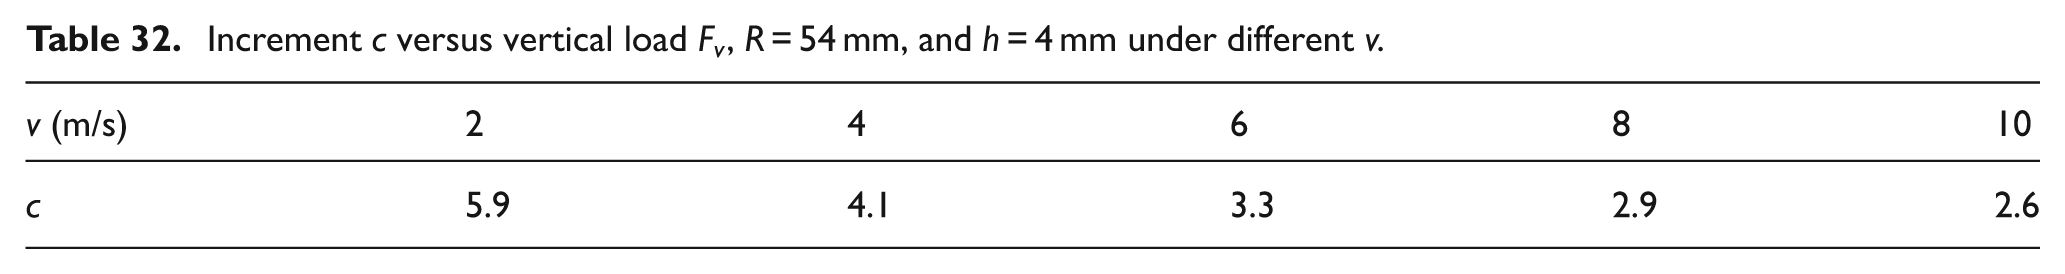
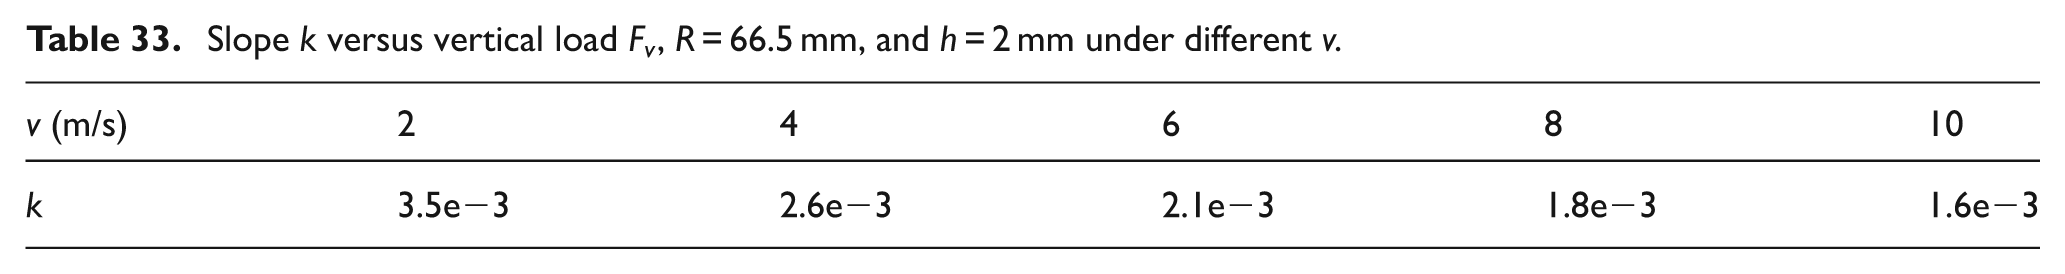
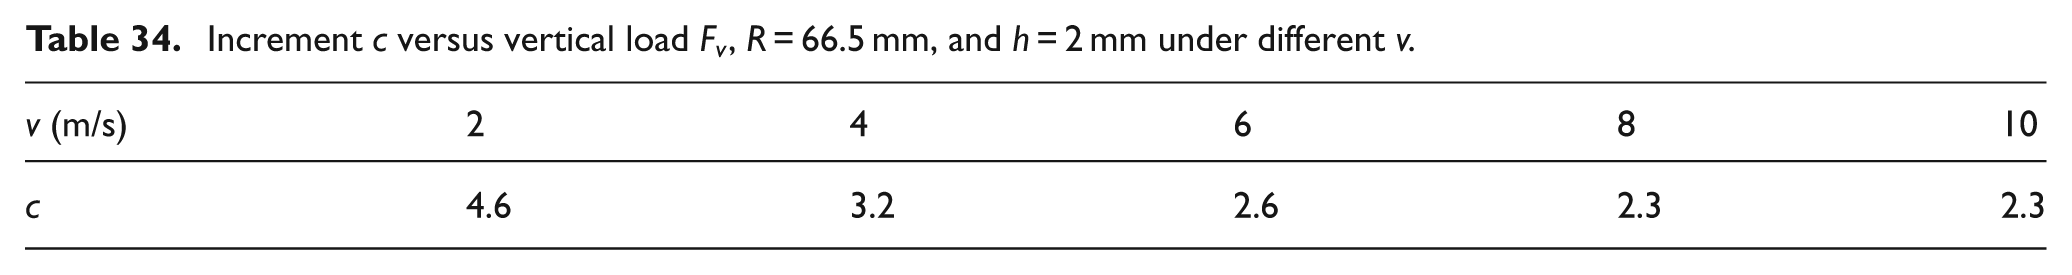
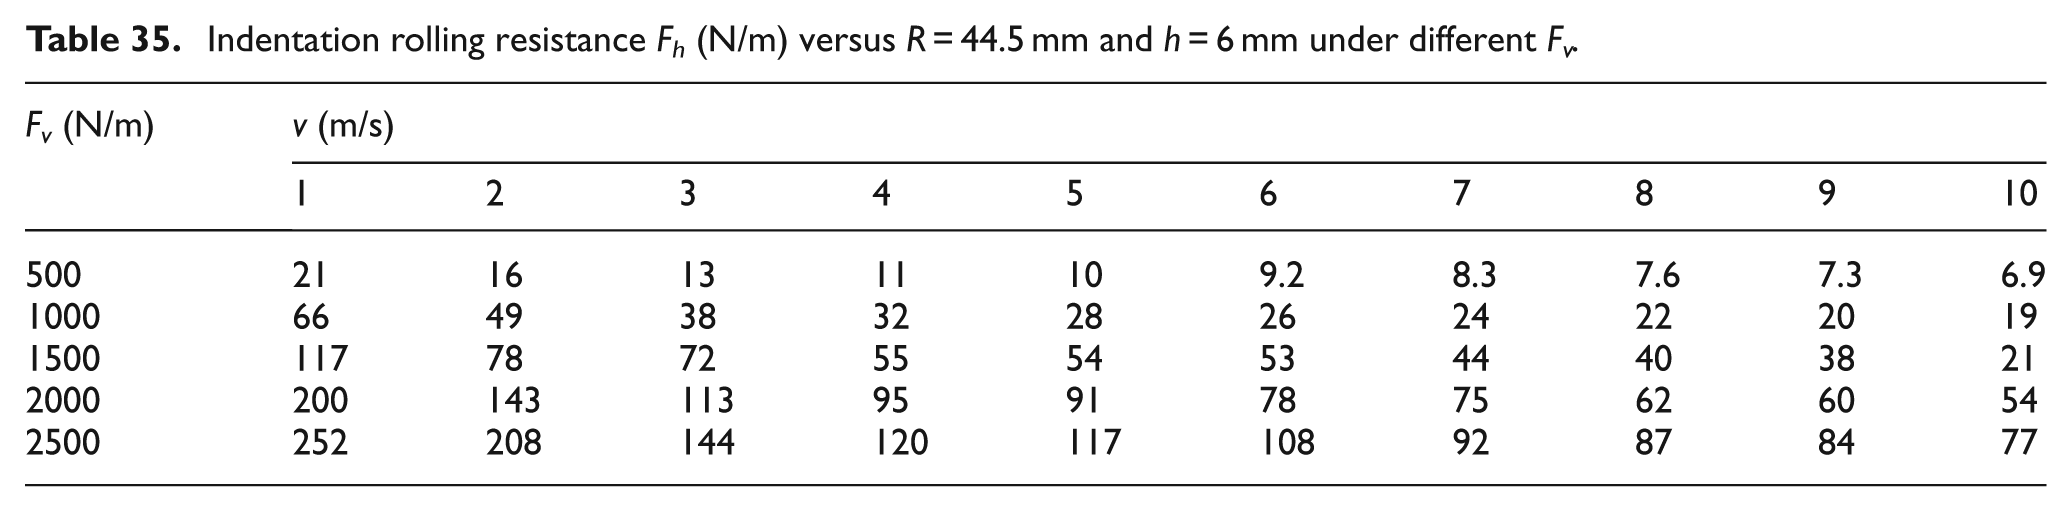
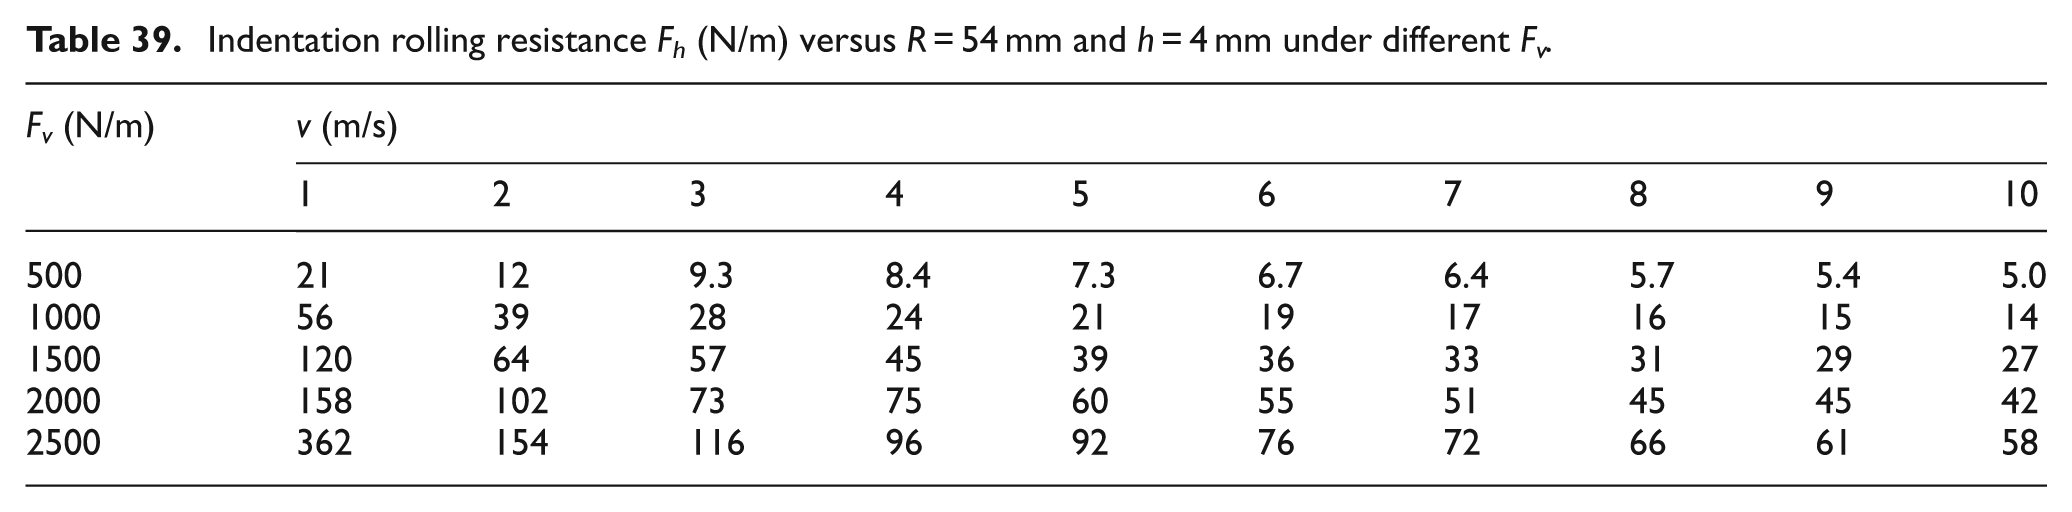
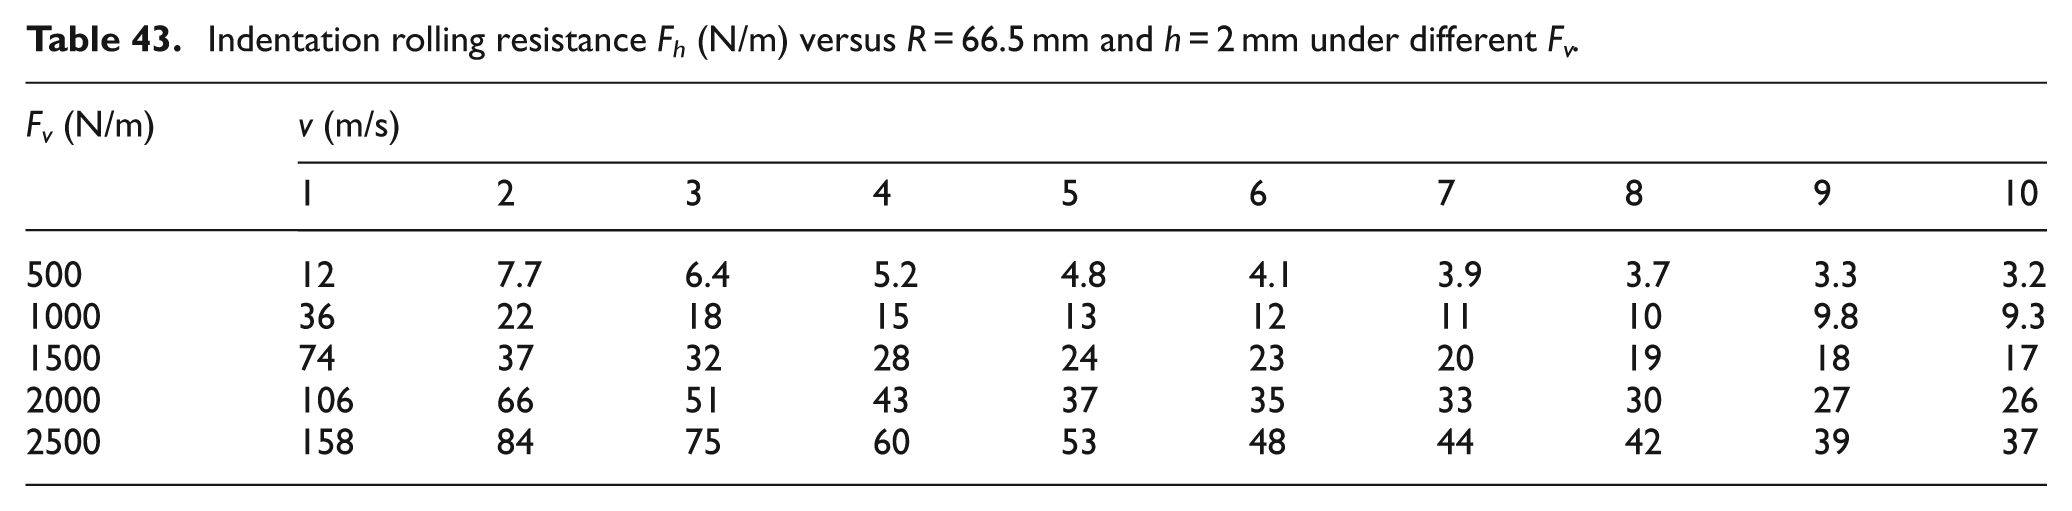
From Tables 29–34, it can be seen that the value of slope k and increment c decreases with increasing speed v. It means that the effect of vertical load Fv on the indentation rolling resistance will be weakened with increasing speed v (Tables 35–43). It can also be inferred that when we investigated the influence of vertical load Fv on rolling resistance, the belt speed also played a role in it.
Slope k versus vertical load Fv , R = 44.5 mm, and h = 6 mm under different v.

Increment c versus vertical load Fv , R = 44.5 mm, and h = 6 mm under different v.

Slope k versus vertical load Fv , R = 54 mm, and h = 4 mm under different v.

Increment c versus vertical load Fv , R = 54 mm, and h = 4 mm under different v.
Slope k versus vertical load Fv , R = 66.5 mm, and h = 2 mm under different v.
Increment c versus vertical load Fv , R = 66.5 mm, and h = 2 mm under different v.
Indentation rolling resistance Fh (N/m) versus R = 44.5 mm and h = 6 mm under different Fv .
Indentation rolling resistance Fh (N/m) versus R = 54 mm and h = 6 mm under different Fv .

Indentation rolling resistance Fh (N/m) versus R = 66.5 mm and h = 6 mm under different Fv .

Indentation rolling resistance Fh (N/m) versus R = 44.5 mm and h = 4 mm under different Fv .

Indentation rolling resistance Fh (N/m) versus R = 54 mm and h = 4 mm under different Fv .
Indentation rolling resistance Fh (N/m) versus R = 66.5 mm and h = 4 mm under different Fv .

Indentation rolling resistance Fh (N/m) versus R = 44.5 mm and h = 2 mm under different Fv .

Indentation rolling resistance Fh (N/m) versus R = 54 mm and h = 2 mm under different Fv .

Indentation rolling resistance Fh (N/m) versus R = 66.5 mm and h = 2 mm under different Fv .
From Figure 14, it can be seen that the contact length a + b and peak value of stress are inversely proportional to the belt speed except for belt speed v = 10 m/s. What is more, it can be inferred that the pressure profile between idler and belt is comparatively symmetric about the centerline of X = 0 at a belt speed of 2 m/s. However, as the belt speed increases, the stress profile becomes more asymmetric. It is noticeable that a “hump” of the stress forms behind the centerline X = 0.

Contact length a + b (mm) versus vertical load Fv at a belt speed of 2, 4, 6, 8, and 10 m/s under constant values of R = 66.5 mm and h = 2 mm.
From Figures 15–17, it can be inferred that the contact length (a + b) and the peak value of stress are proportional to the vertical load Fv . Furthermore, the greater the value of vertical load, the more asymmetric the stress profile.

Calculated pressure distribution for 44.5 mm under a simulated vertical load of 500 N/m at a belt speed of 2, 4, 6, 8, and 10 m/s.
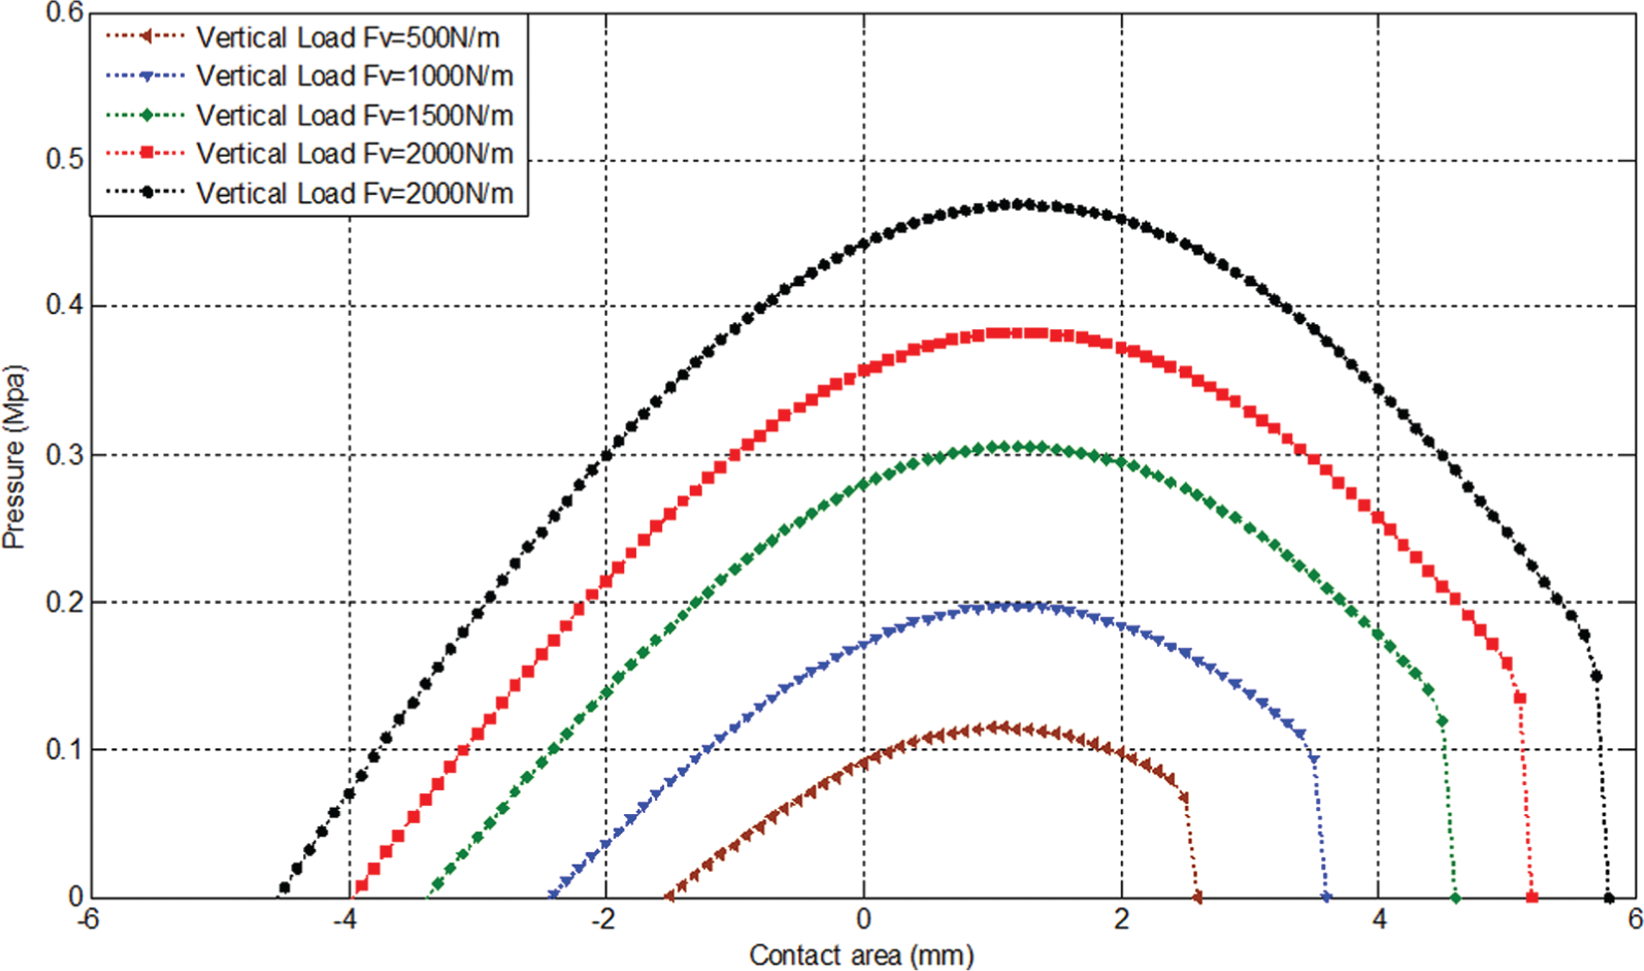
Calculated pressure distribution for 44.5 mm under a simulated belt speed of 2 m/s at a vertical load of 500, 1000, 1500, 2000, and 2500 N/m.

Calculated pressure distribution for 44.5 mm under a simulated belt speed of 6 m/s at a vertical load of 500, 1000, 1500, 2000, and 2500 N/m.
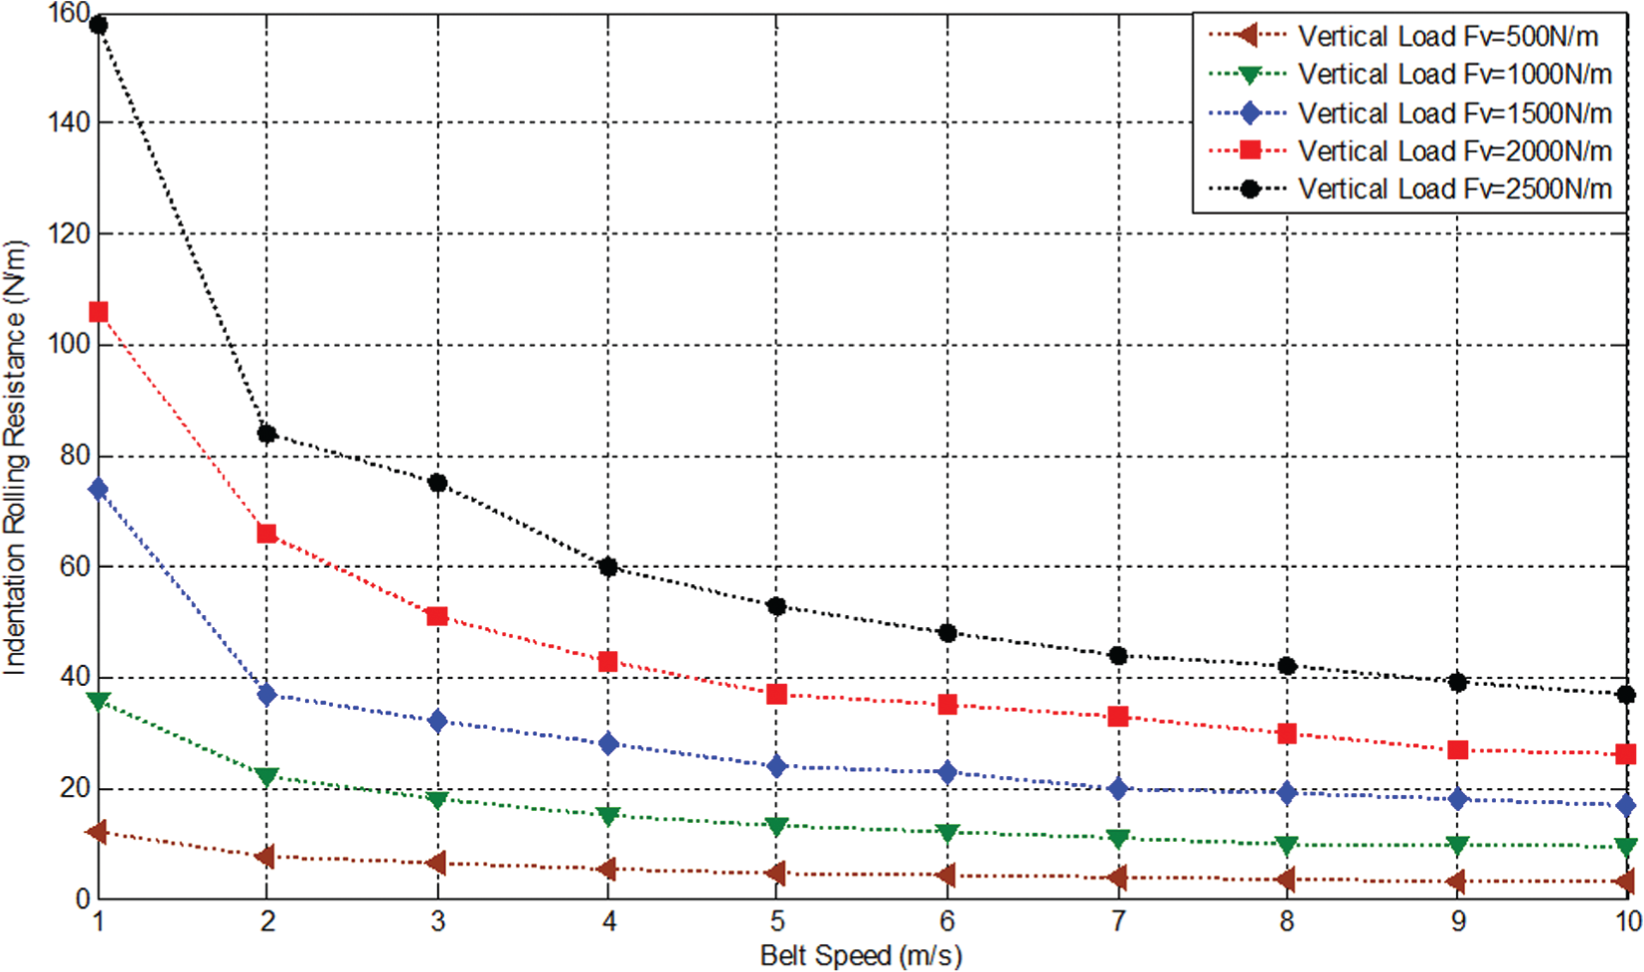
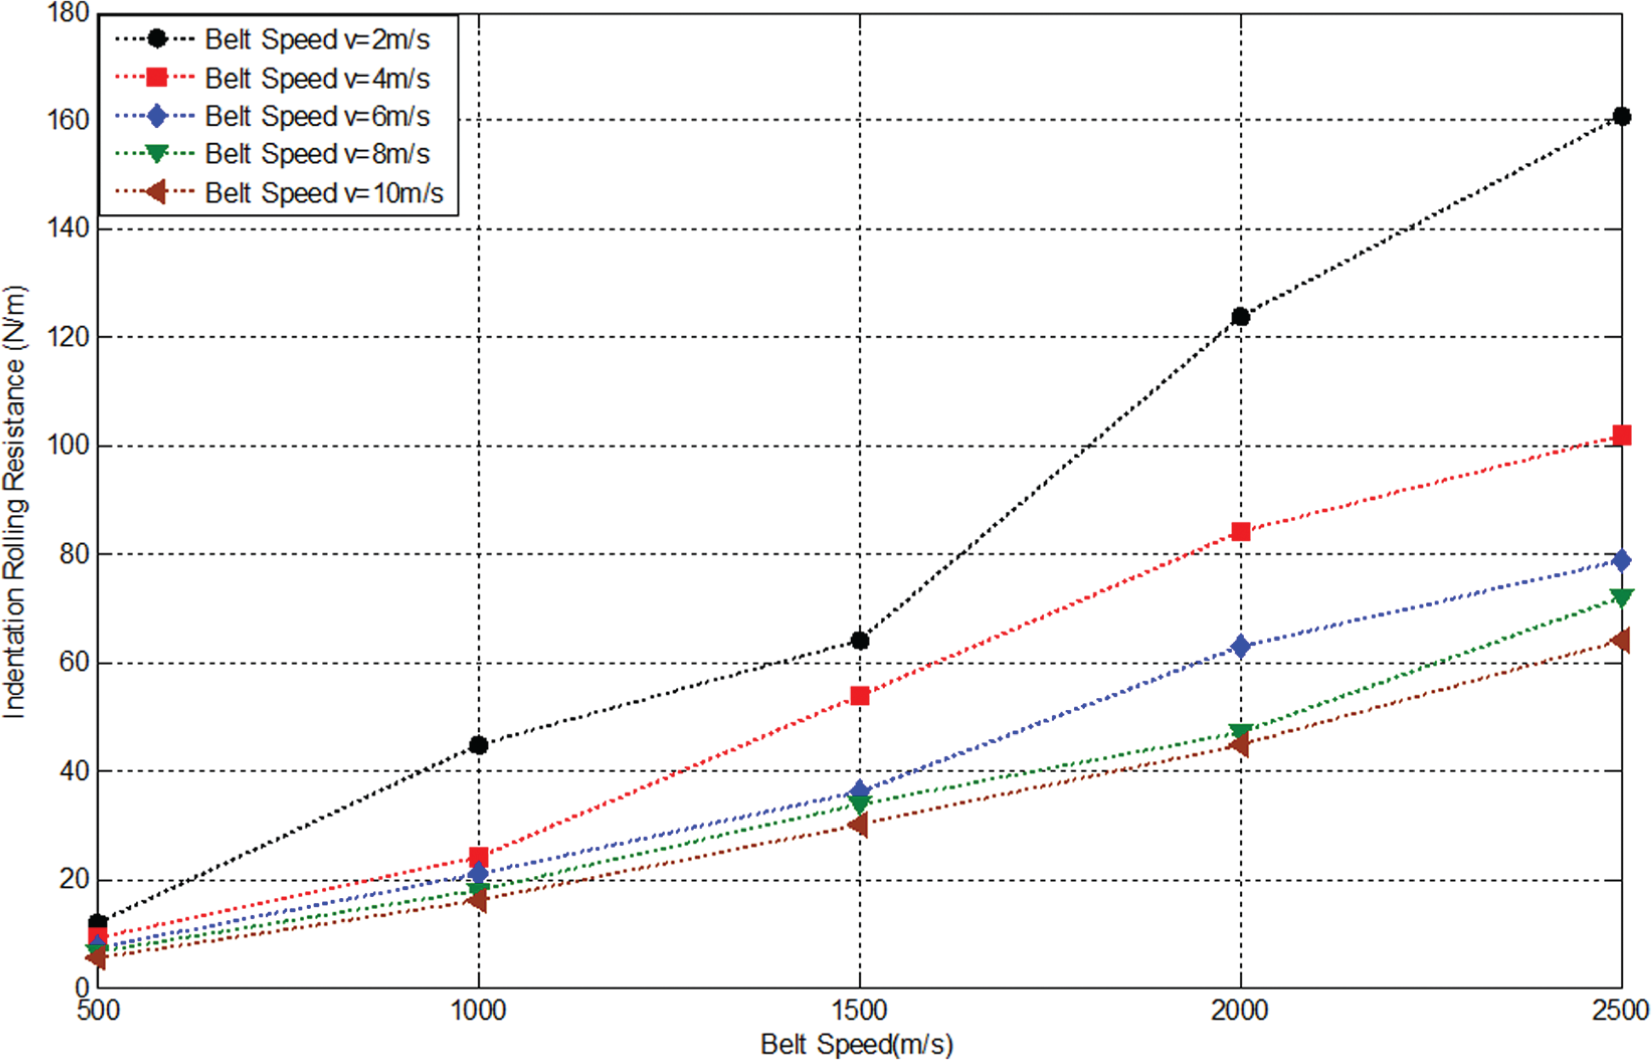
From Figures 18–26, it can be seen that the influence of belt speed v on the indentation rolling resistance Fh is complex. Overall, when the belt speed is less than the threshold (6 m/s), the rolling resistance decreases obviously with an increasing belt speed. Because the indentation rolling resistance is the main resistance, when belt conveyor is in motion, it means that increasing the belt speed is beneficial to reduce indentation rolling resistance resulting in cutting down the energy loss of belt. However, a noteworthy phenomenon is that when the belt speed is above the threshold, the value of indentation rolling resistance plateaus even through the belt speed still increases.

Indentation rolling resistance (N/m) versus belt speed v at a vertical load of 500, 1000, 1500, 2000, and 2500 N/m under constant values of R = 44.5 mm and h = 6 mm.

Indentation rolling resistance (N/m) versus belt speed v at a vertical load of 500, 1000, 1500, 2000, and 2500 N/m under constant values of R = 54 mm and h = 4 mm.
Indentation rolling resistance (N/m) versus belt speed v at a vertical load of 500, 1000, 1500, 2000, and 2500 N/m under constant values of R = 66.5 mm and h = 2 mm.
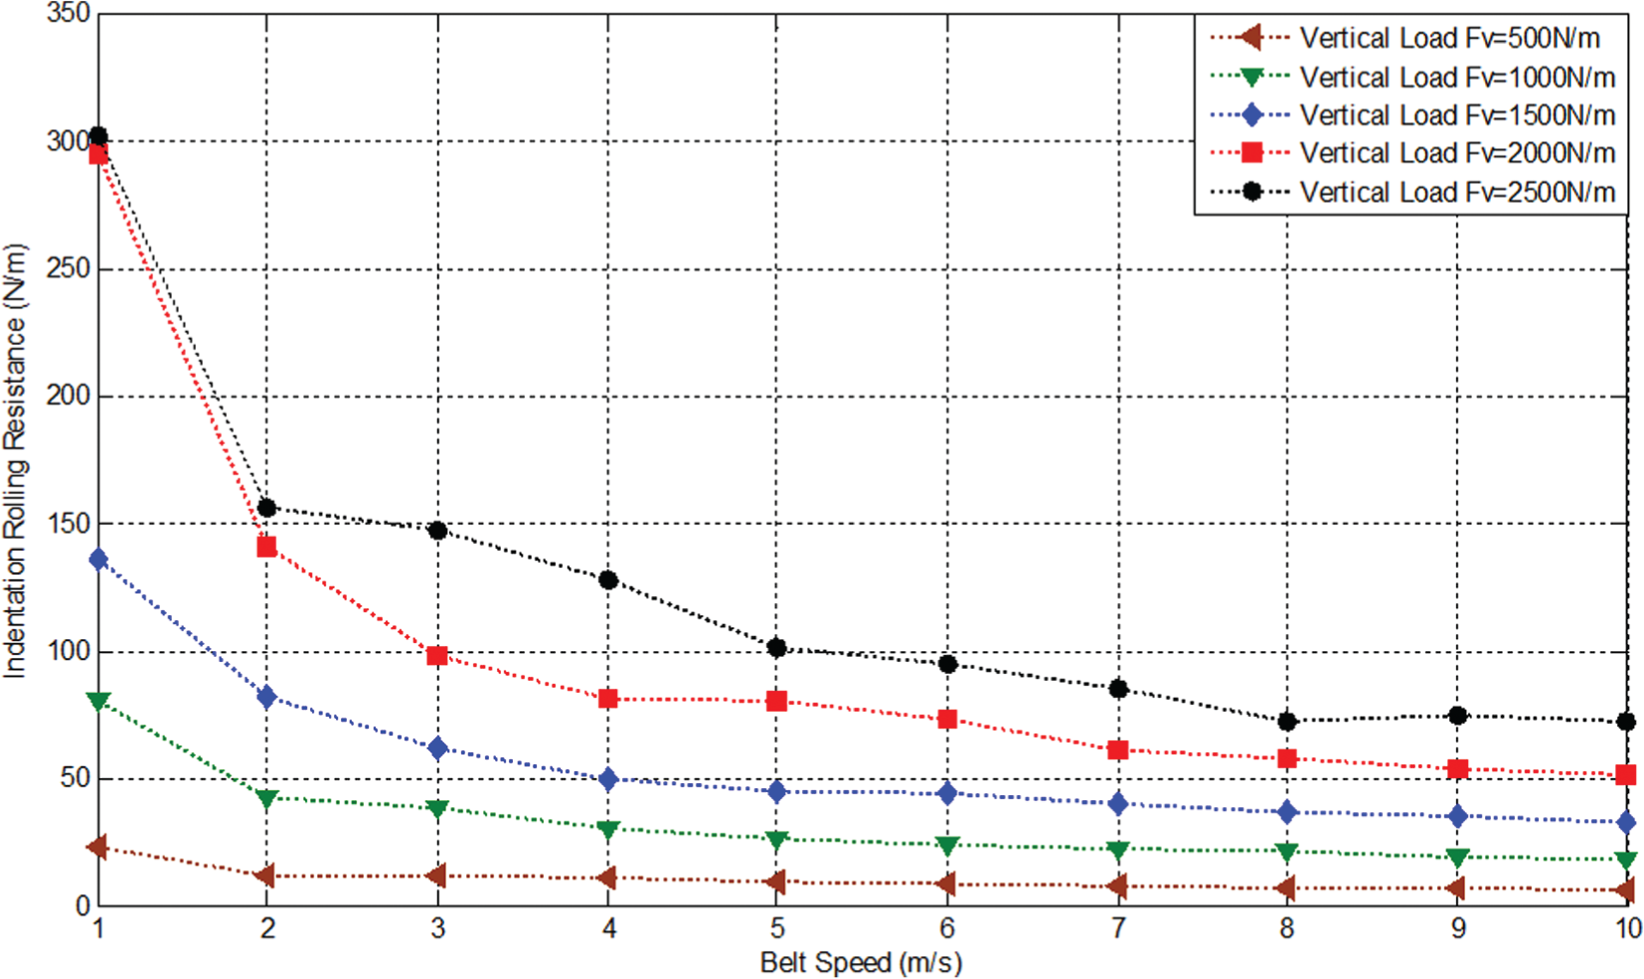
Indentation rolling resistance (N/m) versus belt speed v at a vertical load of 500, 1000, 1500, 2000, and 2500 N/m under constant values of R = 54 mm and h = 6 mm.

Indentation rolling resistance (N/m) versus belt speed v at a vertical load of 500, 1000, 1500, 2000, and 2500 N/m under constant values of R = 66.5 mm and h = 4 mm.

Indentation rolling resistance (N/m) versus belt speed v at a vertical load of 500, 1000, 1500, 2000, and 2500 N/m under constant values of R = 44.5 mm and h = 2 mm.

Indentation rolling resistance (N/m) versus belt speed v at a vertical load of 500, 1000, 1500, 2000, and 2500 N/m under constant values of R = 66.5 mm and h = 6 mm.

Indentation rolling resistance (N/m) versus belt speed v at a vertical load of 500, 1000, 1500, 2000, and 2500 N/m under constant values of R = 44.5 mm and h = 4 mm.

Indentation rolling resistance (N/m) versus belt speed v at a vertical load of 500, 1000, 1500, 2000, and 2500 N/m under constant values of R = 54 mm and h = 2 mm.
From Figures 18–20, it can be seen that once the value of viscoelastic property of the backing material is established, the threshold of belt speed is not correlated with idler radius R and thickness of the backing material h. This phenomenon infers that when we consider the relationship between indentation rolling resistance and belt speed, we should not ignore the effect of viscoelastic property.
What is more, from Figures 18–26, it can be concluded that the effect of belt speed on rolling resistance correlated with the vertical load Fv , when the vertical load was at a lower level, such as 500 N/m, and the effect is very distinct that when belt speed increases from 1 to 2 m/s, the rolling resistance decreases obviously. However, once the vertical load is above the threshold (2000 N/m), even if the belt speed increases from 1 to 10 m/s, the rolling resistance remains unaltered.
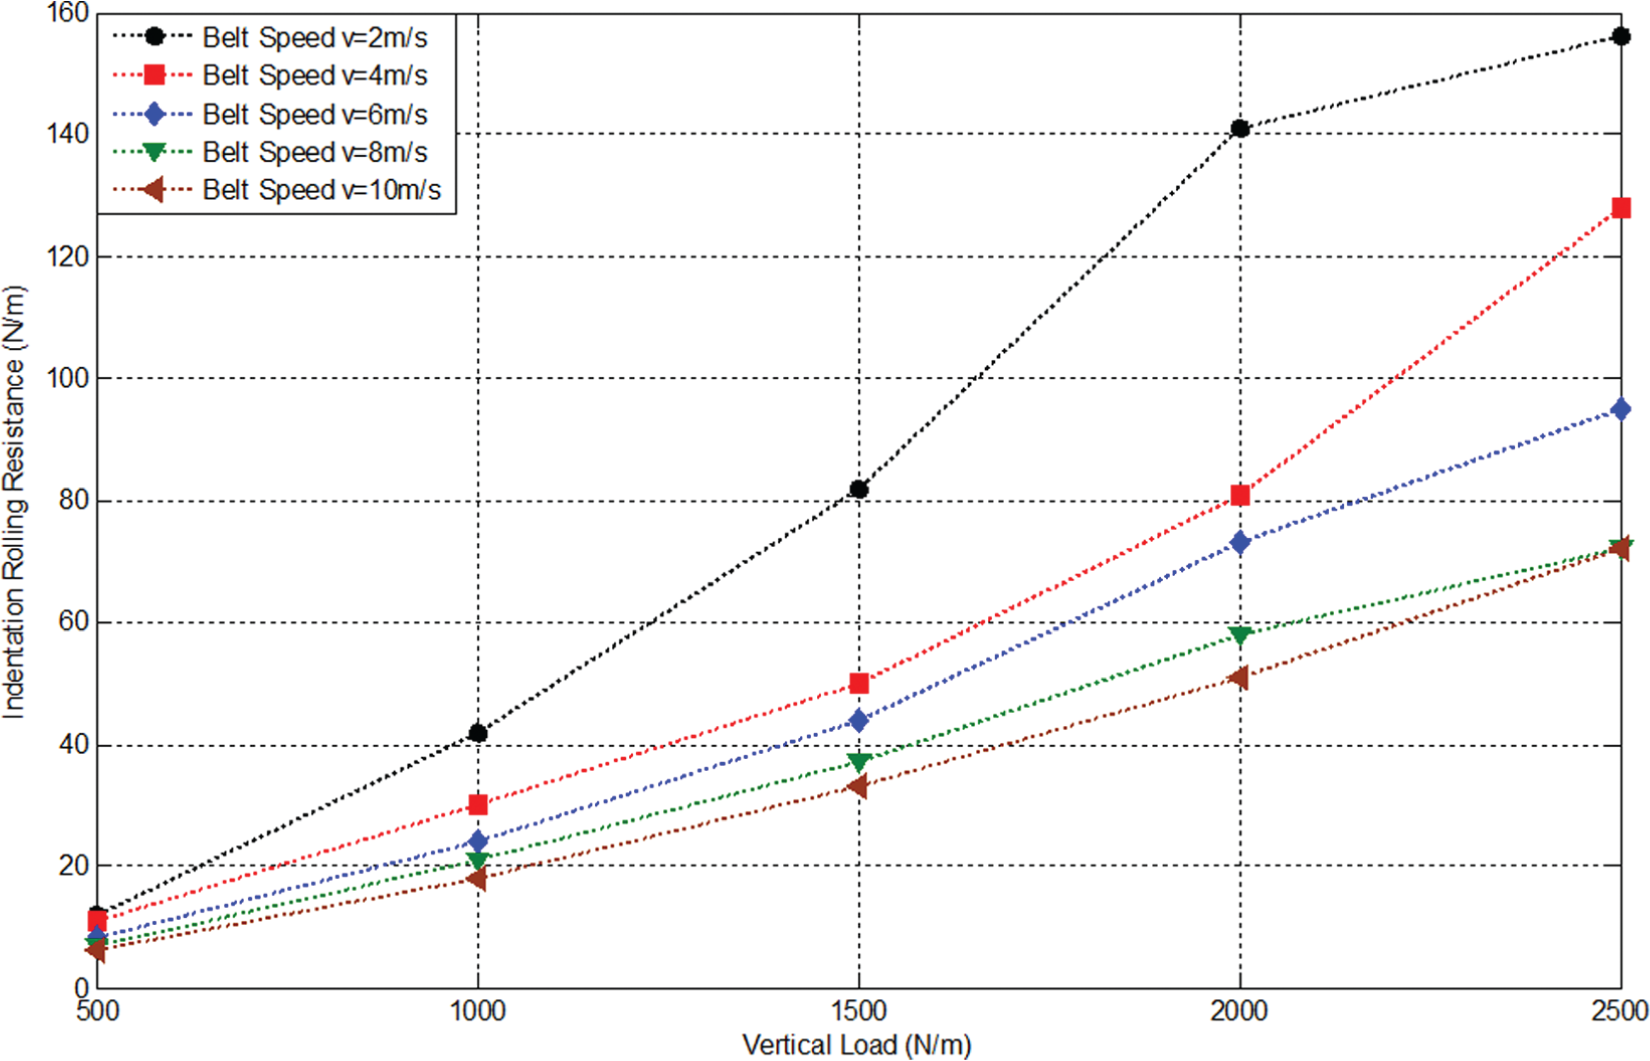
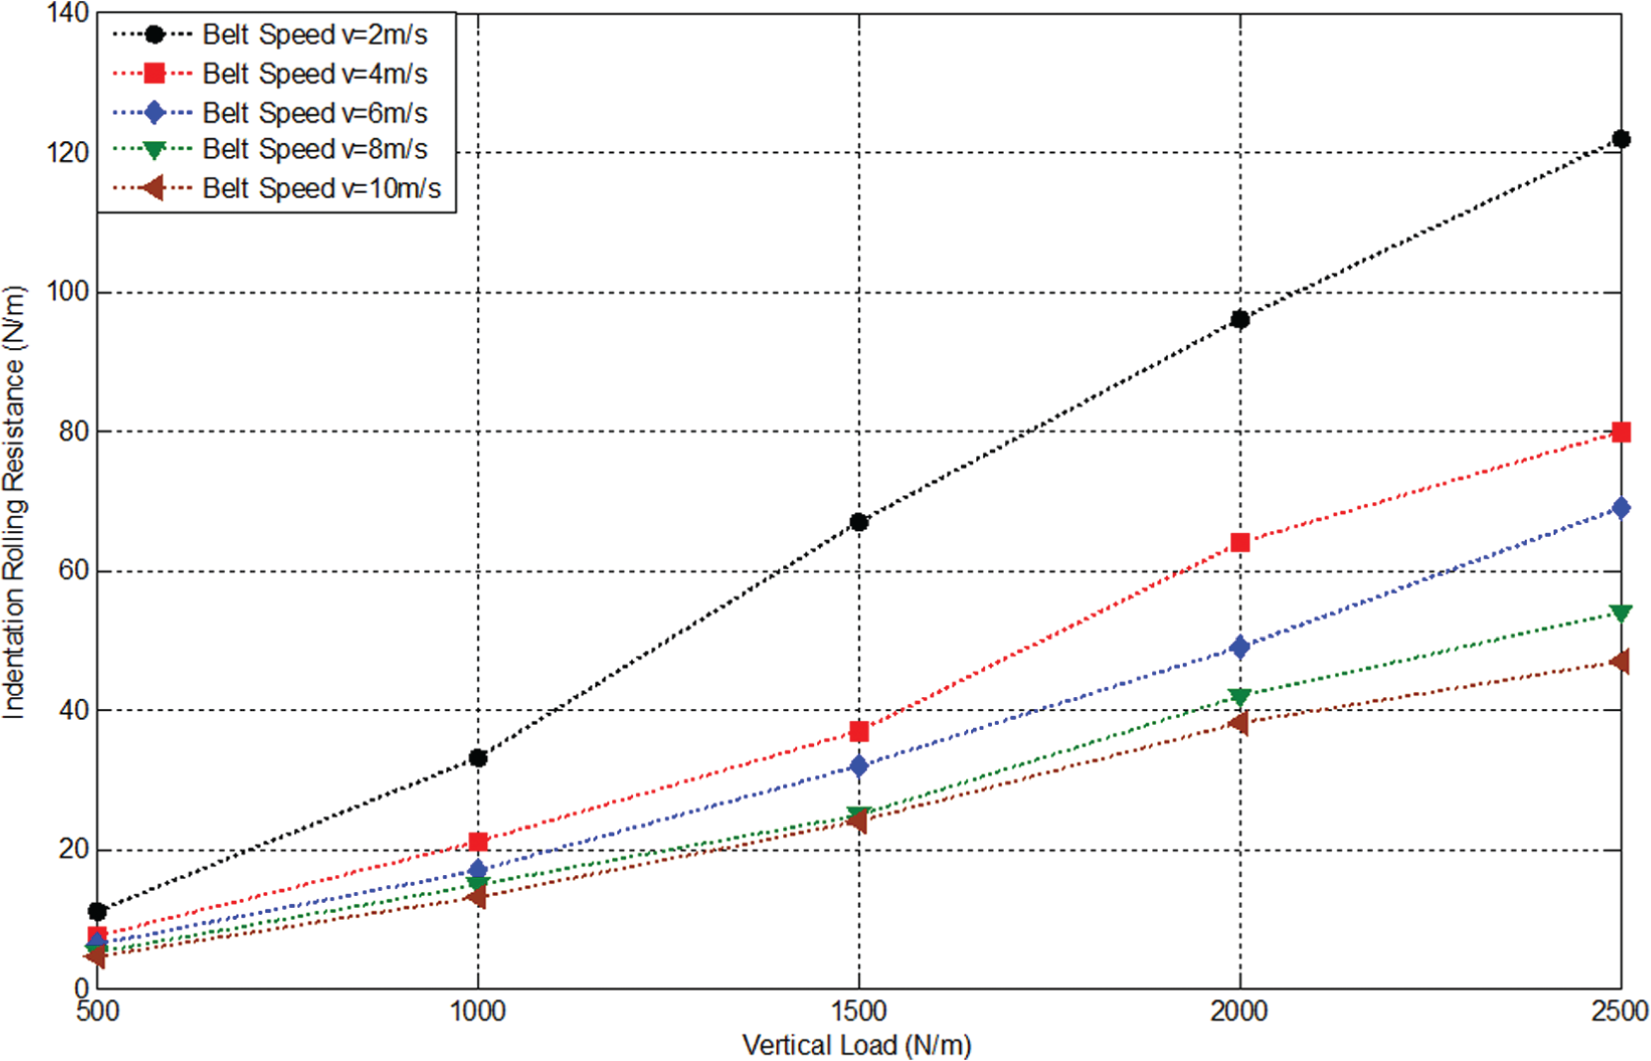
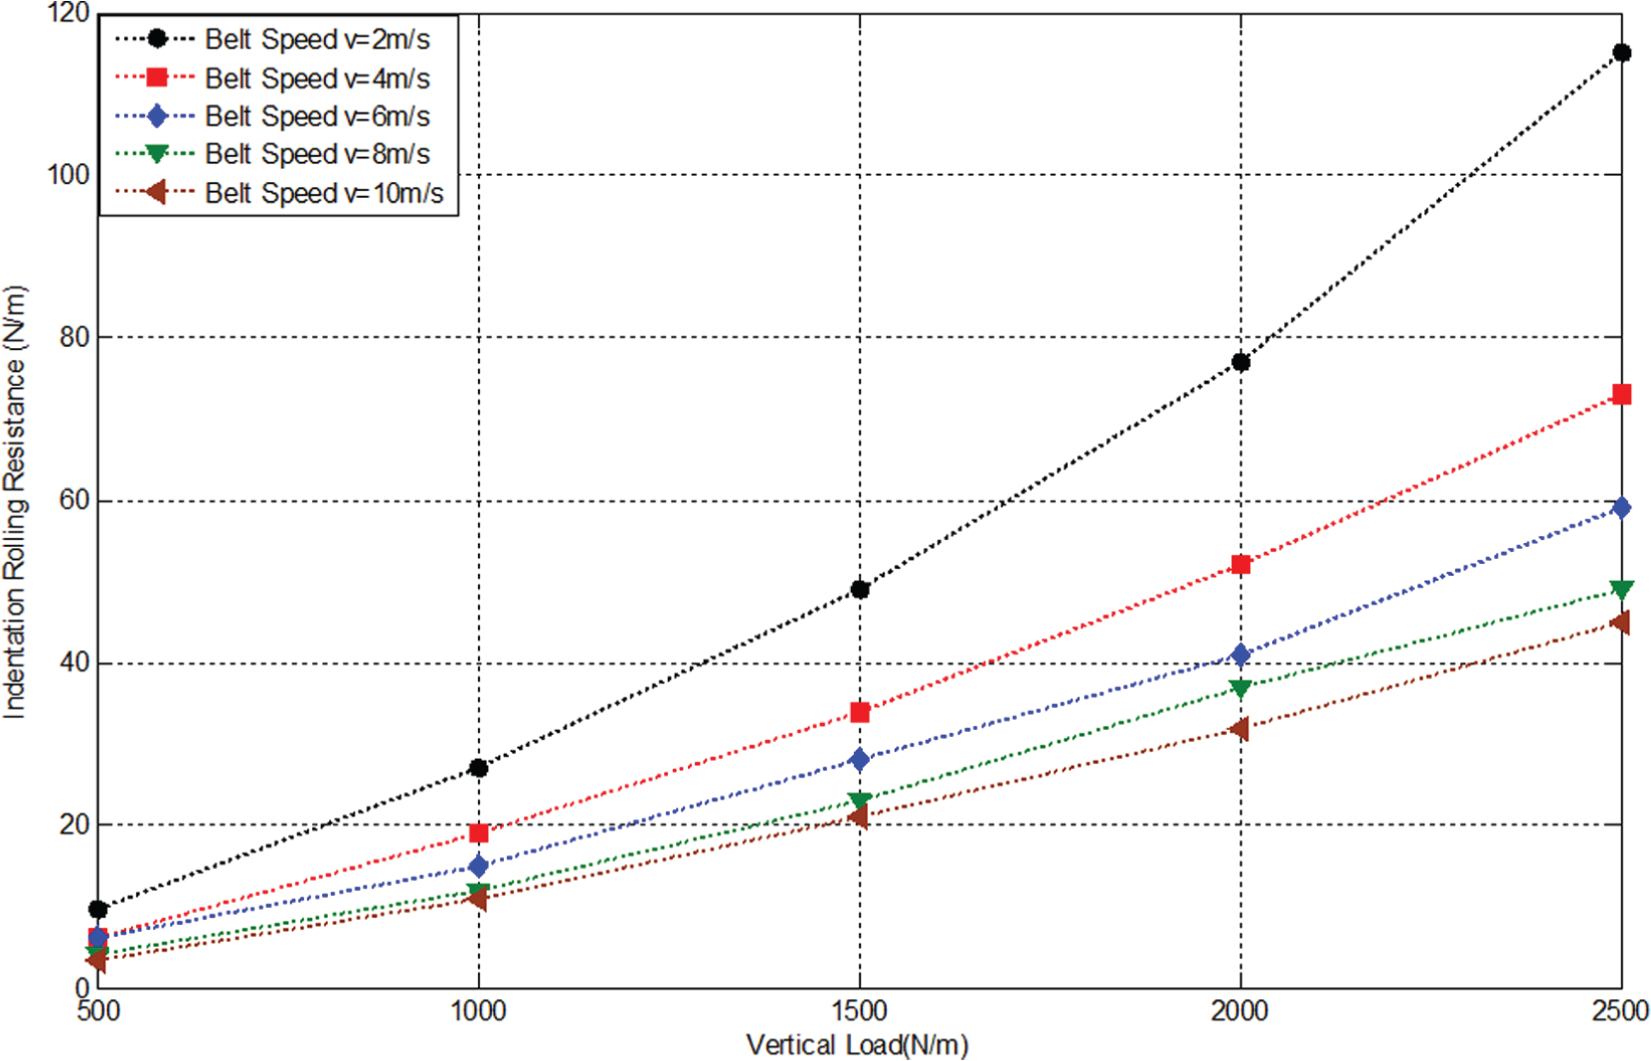
From Figures 27–35, it can be seen that the rolling resistance Fh increases linearly with increasing vertical load Fv . What is more, the growth rate of rolling resistance is relevant with the belt speed v. Finally, a conclusion illustrates the filiation between rolling resistance and belt speed, vertical load is given by way of interpolant of MATLAB when idler radius R is 66.5 mm and thickness of the backing material h is 6 mm.

Indentation rolling resistance (N/m) versus vertical load Fv at a belt speed of 2, 4, 6, 8, and 10 m/s under constant values of R = 44.5 mm and h = 6 mm.

Indentation rolling resistance (N/m) versus vertical load Fv at a belt speed of 2, 4, 6, 8, and 10 m/s under constant values of R = 54 mm and h = 4 mm.

Indentation rolling resistance (N/m) versus vertical load Fv at a belt speed of 2, 4, 6, 8, and 10 m/s under constant values of R = 66.5 mm and h = 2 mm.
Indentation rolling resistance (N/m) versus vertical load Fv at a belt speed of 2, 4, 6, 8, and 10 m/s under constant values of R = 54 mm and h = 6 mm.
Indentation rolling resistance (N/m) versus vertical load Fv at a belt speed of 2, 4, 6, 8, and 10 m/s under constant values of R = 66.5 mm and h = 4 mm.
Indentation rolling resistance (N/m) versus vertical load Fv at a belt speed of 2, 4, 6, 8, and 10 m/s under constant values of R = 44.5 mm and h = 2 mm.
Indentation rolling resistance (N/m) versus vertical load Fv at a belt speed of 2, 4, 6, 8, and 10 m/s under constant values of R = 66.5 mm and h = 6 mm.

Indentation rolling resistance (N/m) versus vertical load Fv at a belt speed of 2, 4, 6, 8, and 10 m/s under constant values of R = 44.5 mm and h = 4 mm.

Indentation rolling resistance (N/m) versus vertical load Fv at a belt speed of 2, 4, 6, 8, and 10 m/s under constant values of R = 54 mm and h = 2 mm.
From Figures 36–38, it can be seen that the maximum rolling resistance will appear when the vertical load is maximum and the belt speed is minimum. However, in the variation range of vertical load and belt speed, the value of rolling resistance exists as an extreme value.
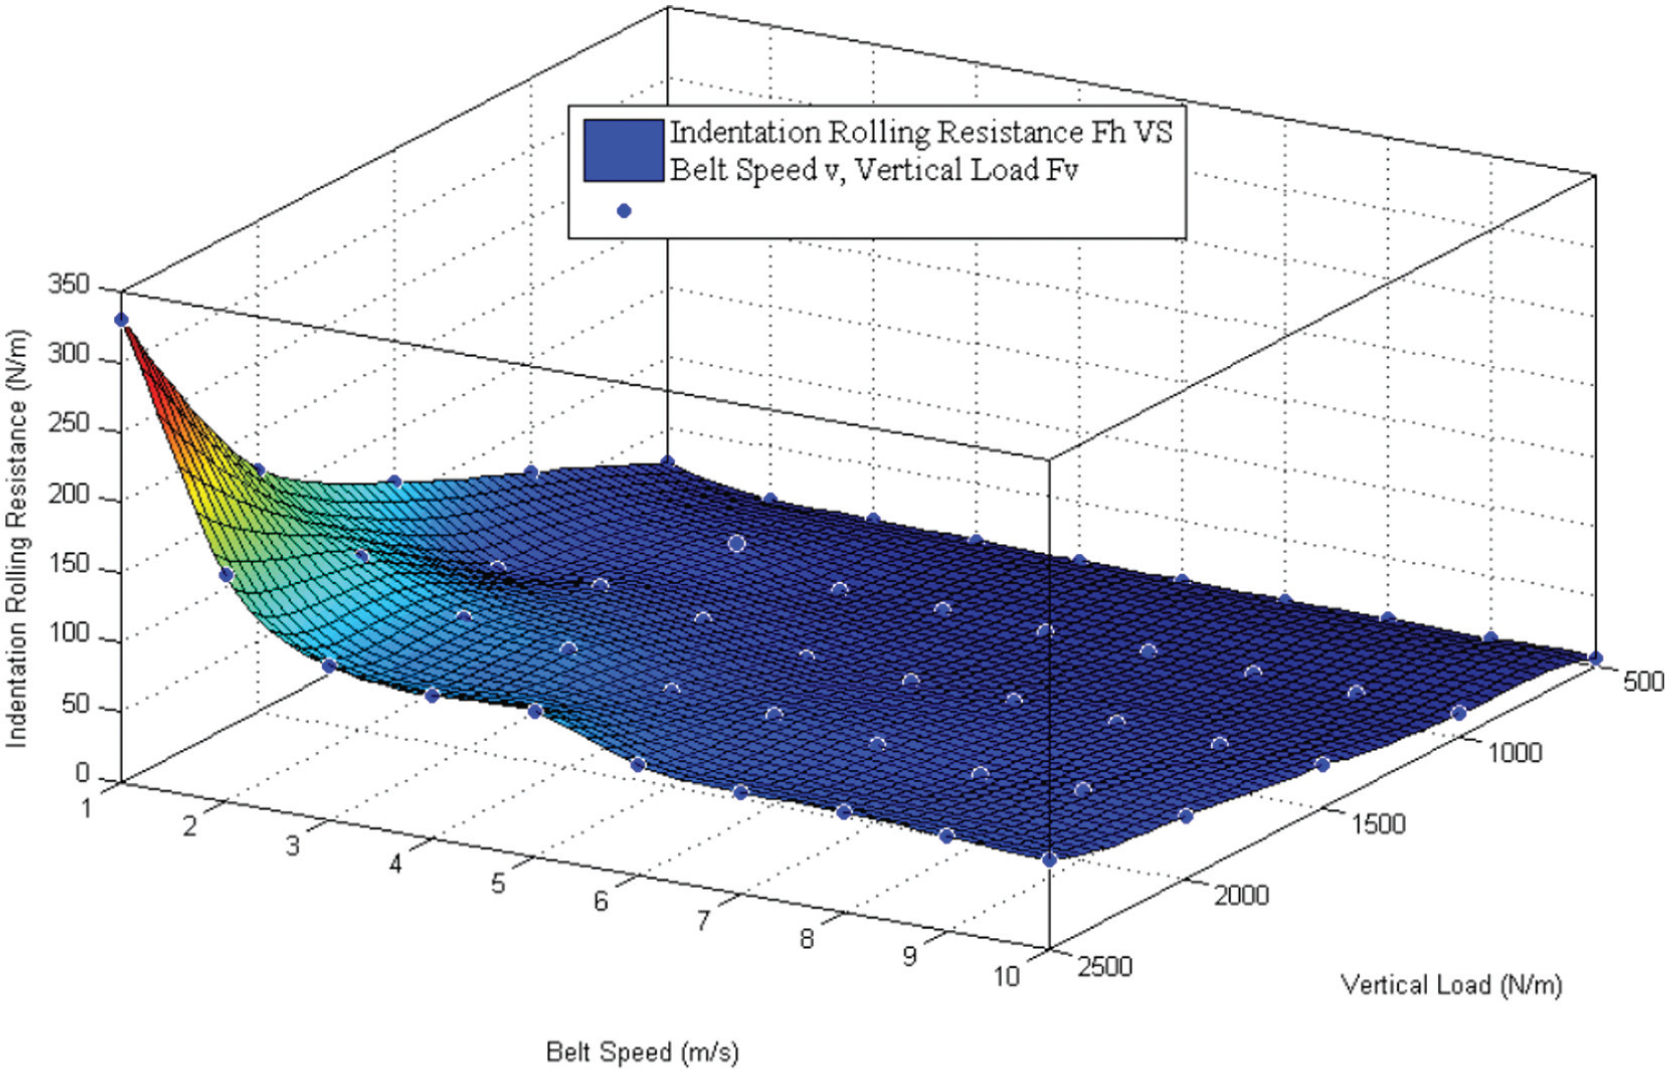
Indentation rolling resistance (N/m) versus vertical load Fv and belt speed v under constant values of R = 66.5 mm and h = 6 mm.

Indentation rolling resistance (N/m) versus vertical load Fv and belt speed v under constant values of R = 54 mm and h = 6 mm.

Indentation rolling resistance (N/m) versus vertical load Fv and belt speed v under constant values of R = 44.5 mm and h = 6 mm.
Experiments and verification
In order to verify the accuracy of the theory, the authors need to design a reliable experimental apparatus. To get reliable test data, the apparatus is built to simulate a real belt conveyor.
Apparatus and test method
The experimental apparatus is composed of two components, namely, mechanical structure and data acquisition (DAQ) with signal processing. Finally, the function structure of indentation rolling resistance measure system is shown in Figure 39.

Function structure of the indentation rolling resistance measure system.
On one hand, as for the mechanical structure (Figure 40), it mainly consists of drive pulley, frequency converter, tension pulley, test belt, carrying flat, test idler, and loading structure.

Mechanical structure of experimental apparatus.
On the other hand, the DAQ with signal processing includes tension sensor, DAQ card, signal processing device, and a test program of PC with the help of LabVIEW as shown in Figure 41. It is noticeable that the style of tension sensor is S. As for the DAQ card, it plays a role in DAQ. The function of signal processing device is signal amplification.
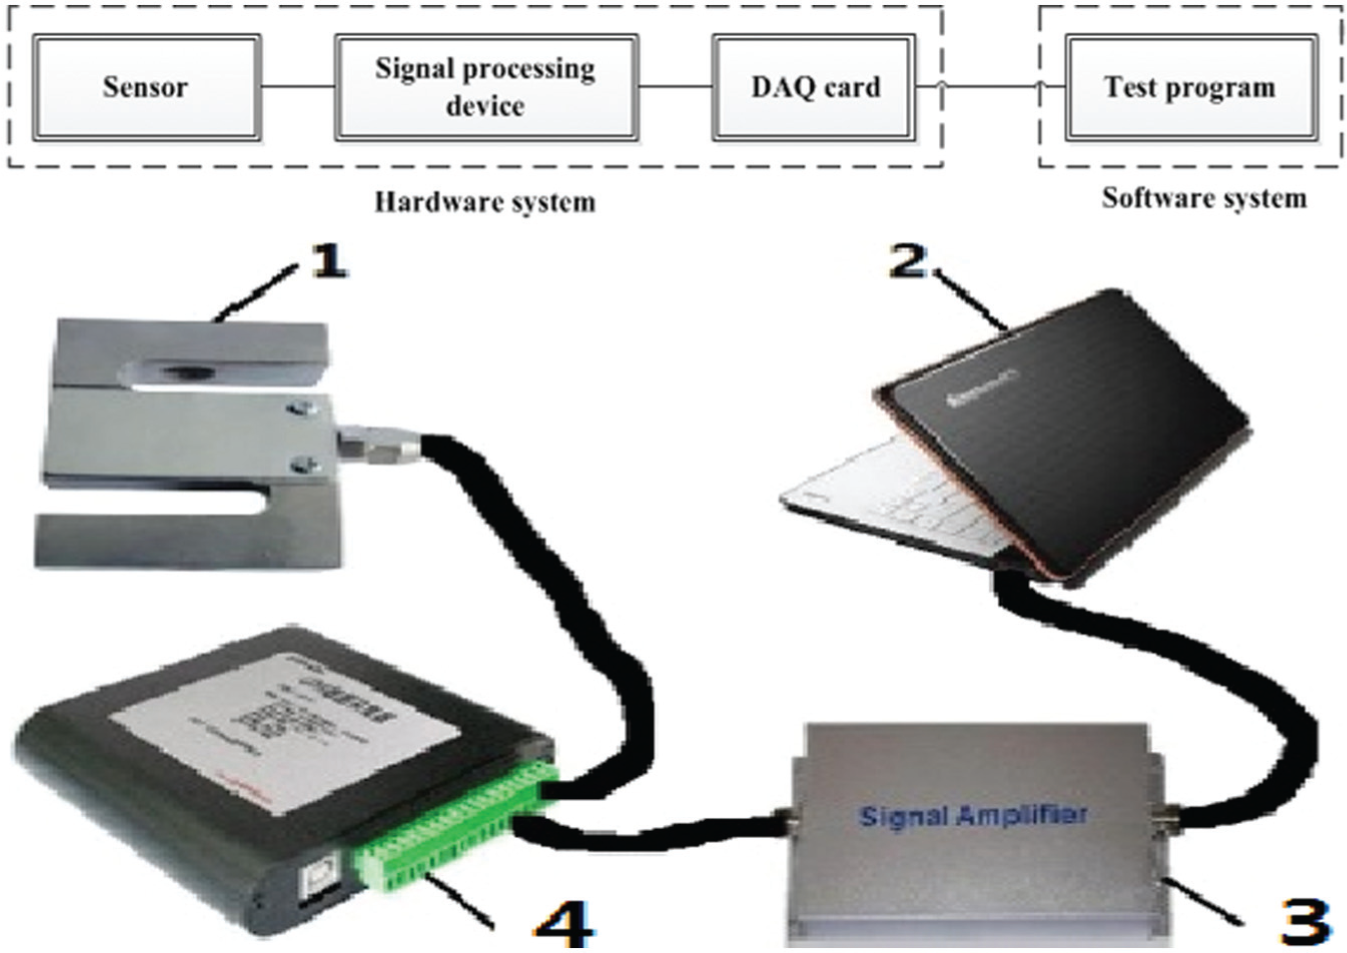
Data acquisition and signal processing.
As for the test program, it plays a part in DAQ, setting sampling frequency, signal filtering, and storage of signal as shown in Figure 42.

Diagram of program of data acquisition.
Verification
Aimed at this experimental apparatus, the parameters which can be changed are belt speed v, load Fv , and idler radius R. In this experiment, the idler radius R is 44.5, 54, and 66.5 mm, as shown in Figure 43, and thickness of rubber h is 6 mm. Using the frequency converter, the belt speed can be changed. With the help of loading structure, different loads Fv can be applied on the test belt.

Test idler.
As for the apparatus, because the maximum setting value of speed v is 6 m/s, in order to verify the theoretical results, the authors set the belt speed v at 2, 4, and 6 m/s and the load Fv at 500, 1000, and 1500 N/m, respectively.
In order to improve the reliability of test results, the variation of the belt speed v must satisfy the following conditions: first, test data must be measured in accordance with the increasing trend of belt speed v from 2 to 4 m/s at a constant vertical load Fv and recorded. Then, test data should also be measured in accordance with the decreasing trend of belt speed v from 2 to 4 m/s at a constant vertical load Fv and recorded. Finally, experiment must be retested once time and average value of four test results act as the ultimate value, and the standard deviation of ultimate value must be calculated.
Generally, it can be seen from Figures 44–46 that the test result is consistent with the theoretical result. However, when the belt speed v is above 4 m/s, the test result compared with the theoretical result is higher. What is more, the greater the belt speed v and vertical load Fv , the more obvious this phenomenon. The reason why this phenomenon occurred may be that when the belt speed v and vertical load Fv are greater, the test apparatus will vibrate severely.

Test result compared with theoretical result under constant values of R = 44.5 mm and h = 6 mm.

Test result compared with theoretical result under constant values of R = 54 mm and h = 6 mm.

Test result compared with theoretical result under constant values of R = 66.5 mm and h = 6 mm.
Conclusion
In this article, a theoretical analysis for rolling resistance based on the viscoelastic property of rubber is given. Then, a total formula of indentation rolling resistance which includes the influence of belt speed v and vertical load Fv on rolling resistance is presented. Finally, using the formula, how the common factors, such as belt speed and vertical load, exert an influence on indentation rolling resistance is analyzed in detail.
An apparatus which can measure the value of resistance is designed. What is more, a comparison between the theoretical results and measured results is performed under different idler radii R. Finally, several conclusions are arrived at through the theoretical analysis and experiments.
From the formula of indentation rolling resistance, belt speed v, thickness of rubber h, idler radius R, viscoelastic property of the backing material of test belt E 0, E 1, η 1, and contact length (a + b) have a direct effect on the value of resistance. However, the load Fv also has an influence on the value of resistance indirectly by exerting influence on the contact length (a + b).
The connection between the belt speed and indentation rolling resistance Fh is closely related. When the belt speed is at the lower level, the decrease in rolling resistance is obvious with the increasing belt speed. However, once the belt speed is above the threshold (6 m/s), the rolling resistance will no longer be changed. It infers that reducing the energy loss is not feasible by way of improving belt speed v. What is more, the threshold of the belt speed v may have a close correlation with viscoelastic property of the backing material of test belt E 0, E 1, and η 1, and thickness of rubber h, radius R, vertical load Fv have little influence on the threshold of the belt speed.
Vertical load Fv exerts an influence on the rolling resistance linearly. Therefore, the load plays an important role in the energy loss of the belt. What is more, it is not to be ignored that the belt speed v plays an important role in the relationship between vertical load Fv and rolling resistance Fh .
Footnotes
Academic Editor: Noel Brunetiere
Declaration of conflicting interests
The author(s) declared no potential conflicts of interest with respect to the research, authorship, and/or publication of this article.
Funding
The author(s) received no financial support for the research, authorship, and/or publication of this article.