
Abstract
This article aims to study the in-plane stiffness estimation of heat pipe supporter (a large lattice structure) using experimental and numerical methods. The in-plane stiffness of heat pipe supporter for nuclear power plant is very important because of the safety against natural disasters, such as seismic load or tsunami, and has to be evaluated because it greatly affects the durability of the heat exchanger. However, the modeling process of the whole lattice structure for finite element analysis increases resources needed caused by too many nodes and elements. In this study, the mechanical properties of large lattice structures are determined by a unit cell finite element analysis. The mechanical behavior of a large lattice structure has been estimated by finite element analysis through a homogenization process for reducing analysis time and efforts. The finite element analysis results have been verified and show a good agreement with the experimental results.
Keywords
Introduction
Lattice (or cellular) structures are widely used in various fields due to their reducing weight, energy absorbing, and designable or multifunctional properties.1–4 The honeycomb core of sandwich panels for airplanes, vibration and sound insulators, compact heat exchangers, biomedical implants, and bridge supports is only a few examples of applications.
The mechanical properties of structural components with a lattice structure have to be determined through experiments or numerical analysis. However, the experimental method for determining the properties requires a great deal of time and effort, and it is sometimes impractical. The numerical method generally using finite element analysis (FEA) software includes a modeling process of the whole lattice structure for defining nodes and elements. The modeling process of the whole lattice structure increases resources needed for a numerical analysis caused by too many nodes and elements which are produced due to the characteristic geometry of the lattice structure. The FEA problem often cannot be solved despite computing technology has been greatly developed recently. Therefore, the mechanical properties of a lattice structure, which is considered as a truss obtained by tessellating a unit cell, can be predicted by solving FEA problem of a unit cell.
Several numerical and experimental studies have been conducted to determine the mechanical properties of lattice structures.1,2,5–15 The major issue of the conducted research is determining the properties of the macro-material in terms of the effective properties of its unit cell. A process of homogenization is defined as the substitution of the lattice structure for a mass with effective properties and is meant to circumvent a detailed analysis of the entire lattice structure. Masters and Evans, 5 Christensen, 6 and Wang and McDowell7,8 predicted the effective mechanical properties by determining the elastic constants of the cell by solving numerical problems and examining individual cell walls. Shuguang Li9,10 and Sajad Arabnejad and Damiano Pasini 1 predicted the in-plane mechanical properties of the lattice structures through a numerical analysis using several unit cell types for a lattice structure and a rectangle unit cell for different lattice structures. K Ushijima et al. 11 predicted the mechanical properties of a three-dimensional micro-lattice structure through a numerical analysis under multi-axial loading. Jun Zhang and XinMing Qiu 12 solved numerical problems for an in-plane deformation of several lattice structures under quasi-static uniaxial loading. Many other researchers made attempts to determine the mechanical properties of lattice structures by the numerical methods.
The mechanical properties of a lattice structure determined by numerical methods have to be validated experimentally for use in terms of reliability, reproducibility, and so on. Thomas D Kim 13 experimentally estimated the in-plane mechanical properties of a triangular lattice structure. Choon Chiang Foo et al. 14 and Marian N Velea and Simona Lache 3 evaluated directional effective mechanical properties of sandwich structures with a honeycomb core through an experimental procedure. M Smith et al. 2 compared numerical analysis results with experimental results for the compressive response using a three-dimensional lattice structure. G Totaro et al. 15 showed numerical analysis results and experimental results for in-plane mechanical properties of anisogrid lattice structures.
As mentioned, many researchers estimated the mechanical properties using the unit cell for composites, cellular materials, lattice structures, and so on. However, most researchers made attempts to estimate mechanical properties by only numerical methods and not much research is conducted on a validation procedure through experimental methods. Even the validation procedure is conducted with a small sample, not the entire structure. Especially, the lattice structures are used in a relatively large truss structure, such as bridge supports, power-line towers, and so on. However, a large lattice structure has rarely been examined using numerical and experimental methods due to limitations in terms of time, costs, technique, and so on.
This study aims to estimate the mechanical behavior of a large lattice structure through a numerical analysis that uses the directional equivalent elastic stiffness of a unit cell and a homogenization procedure in which the lattice structure has been substituted with a laminated material. The laminated material can consist of several layers, which have orthotropic material properties, depending on the lattice structure type. The laminated material properties are then applied to the lattice structure for analytically observing the mechanical behaviors under a multidirectional load. Finally, the numerical analysis results are validated from empirical measurements of the mechanical behavior.
FEA for unit cell
Selecting target object
A type of lattice structure can be chosen to use among many lattice types, depending on the purpose of use. Pipes are used for separating flows into a hot flow and a cool flow in most heat exchangers. The pipes need a supporter to enroot without interference and to circumvent impact damage due to vibration of the pipes. The supporter has been manufactured as a lattice structure for which a lattice type can been selected by a ratio of the pipe area and the rest area or the hot flow and the cool flow. Figure 1 shows several lattice types, which theoretically have different ratios of the pipe area, 60% for the equilateral triangle type, 68% for the diamond type (internal angles: 60° and 120°), 78% for the square type, and 90% for the hexagon type. In this study, the diamond-type lattice structure, which has been used for a heat exchanger of nuclear power plants, has been selected as the target object.
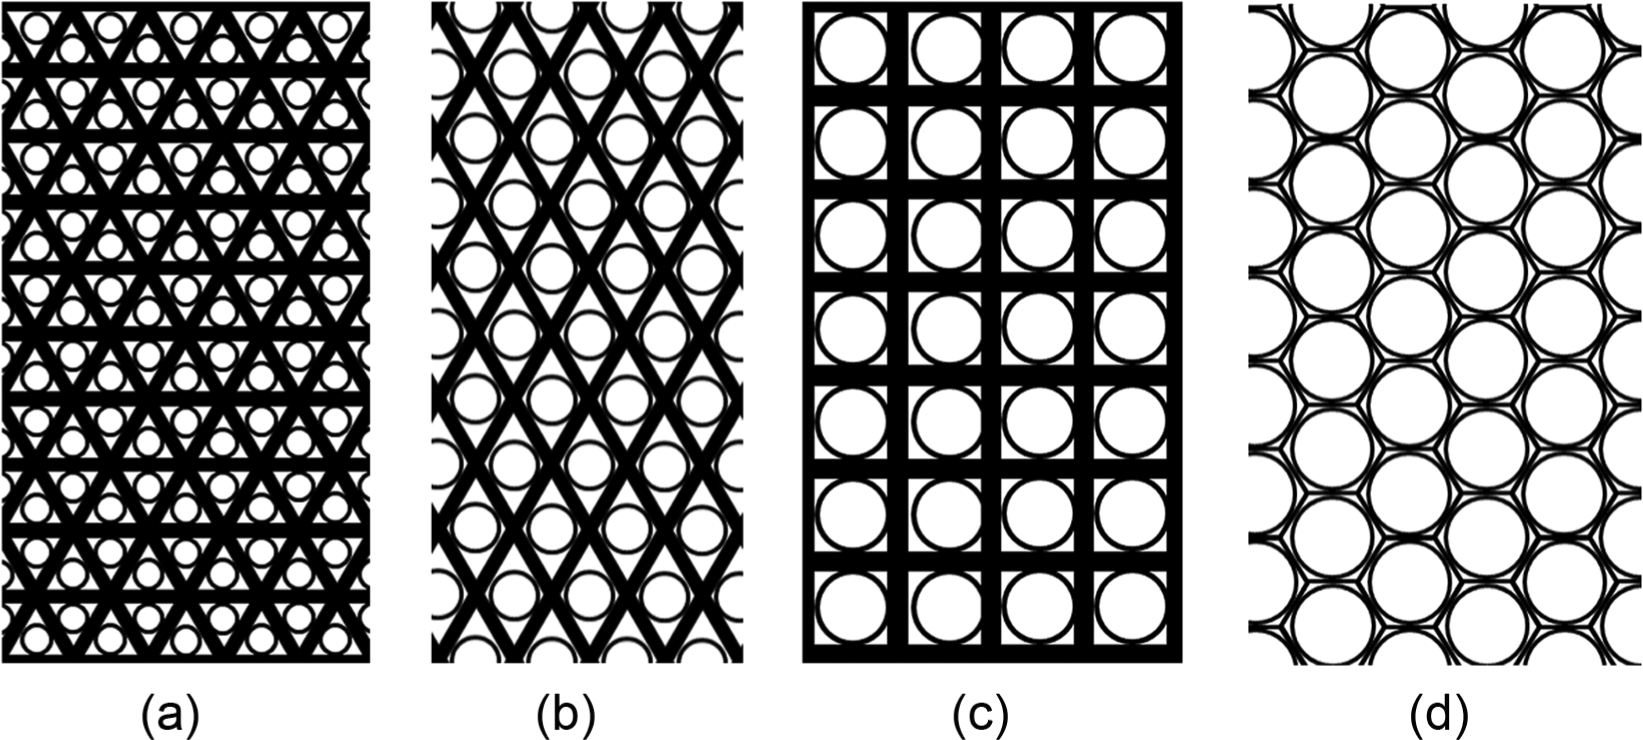
Various types of lattice structure: (a) equilateral triangle type, (b) diamond type, (c) square type, and (d) hexagon type.
The pipe supporter, which is used in a heat exchanger of nuclear power plants, is stacked up with two layers at angles of 0° and 60°, and each layer is alternately constructed with 50.8-mm-width bar and 25.4-mm-width bar in the same direction, as shown in Figure 2(a). The equivalent elastic modulus of the lattice structure can be regarded as 0 in the direction of 90°, if the stacking process is conducted with a simple lay-up method. However, the lattice structure was constructed by slotting 25.4-mm-width bar into a 50.8-mm bar, which has a machined slot for the 25.4-mm bar. This construction type induces an equivalent elastic modulus in the 90° direction on each layer.

(a) Lattice structure of the pipe supporter and (b) various types of unit cells. 9
From the characteristics of the lattice structure, FEA using the orthotropic material properties, for which a bar-directional (0° directional) equivalent elastic modulus and an induced 90° directional equivalent elastic modulus were utilized, was used for observing mechanical behaviors of the supporter. For the diamond-type lattice structure, several types of unit cells are available for use to estimate the equivalent properties, as illustrated in Figure 2(b). 9 The hexagon-type unit cell needs a specific boundary condition which is not generally supported by FEA software. The rectangle- and rhombus-type unit cells have, therefore, been considered for FEA of the unit cell in this study, as illustrated in Figure 3.
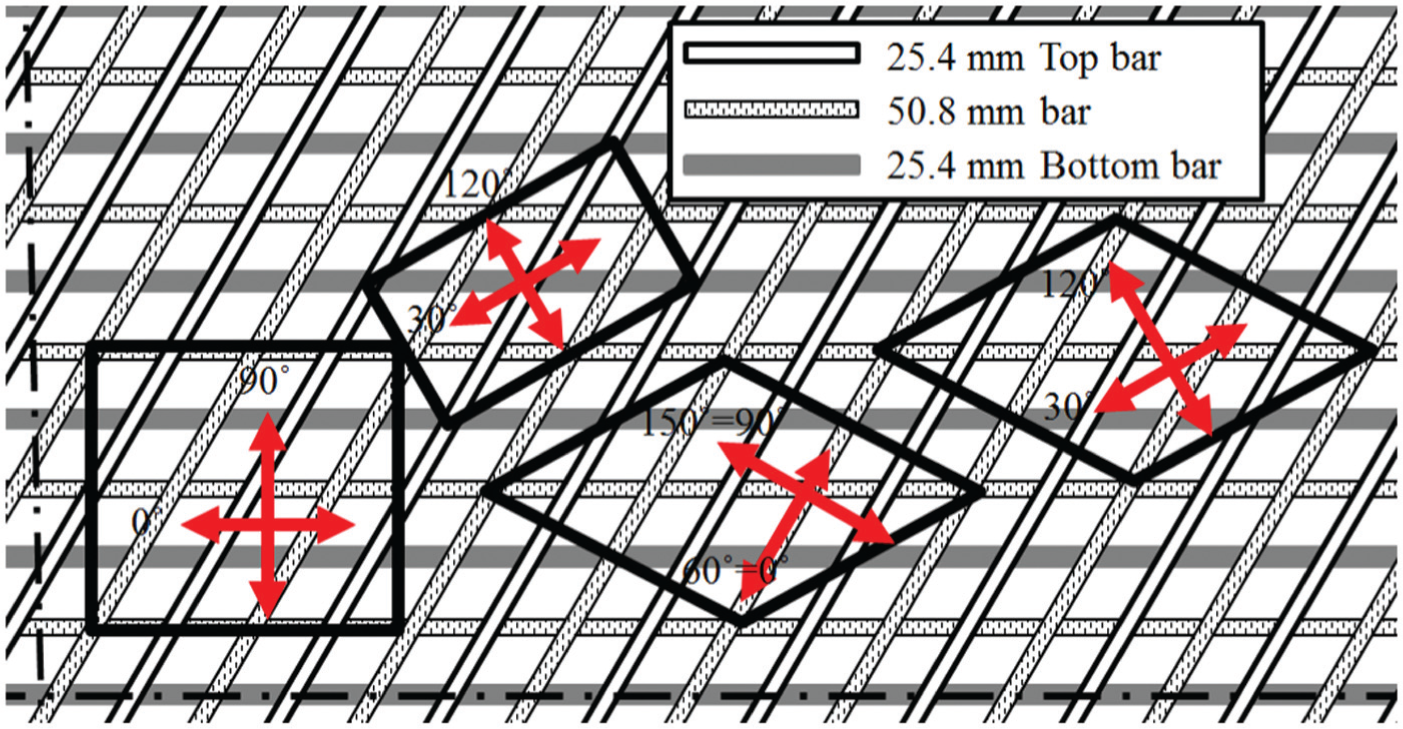
Selected unit cell shapes.
Effects of shape and size for unit cell
The elastic modulus, an inherent material property, is essential for FEA of a unit cell to estimate the equivalent elastic modulus. The tensile specimens were extracted and manufactured from the pipe supporter according to ASTM E8M. Figure 4 shows the tensile specimens before and after the test, and the tensile stress–strain curve resulted from the tensile test. The elastic modulus and yield strength were determined as approximately 60.4 GPa and 311 MPa from the test results, respectively. The test results were utilized for FEA in this study.

Tensile specimens (before and after the test) and tensile test results.
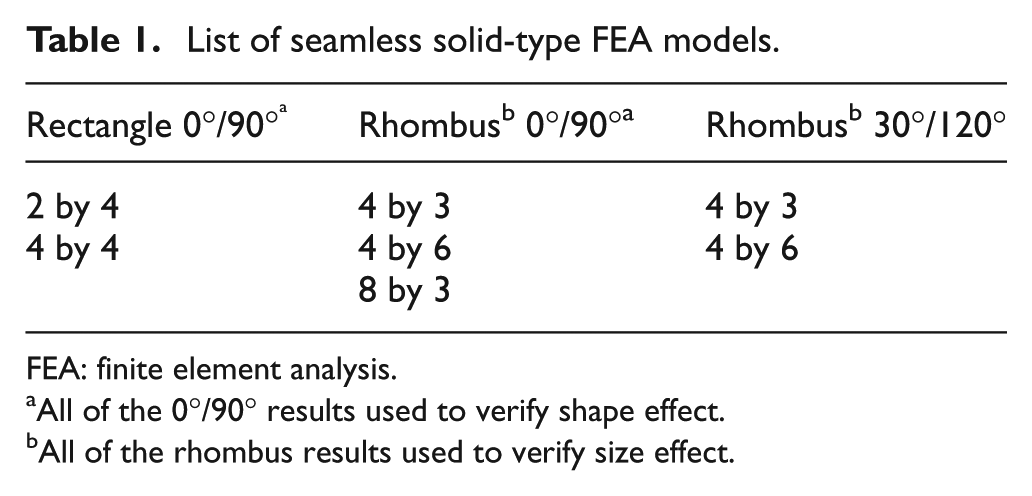
To verify the effect of unit cell shape, two cases of rectangle unit cell models and three cases of rhombus unit cell models, which are assumed as seamless solid types, were created using Pro/Engineer Wildfire V5.0. Unit cell models were imported into ANSYS V14.0 and then meshing, boundary conditioning, and analysis were conducted. In addition, to verify the effect of the unit cell size, five cases of rhombus models were utilized. All of the models were classified by the number of equilateral triangles, which had lengths of 25.4 mm for each side, in the horizontal and vertical directions (○ by ○), as listed in Table 1.
List of seamless solid-type FEA models.
FEA: finite element analysis.
All of the 0°/90° results used to verify shape effect.
All of the rhombus results used to verify size effect.
The models were meshed by ANSYS with solid 285, which is a three-dimensional tetrahedron element. The length of each side for the elements had been determined as 2.3 mm, caused by the smallest dimension (thickness = 2.3 mm) of the bar. The elastic modulus, Poisson’s ratio, and the yield strength of the material were applied in FEA as 60.4 GPa, 0.3, and 311 MPa, respectively.
For all of the models, the left face was fixed on the x-axis, while the bottom face was fixed on the y-axis. The back face was fixed on the z-axis. The top and right faces were tied to a coupled set y-axially and x-axially, respectively. It means that all nodes of the top face will have the same y-axial displacement, while all nodes of the right face will have the same x-axial displacement. In the case of the rhombus unit cell, additional coupled sets were defined in consideration of the symmetric condition. The x- or y-directional loads were applied to the tied coupled set for the estimation of the directional equivalent properties, such as the equivalent elastic modulus, Poisson’s ratio, and so on, in the 0°, 90°, 30°, and 120° directions.
The equivalent elastic moduli from FEA using the seamless solid rectangle unit cell models are shown in Tables 2 and 3. The equivalent elastic moduli were computed from the x-axial and y-axial strains of the FEA results, which were obtained from dividing the x-axial and y-axial displacements by width and height, respectively, and from the normal stress, which was obtained from dividing the load by the cross-sectional area of the unit cell.
Equivalent elastic moduli (GPa) of different unit cell shapes from FEA.

FEA: finite element analysis.
Equivalent elastic moduli (GPa) of rhombus unit cell shape from FEA.
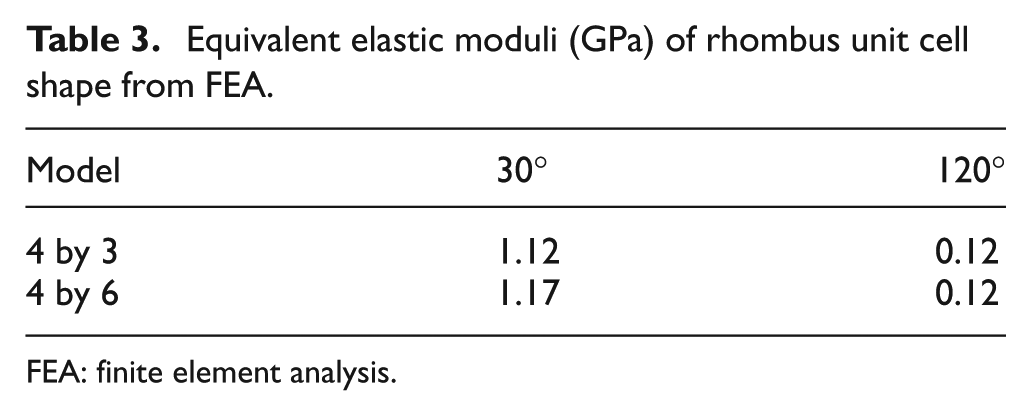
FEA: finite element analysis.
The FEA results of the rectangle unit cells consistently show an equivalent elastic modulus of 4.93 GPa in the 0° direction, regardless of the unit cell size. The FEA results of the smallest rectangle unit cell show an equivalent elastic modulus of about 2.43 GPa in the 90° direction. However, it is confirmed that the equivalent elastic modulus in the 90° direction decreases with a larger rectangle unit cell. It can be explained that the decrease in the equivalent elastic modulus in the 90° direction is induced by a moment produced by the aligned bars in the 60° direction and the 90° directional load on the FEA model, as shown in Figure 5. For more details, a moment is produced by the aligned bar in the 60° direction when the 90° directional load is applied to the rectangle unit cell model. The left and right faces of the unit cell have been restricted to move in the horizontal direction as a constrained or a coupled set for obtaining the equivalent elastic modulus, which is the goal of FEA. It seems that these constrained conditions and the moment induce an excessive stress concentration on the left upper end and the right lower end of the unit cell and overestimate the equivalent elastic modulus. For verification, additional FEA was performed using a unit cell model with extended width. From the FEA results, it is confirmed that a longer width of the rectangle unit cell decreases the constrained effect, and the equivalent elastic modulus is reduced to about 1.45 GPa.

Analysis of the FEA result for a rectangle unit cell (90°).
The FEA results of the rhombus unit cells show consistent equivalent elastic moduli in all directions, regardless of the unit cell size. The equivalent elastic moduli in each loading direction are obtained as about 4.93 (0° direction) and 1.21 GPa (90° direction). The equivalent elastic modulus in the 0° direction is very similar to the FEA results of the rectangle unit cell model. The equivalent elastic modulus in the 90° direction is determined as about 1.21 GPa, which is lower than the value of 1.45 GPa obtained from the additional FEA results using a unit cell model with extended width, due to the elimination of the constrained effect shown in the rectangle unit cell model. The equivalent elastic moduli in the 30° and 120° directions were determined as consistent values of 1.14 (30° direction) and 0.12 GPa (120° direction). The rhombus type has been considered as an appropriate unit cell type for FEA since the FEA results of the rhombus unit cell showed consistent values in all directions.
FEA of unit cell for the equivalent elastic modulus
In the prior section, the rhombus type was considered as an appropriate type for the unit cell of FEA. Now, the unit cell model has to be assembled from 50.4- and 25.4-mm bar for more accuracy to determine the equivalent elastic modulus of the pipe supporter. All of the bars are separately modeled and assembled to make a rhombus unit cell model, which has been imported from Pro/Engineer software into ANSYS software. All of the models have been meshed by the same method mentioned in section “Effects of shape and size for unit cell.”
The assembled models have to be set up with several contact pairs to assign the contact area, as shown in Figure 6, because it consists of several 50.8- and 25.4-mm bars. The contact areas of the assembled models were assigned with 22 frictionless pairs for all contact areas.
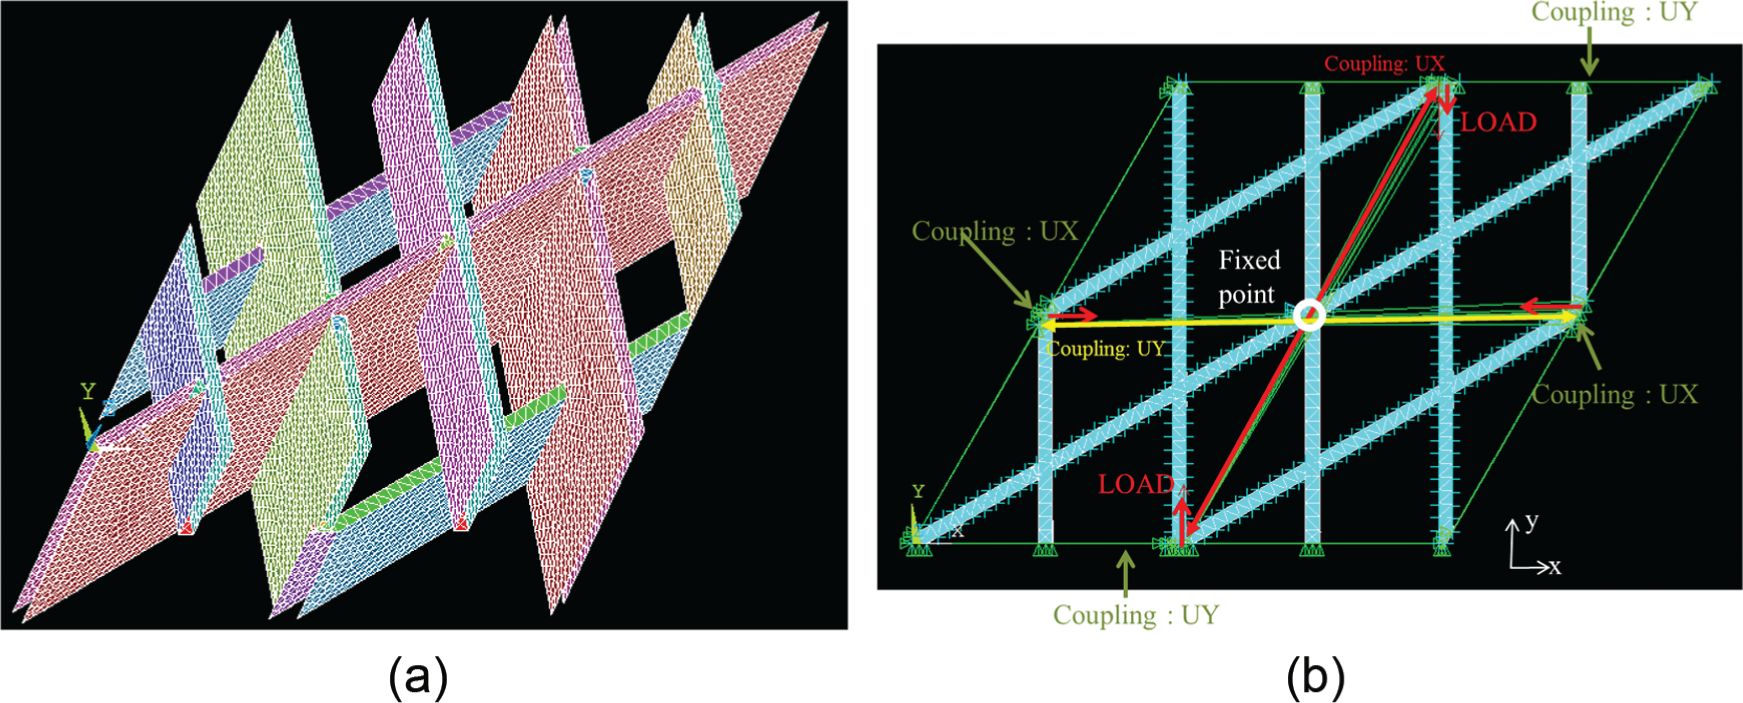
(a) Defined surface mesh and contact pairs and (b) applied boundary conditions of rhombus unit cell.
Somewhat different boundary conditions with a seamless solid type were applied to the assembly type for more accuracy. The left and right faces were separately tied to a coupled set in the x-axial direction, while the top and bottom faces were separately tied to a coupled set in the y-axial direction, as shown in Figure 6. The back face, which is not visible in Figure 6, has also been z-axially fixed. The two nodes on the center of the models were fixed in the x- and y-directions. The left and right faces have to be under symmetric conditions, as do the top and bottom faces, because of the definition of a unit cell. It means that the central point displacement of each face has to be the same as that of the opposite face. For this reason, the central areas of the left and right faces were tied to a coupled set in the y-direction, while the central areas of the top and bottom faces were tied to a coupled set in the x-direction. The x- or y-directional loads were applied to the tied coupled set for the estimation of the directional equivalent properties, such as the equivalent elastic modulus, Poisson’s ratio, and so on, in the 0°, 90°, 30°, and 120° directions.
The results of FEA using the rhombus unit cell models of the assembly type are presented in Figure 7 and Table 4. The results include only the loading directional modulus and Poisson’s ratio that are calculated from the x- and y-axial deformations. The equivalent elastic moduli in each loading direction are obtained as about 2.25 (0° direction), 0.55 (90° direction), 0.32 (30° direction), and 0.03 GPa (120° direction). The equivalent elastic moduli are found to be lower than those obtained using the seamless solid type in the 0° (45%), 90° (45%), 30° (30%), and 120° (30%) directions.
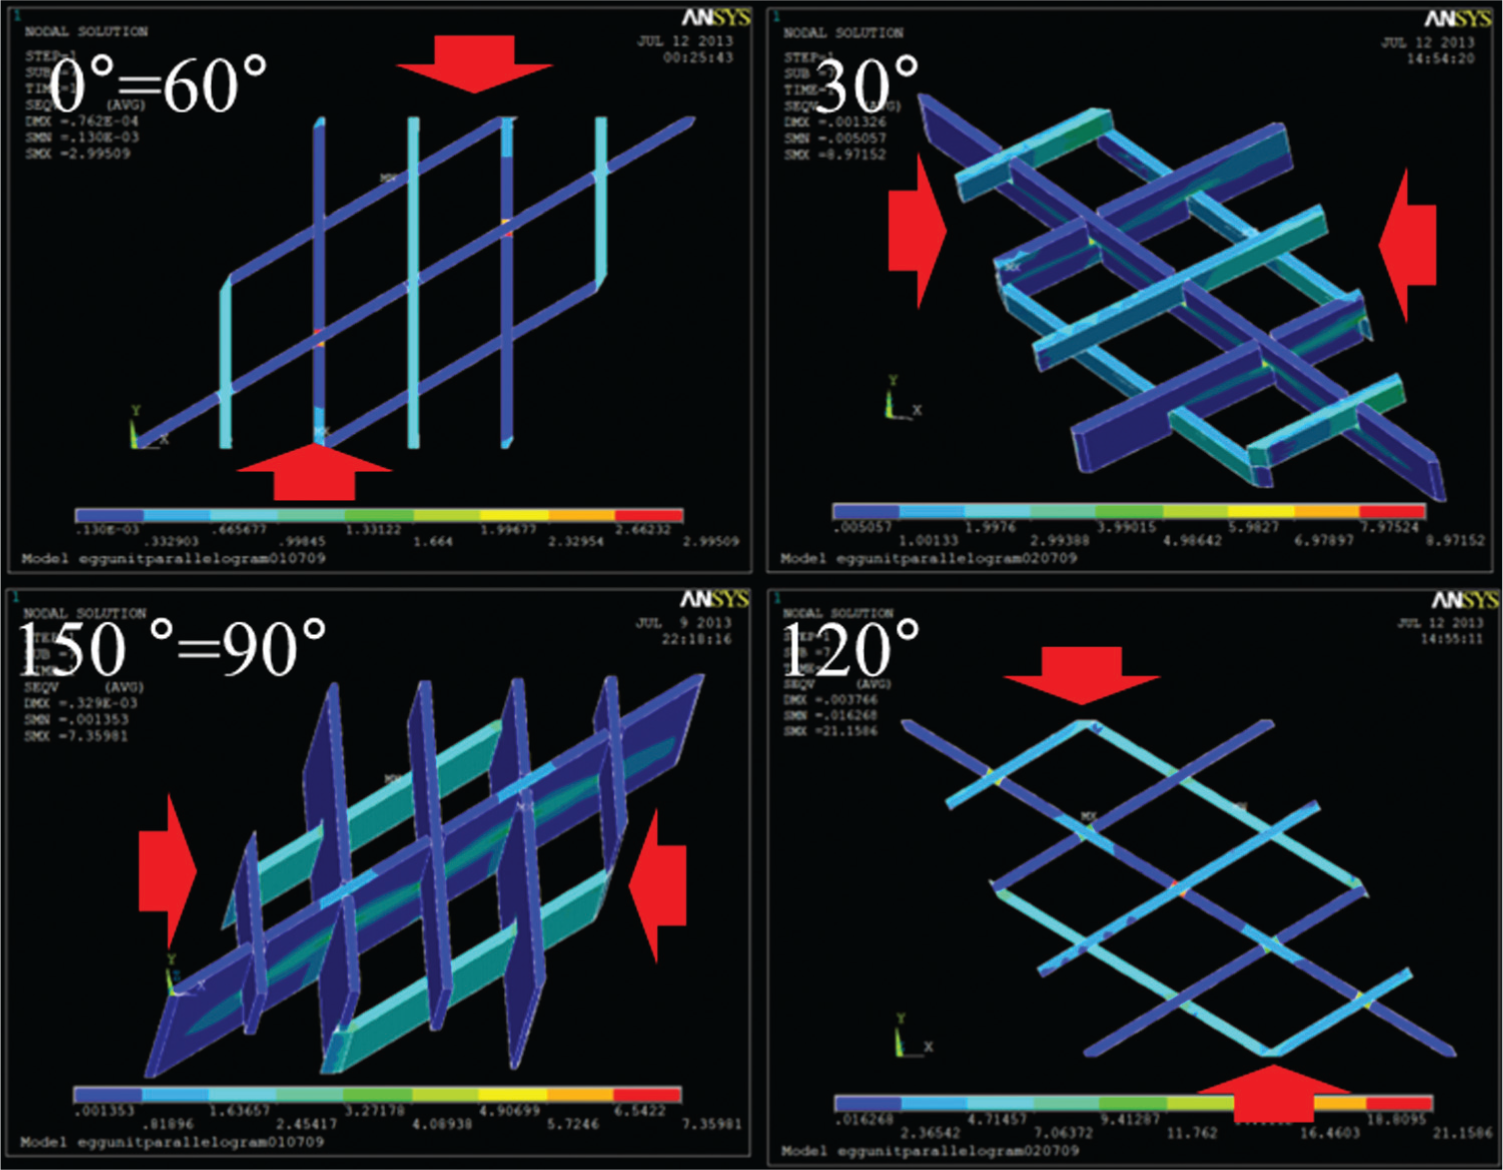
FEA results of assembly-type rhombus unit cell.
Equivalent elastic moduli of assembly-type rhombus unit cell.

Homogenization process
The pipe supporter is stacked up by slotting 25.4-mm bar into a 50.8-mm bar, which has machined slots for 25.4-mm bar, and each layer is alternately constructed with 50.8- and 25.4-mm bar in the same direction, as shown in Figure 2(a). In this study, the orthotropic material properties, which includes the 0° directional (bar-directional) and 90° directional (induced by stacking sequence) equivalent elastic moduli, were applied to FEA for the in-plane stiffness estimation of the pipe supporter. For applying the orthotropic material properties, it is assumed that each layer of the pipe supporter, which is stacked up with the same two layers with different aligning angles (0° and −60°), has orthotropic material properties such as fiber-reinforced plastic (FRP) composite materials. The orthotropic properties then have to be materialized.
In this study, an inductive approach was used to materialize the orthotropic properties. An equivalent elastic modulus was obtained from FEA for a model consisting of two composite layers, as shown in Figure 8(a). This study aims to estimate the equivalent elastic modulus on the x–y plane of the pipe supporter, and z-axis has been assumed as the thickness direction of the pipe supporter. The equivalent elastic modulus, which is the target of this study, varies according to the change in the Ex, Ey, and νxy values, while the other properties do not affect much. However, the other material properties are still needed for this study because of the requirements of the three-dimensional FEA that was used.
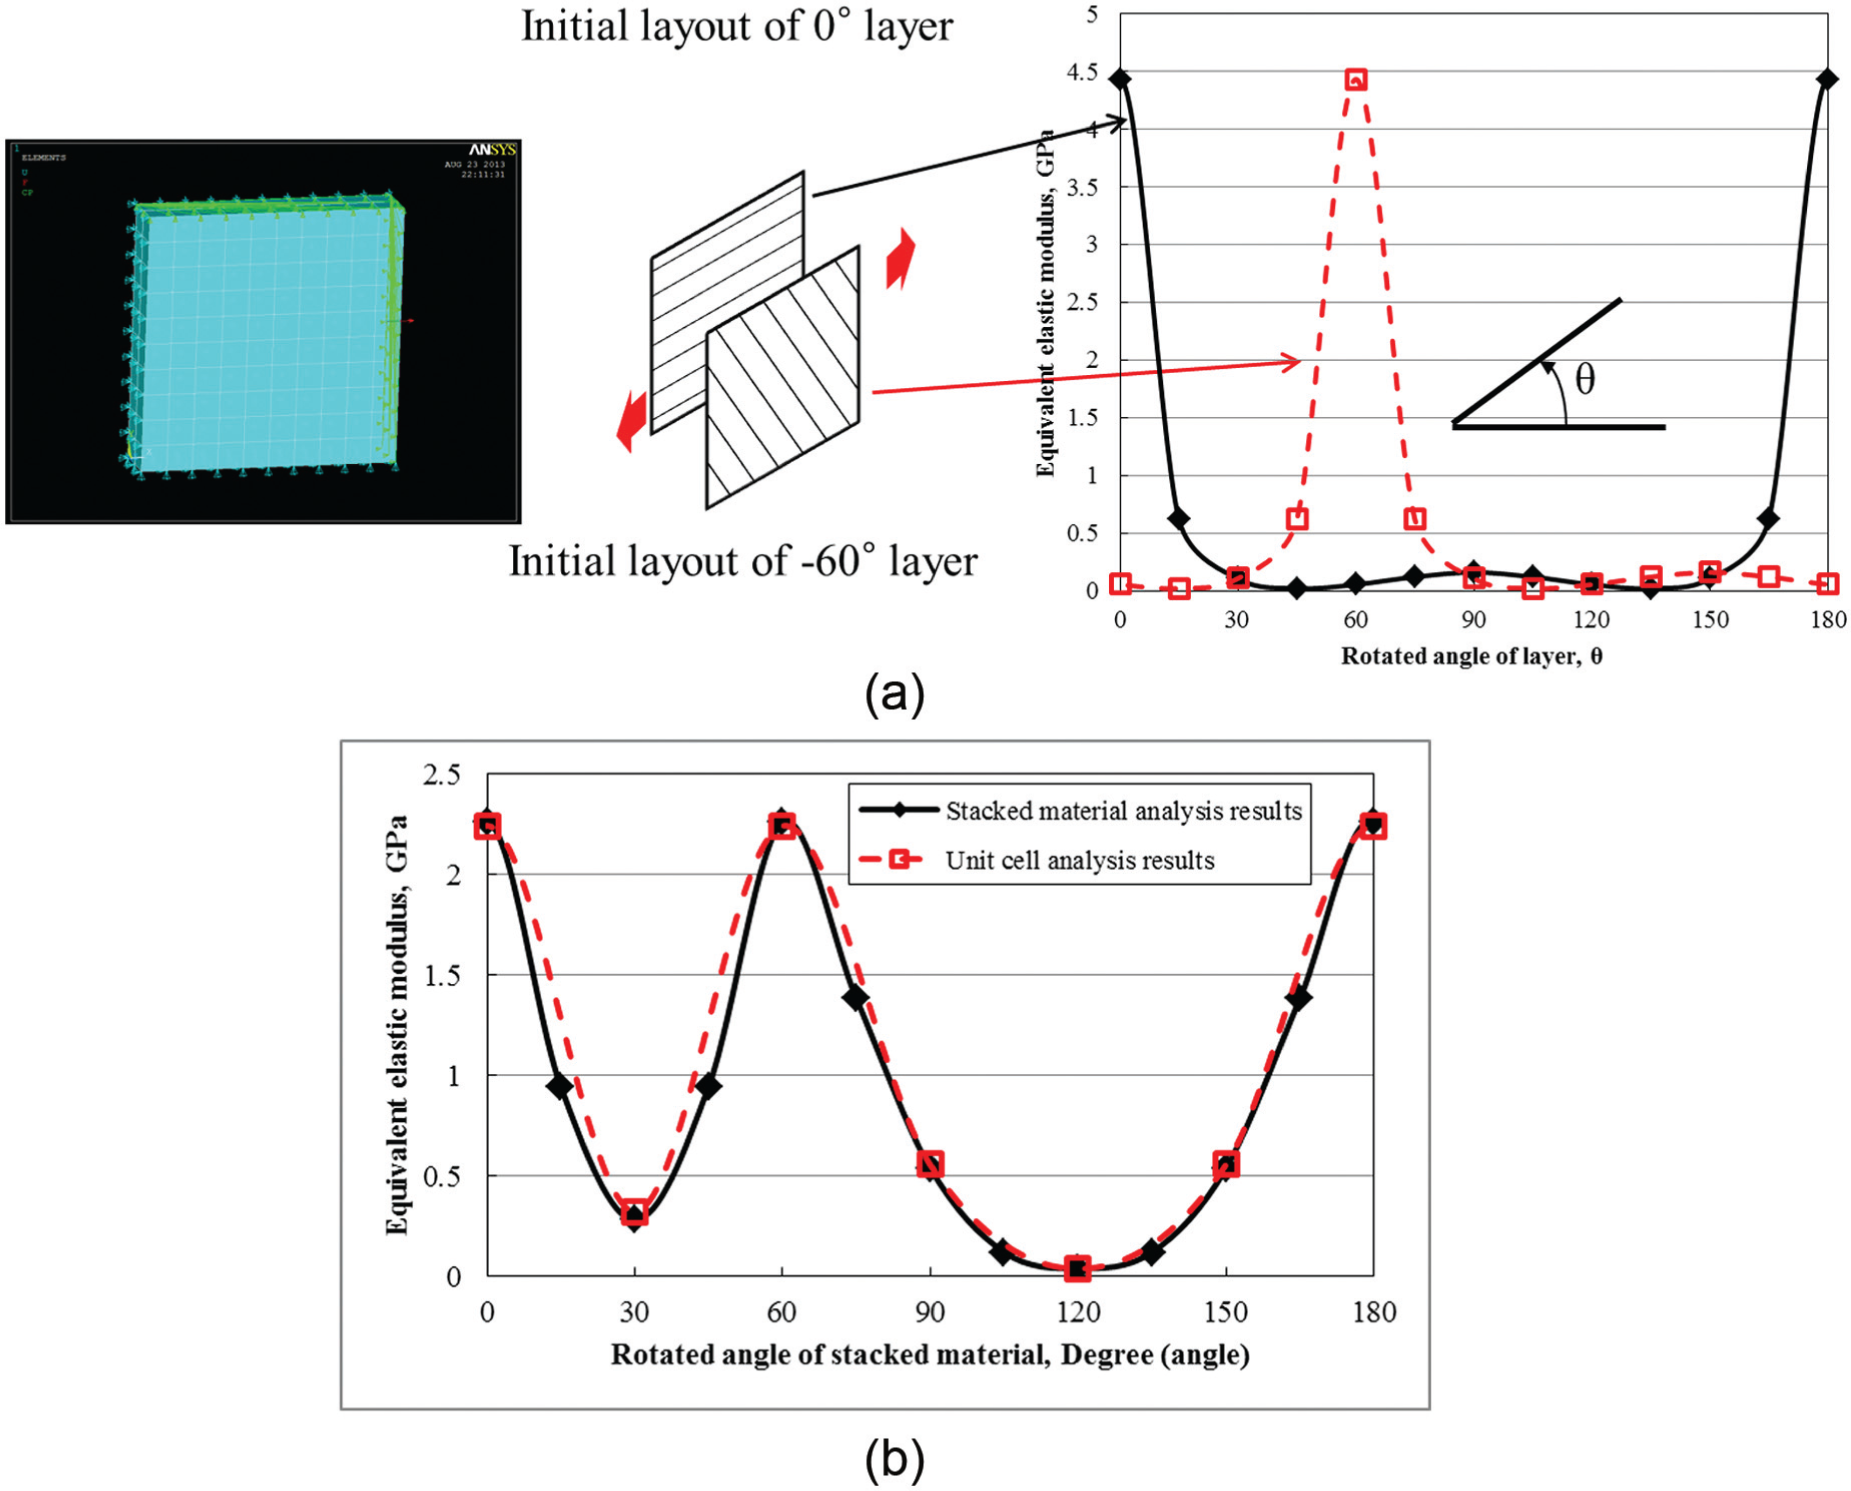
Homogenization process of equivalent elastic moduli using orthotropic material properties: (a) variation of equivalent elastic modulus according to the rotation angle of the layers and (b) comparison between unit cell analysis results and homogenization results.
First, to each layer of the FEA model, 4.5 GPa was applied as Ex, which is twice the equivalent elastic modulus of the 0° direction (equal to the bar-direction and x-direction; from Table 4). This was done due to an expectation that the x-directional elastic modulus of the FEA model should be half the value of Ex because the FEA model consists of two layers. The Ey and Gxy values, which are the 90° directional equivalent elastic modulus and the shear modulus of each layer that resulted from the stacking sequence, could not be determined exactly with any experimental or numerical methods due to the fact that each layer consists of unidirectional bars only and does not have any constraint to deform in the 90° direction. However, the Ey and Gxy values could be expected as much lower values than the Ex value.
The νxy value of a bar could be regarded as 0.3 because the νxy value of steel is generally regarded as approximately 0.3. However, the νxy value of each layer, which is the ratio of the y-directional strain to the x-directional strain of each layer, could be expected as a low value. When an x-directional load is applied to the layer, the y-directional deformation is divided by a y-directional length of the layer, not the bar thickness, for calculating the strain.
For these reasons, low values of 0.1 GPa, 0.01 GPa, and 0.1 for Ey, Gxy, and νxy, respectively, were applied to the FEA model. Ez was then defined as 6.21 GPa from consideration between the elastic modulus (60.4 GPa) of the material and the area ratio (50.4-mm bar area/unit cell area). Gyz and Gxz were determined as approximately 1/3 of the Ez because the shear modulus is generally determined as 1/3 of the elastic modulus. The values of νxz and νyz, which are the ratios of the x- and y-directional strain against the z-directional strain, were determined as low values of 0.01 and 0.01 due to the fact that the z-directional properties do not affect the x- and y-directional properties much in this study.
Two layers to which the aforementioned orthotropic properties were applied were stacked with different aligning angles (0° and −60°) such as the unit cell and the pipe supporter, as shown in Figure 8(a). The left, bottom, and back faces were fixed on the x, y, and z-axes, respectively. The right and top faces were separately tied to a coupled set in the x- and y-directions, respectively. A load was then applied to the right face for the estimation of the directional equivalent properties. The aligning angles were increased by 15° intervals in FEA for equivalent elastic moduli, according to the rotation angle of the layers, and the angle between two layers was still kept as 60°.
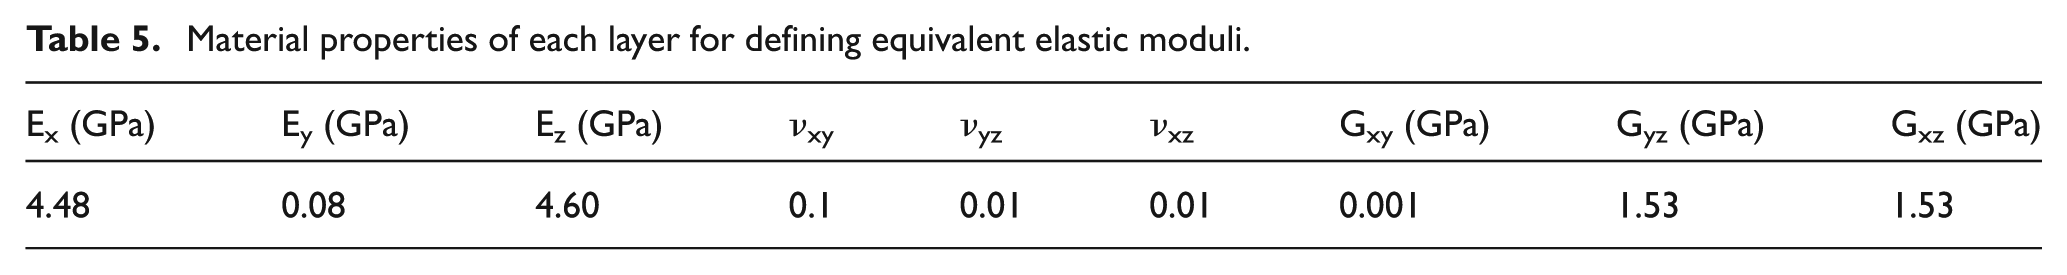
All of the orthotropic properties mentioned were adjusted to result in the same equivalent elastic modulus as the unit cell through FEA. The equivalent elastic moduli of each layer depending on the rotation angle of the layers are shown in Figure 8(a). Figure 8(b) shows the comparison between the unit cell analysis results and homogenization results. The elastic modulus of the stacked material varies with a cycle of 180° and has a good agreement with the unit cell analysis. Table 5 lists the orthotropic properties of each layer that were corrected, and Table 6 lists the homogenized material properties of the stacked composite as a result.
Material properties of each layer for defining equivalent elastic moduli.
Defined equivalent elastic moduli of unit cell.

FEA and experiment for larger lattice structure
FEA model and boundary conditions
A FEA model for the pipe supporter, which has an outer diameter of 3760 mm, an inner diameter of 876 mm, and a thickness of 50.8 mm, was created using ANSYS V14.0, as shown in Figure 9. The pipe supporter consists of a lattice pattern structure and rims. Rims with rectangular cross sections of 19 mm × 19 mm (at the inner and outer edges) and 12.7 mm × 19 mm (at the straight line) were welded with the lattice pattern structure, as illustrated in Figure 9(a). The material properties (elastic modulus: 60.4 GPa, Poisson’s ratio: 0.3, yield strength: 311 MPa) were applied to the rims of the FEA model. The lattice pattern structure was modeled as a plate to which the homogenization results of section “Homogenization process” were applied. For a symmetric boundary condition, two layers of the FEA model have different aligning angles (30° and 150°), which could be identified by the central rhombuses of Figure 9(a). The yield strength of each layer was applied as 23 MPa, which was speculated from the yield strength of the material (311 MPa) and the ratio between the material elastic modulus (60.4 GPa) and the 0° directional equivalent elastic modulus of one layer (4.48 GPa).

(a) Major features and (b) boundary conditions of the pipe supporter.
A thickness direction (the lay-up direction) was defined as the z-axis by a local coordinate system. The plate, which is the lattice pattern structure of the pipe supporter, was meshed with “solid 185” eight-node brick elements, which were defined as a layered solid by an option in ANSYS software. All of the elements were made so as not to exceed the limitation of ANSYS (a certain ratio between the length and width of an element) by applying a bias option to the radial directional lines. The rims were also meshed with “solid 185,” which was defined as a structural solid that is different from the plate.
The back faces of the back side rims were fixed only on the z-axis, the bottom faces of the straight rims were fixed y-axially, and the left and right outer parts of the straight rims were fixed x-axially, as shown in Figure 9(b). The loads were applied to the FEA model through eight areas as 5.58 MPa of pressure, which is an equivalent pressure to 9 ton, considering the loading method in the experiment, because the point load induces an excessive stress concentration in the FEA model. The whole FEA model was divided into 35 parts by considering the displacement measurement locations and loading areas because the dividing process makes it easy to apply boundary conditions and to analyze the FEA results.
Test sample and conditions
The in-plane stiffness experiment for the pipe supporter was performed with the test conditions shown in Figure 9(a). A total of eight actuators were located around the pipe supporter toward its center. The actuators were grouped into four sets and located symmetrically around the arc with 45° intervals. Two actuators of a group were installed at 10° intervals between the actuators. The deformations of the pipe supporter were obtained as displacements by several linear variable differential transformers (LVDTs) that were installed at a total of 12 points around the arc of the pipe supporter. All of the LVDT signal data were acquired through a data acquisition system (SCXI-1000; National Instruments, Austin, TX), which was used for amplifying and noise filtering (low pass filter: 4 Hz) of the signal. Deformations of the pipe supporter and displacements of LVDTs were observed during the experiment while the load was increased gradually by 500 kg in the test up to 9 ton. The prepared experimental system is shown in Figure 10.
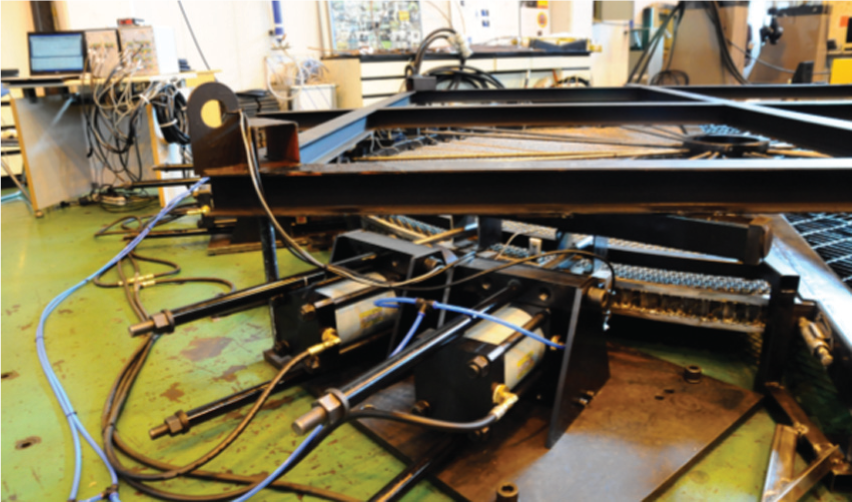
Experimental system for the pipe supporter.
Results and discussions
Comparison between the experiment and the FEA results
The result of the FEA shows a very similar deformed shape to the test result, as shown in Figure 11 (scale factor: 5). The center point of the sample, a center of a circle, is the origin, and the right horizontal line is the base line as the x-axis. Both FEA and experimental results show that the largest deformation is shown at 72.5°and 107.5° of the pipe supporter. There is not much deformation in the outer radial direction due to the lattice pattern of the pipe supporter and the dense boundary conditions. The largest deformation is measured at the location of LVDT 7 in the experiment, as shown in Figures 9 and 11, due to the lowest directional stiffness estimated among loading points according to the unit cell FEA results.

Deformations of the sample from the (a) FEA and (b) experiment results (scale factor: 5).
The locations of LVDT 1 and 12 have the highest directional stiffness, whereas the location of LVDT 5 has the lowest directional stiffness. The locations of LVDTs are arranged in the order of directional stiffness based on the unit cell FEA results: LVDT 1=12 > 2 = 11 > 10 > 9 > 3 = 8 > 7 > 4 = 6 > 5. LVDT 1, 3, 8, and 12 are located between two loading points, and these points show less deformation than loading points, while LVDT 7 and 9 are located at the loading points, as shown in Figure 9(a). The rest of the LVDT positions, 2, 4, 5, 6, 10, and 11, are not loaded directly from an actuator and are located at a further position than the others from the loading points. Therefore, the maximum deformation is shown at LVDT 7, which has a lower directional stiffness than the position of LVDT 9. The FEA result also shows the maximum deformation at the position of LVDT 7, as shown in Figure 11.
Figure 12 presents the load–displacement curves of the pipe supporter from the FEA and the experiment. The load–displacement curves from the FEA show very similar slopes to the experiment at all of the LVDTs. The deformation–load curves of LVDT 3, 4, 6, 7, and 8 show a specific trend in which the load increased slowly early in the experiment. This specific trend can be frequently observed in many standard or structural tests and can be induced by the contact between the sample and jigs. When a test was conducted with an imperfect contact condition, the contact condition becomes early in the progress of the test.
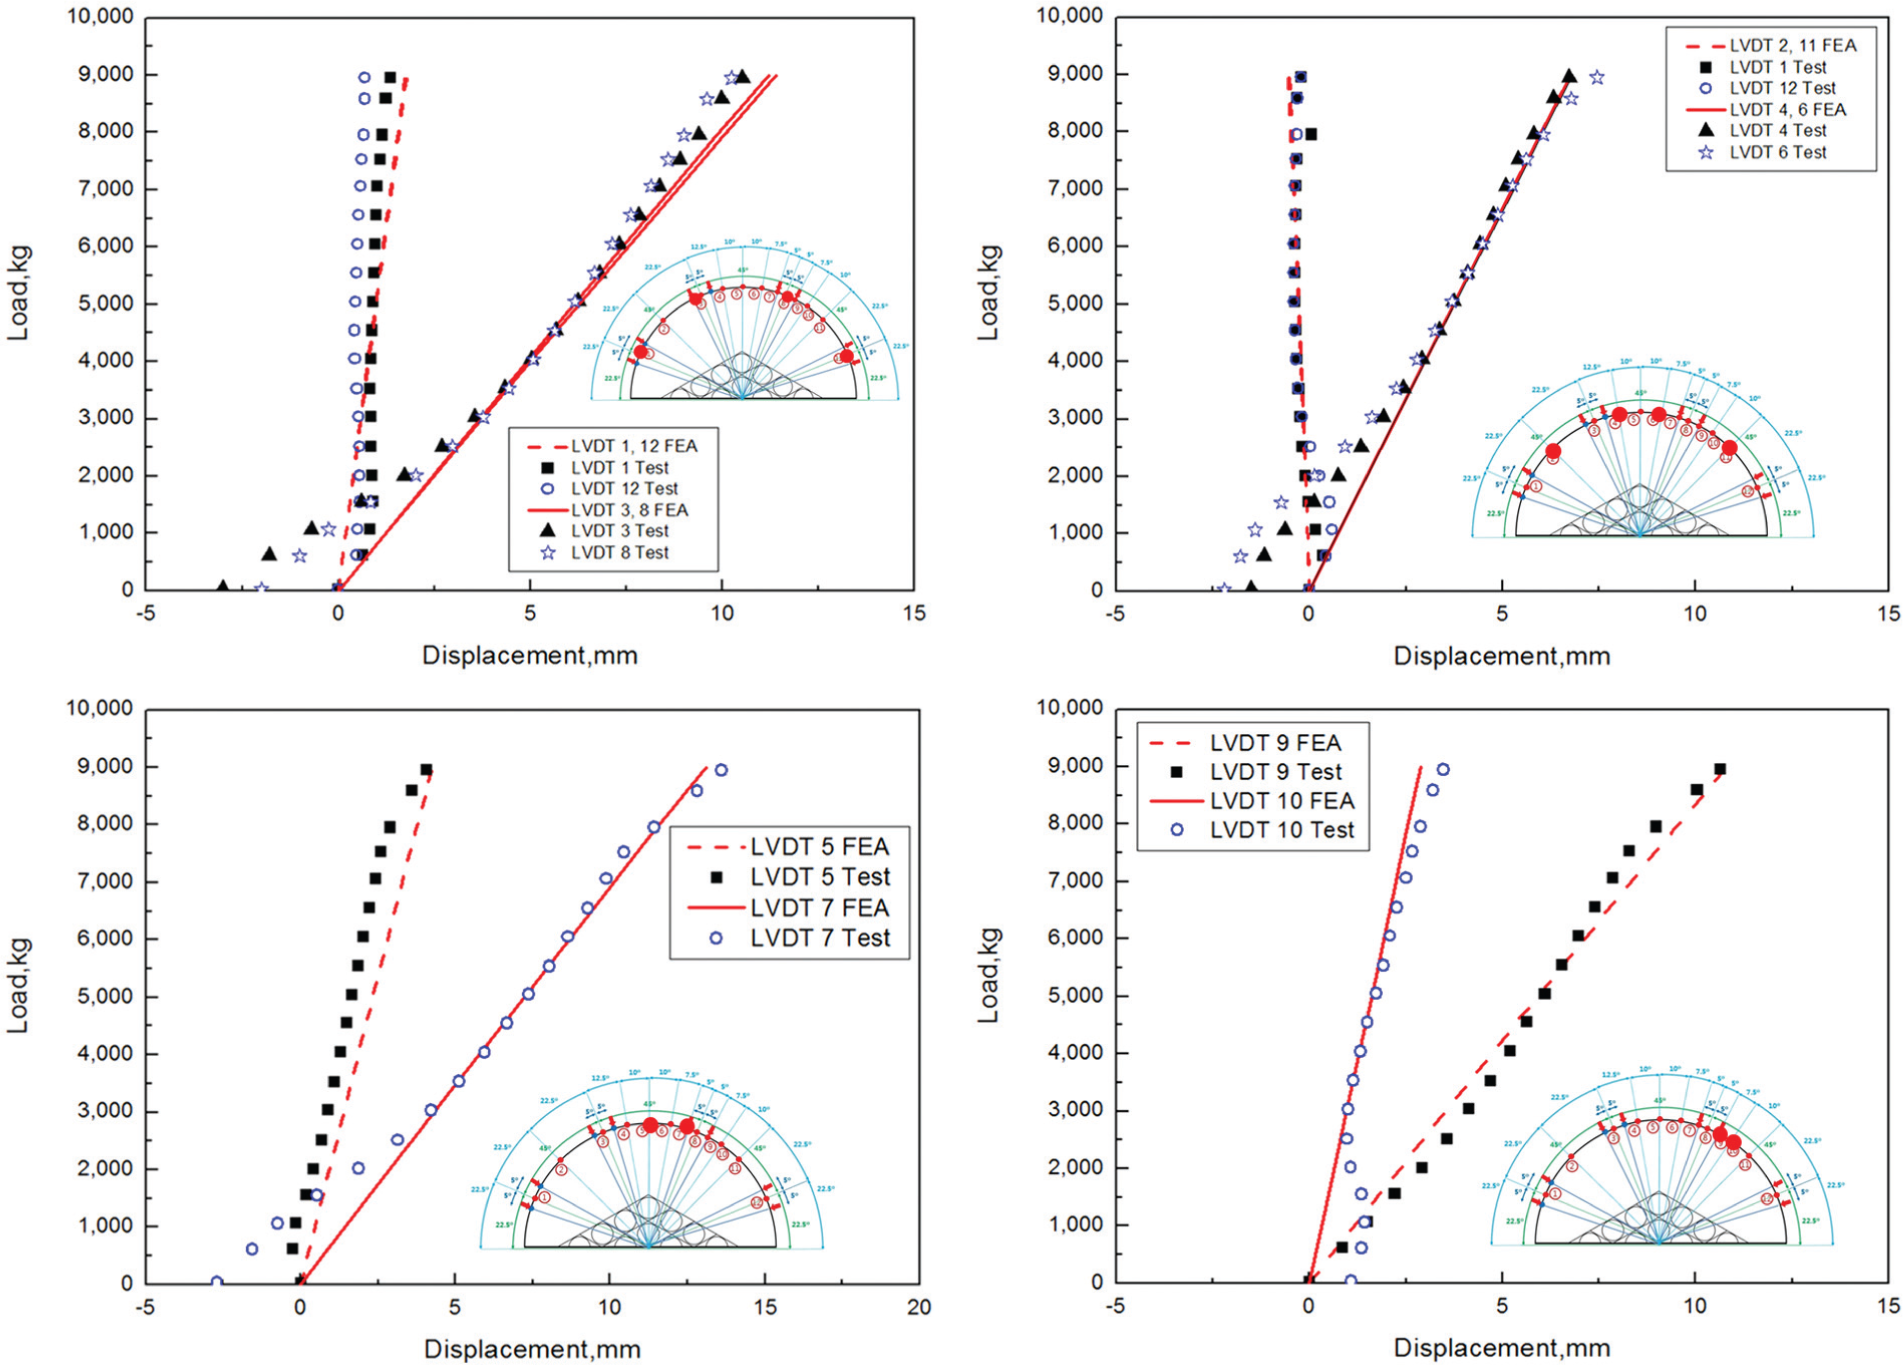
Deformation–load curves at each LVDT from the experiment and the FEA.
The deformation–load curves of LVDT 3, 4, 6, 7, and 8 were translated parallel to the x-axis for revising the effect of imperfect contact. Figure 12 demonstrates that the FEA result matched well with the translated deformation–load curves of the experimental result at all of the LVDTs.
Conclusion
In order to estimate the in-plane stiffness of a large structural component with a lattice structure, the directional equivalent elastic moduli for a unit cell of the lattice structure were numerically estimated. The equivalent elastic moduli were applied to the pipe supporter through a homogenization process. Then, FEA results for the in-plane stiffness were compared and verified with the experimental results. The following is a summary of this study:
The equivalent elastic moduli of rhombus- and rectangle-type unit cells were estimated by the FEA. The size does not affect the equivalent elastic modulus of the rhombus-type unit cell much. However, the rectangle-type unit cell restricts the behavior of the unit cell due to the boundary condition, and it induces an overestimated equivalent elastic modulus of the unit cell;
The estimated equivalent elastic moduli were applied to the lattice structure through a homogenization process, which used the orthotropic material properties and a stacked material. The homogenized directional elastic moduli of the material induced good agreement with the estimated directional equivalent elastic moduli of the unit cell;
The in-plane stiffness of the homogenized large structural component was estimated numerically. Then, the FEA results were compared with the experimental results. As a result, the FEA results using the unit cell and the homogenization described well the in-plane stiffness of the large lattice structural component.
Footnotes
Academic Editor: Shan-Tung Tu
Declaration of conflicting interests
The authors declare that there is no conflict of interest.
Funding
This research was supported by Basic Science Research Program through the National Research Foundation of Korea (NRF) funded by the Ministry of Education (NRF-2013R1A1A2065159).