
Abstract
Multiple aneurysms occur rarely and have not been well investigated. The purpose of this study is to verify whether high rupture risk of multiple aneurysms is due to the interaction between multiple aneurysms’ geometrical characteristics. The following geometrical characteristics were varied in an idealized sidewall-type model: aneurysm a1’s dome-neck length (S), size ratio, inflow angle (α), distance between two aneurysms (D), and the parent vessel’s angle (θ). We varied the parent blood vessel and aneurysm sac a1’s geometrical characteristics to analyze their hemodynamic influence on aneurysm a2. By comparing the influence on aneurysm a2, we found that parent blood vessel geometrical characteristics such as the distance between aneurysms (D) and the parent vessel’s angle (θ) were the most hemodynamically influential characteristics examined. The impact of varying the aneurysm’s geometrical characteristics such as dome-neck length (S), size ratio, and inflow angle (α) was not obvious. The reason for the higher rupture rate of multiple aneurysms is not due to interactions between the aneurysm sacs but due to factors of each individual aneurysm.
Keywords
Introduction
The cerebral aneurysm is a very serious disease and captures more and more attention of researchers. The rupture of cerebral aneurysm may lead to aneurysmal subarachnoid hemorrhage (SAH) and, consequently, severe disability or death. It has been found that approximately 5% of the population has such lesions, 1 and 20%–34% of these persons have multiple intracranial aneurysms. 2 Patients harboring multiple intracranial aneurysms are at a higher risk of rupture and a poor outcome than those with a single aneurysm. Many researchers believe that complex treatment management and complications from hemorrhage contribute to a poor outcome, but the exact justification for the high rupture rate of the multiple aneurysms remains unclear.3,4
The reasons for aneurysm initiation, growth, and rupture are complicated and are still not well understood. Generally, it is recognized that hemodynamics play a key role in these processes. 5 Ideas about aneurysm growth and rupture can generally be divided into two theories: high flow theory and low flow theory. 5 The high flow theory speculates that high wall shear stress (WSS) and high flows cause endothelial injury and thus initiate wall remodeling and potential degeneration. The low flow theory suggests that low flows within aneurysms cause localized stagnation of blood flow against the wall in the dome, triggering a dysfunction of flow-induced nitric oxide and wall-degrading inflammatory processes. Both theories capture the importance of the interaction between the hemodynamic environment within the aneurysm and the cellular elements of the wall in wall weakening. Most researchers believe that high WSS, high wall pressure, and high pressure gradient contribute directly to aneurysm growth, and that aneurysm rupture is intimately related to low WSS.6,7
To date, only a few articles have analyzed multiple aneurysms, and most of these articles focused on risk factors for multiple aneurysm genesis. Østergaard and Høg 8 and Qureshi et al. 9 used multivariate analysis to understand independent risk factors for multiple aneurysms, such as age, gender, genetics, and smoking, among others. Other studies of multiple aneurysms also have focused on risk factors and have produced conflicting results.10–13 Since hemodynamics, which strongly depend on the vascular geometry, play a key role in aneurysm growth and rupture, the geometrical characteristics seem to be an important factor in predicting rupture risk. The influences of aneurysm geometry characteristics on the rupture of single aneurysms have been discussed in the literature, including aneurysm size,14–18 shape,19–21 size ratio (SR) (height/width), 22 section size, 21 and inflow angle. 23 However, few articles have analyzed the reasons for the higher rupture rate of multiple aneurysms. The reasons may be as follows: on one hand, multiple aneurysms are composed of several single aneurysms. This results in a higher probability of breakage due to the complex hemodynamic environment of each. On the other hand, the geometric variations in one aneurysm may influence the hemodynamic environment of another. Thus, it is necessary to quantitatively analyze the influence of geometrical characteristics of one aneurysm on the hemodynamic factors of another to investigate the reason.
In contrast to previous studies, we conducted a hemodynamic simulation of multiple aneurysms using computational fluid dynamics (CFD) analysis. Our study aims to identify the hemodynamic influence between aneurysm sacs by varying the geometrical characteristics of one and studying its influence on another. We also analyzed variations in the parent vessel’s geometrical characteristics for comparison. Using the data, we are able to better understand the reasons for the high rupture rate of multiple intracranial aneurysms.
Materials and methods
Aneurysm model geometry
The locations at which intracranial aneurysms usually occur are shown in Figure 1(a). Two types of aneurysms occur most frequently: bifurcation-type aneurysms, in which the aneurysm develops at a branching point (Figure 1(b)); sidewall aneurysms, in which the aneurysm develops on the sidewall of the arteries, usually at the curves of arterial bends (Figure 1(c)).

(a) Typical locations of intracranial aneurysms; aneurysms classified by the aneurysm locations: (b) bifurcation and (c) sidewall.
As Lauric et al. 22 argued that the hemodynamic factors of bifurcation-type aneurysms are not influenced by changing geometric characteristics such as the SR, we focused on sidewall aneurysms in this research. In addition, because 90% of multiple aneurysms are composed of two single aneurysms, 24 we simplified the multiple aneurysms model with two aneurysm sacs. The brain artery was designed to be a smooth blood vessel with two bends. The diameter of the artery is 4 mm, and the thickness of the blood vessel is 0.3 mm. Two identical saccular aneurysm sacs a1 and a2 are located at the outward curve of the arterial bends (Figure 2).

Simplified and standard aneurysm model with boundary conditions. a1 and a2 are the same aneurysms located at the different outward curves of arterial bends. Upstream of aneurysm is the segment between inlet and the center line of aneurysm neck. Downstream of aneurysm is the segment between the center line of aneurysm neck and outlet. Inner bend is marked by blue curve, and outward bend is marked by red color curve.
CFD
The simplified model was imported into ICEM CFD software (ANSYS, Inc.) to generate volumetric finite-element grids used for CFD calculation. Unstructured grids of tetrahedral elements were generated part by part with different mesh densities. To verify mesh independence, different numbers of tetrahedral elements were computed. After comparing the results, we used a grid with around 3 million tetrahedral elements for the simulation.
The fluid was assumed to be Newtonian and incompressible, with a density of 1060 kg/m 3 and a viscosity of 0.004 Pa s. In fact, as described by Li et al., 25 researchers had demonstrated that the simulation results under Newtonian and non-Newtonian conditions are similar. The boundary conditions at the walls of the geometries were assumed to be rigid with no slip. The pressure outlet boundary is assigned a value of P = 0 Pa (Figure 2). The velocity input at the inlet boundary condition is marked with red arrows, which is defined as Womersley flow. The magnitude of Womersley profile is calculated as follows.
The scaled waveform of time-varying flow rate Q(t) (Figure 3(a)) is calculated and defined by Kono et al. 26 Given the fundamental frequency w for this flow rate


(a) Womersley velocity profile used as the inlet boundary condition. The curve shows the time variation in the flow rate Q(t). Six time step points are selected and shown: A, t = 0.92013 s; B, t = 1.01014 s; C, which is also the systolic time*, t = 1.18083 s; D, t = 1.24425 s; E, t = 1.42709 s; and F, which is the diastolic time*, t = 1.84 s. (b) The corresponding parabolic radial velocity contours at those six points.
The Womersley velocity profile for the axial component of velocity at a specific time, W(r, t), is derived from the following expression

where R is the radius of the cylinder; J0 and J1 are the Bessel functions of the first kind for orders 0 and 1; and
Considering the pulse cycle independence, two cardiac cycles were calculated, and the second cardiac cycle was selected for the analysis. Six time step points with the corresponding parabolic velocity contours were shown: A, t = 0.92013 s; B, t = 1.01014 s; C (the systolic time), t = 1.18083 s; D, t = 1.24425 s; E, t = 1.42709 s; F (the diastolic time), t = 1.84 s (Figure 3(b)). The peak Reynolds number at the systolic pressure was calculated as 444. Since this number was lower than 2300, we assumed the flow to be laminar. The simulations were performed using the FLUENT solver (ANSYS, Inc.). A cycle of 1000 time steps was set, with each step lasting 0.00184 s.
Geometrical characteristics
Several geometrical characteristics of the proposed multiple aneurysms model were defined (Figure 4). For the first aneurysm sac, we selected three geometrical characteristics as representative. The section length, S, was defined as the length of the dome neck in a cross section. The SR was defined as the ratio of the height over the width within the aneurysm sac. Angle α was defined as the angle change in aneurysm a1 relative to the initial position. For the geometrical characteristics of the parent blood vessel, we selected two factors. The distance, D, was defined as the distance between the two middle points of the aneurysm neck lines in a cross section. Angle θ was defined as the angle between the middle period of the blood vessel and two parallel blood vessels. Standard model was made as reference with dimensions of S = 3 mm, SR = 1.5, α = 0°, D = 8 mm, and θ = 30° (Figure 2).

Schematic illustrating isolated changes in geometrical characteristic.
Simulation design
In order to verify whether there is influence between sacs of multiple aneurysms, we conducted simulations on three different models to compare: a blood vessel with no aneurysm, a blood vessel with a single aneurysm (a2), and a blood vessel with two aneurysms (a1 and a2). These three models were built with the same dimensions based on the standard model and the boundary conditions were all the same for simulation.
Then simulations were designed to compare the influence on hemodynamic factors of one aneurysm by varying the geometrical characteristics of another aneurysm and parent blood vessel. CFD simulations were performed by varying each of these geometrical characteristics and fixing the others each time. And for each characteristic, four different values were selected according to the reference dimensions of the standard model. All the boundary conditions were the same as described previously. The variations in geometrical characteristics that were considered are shown in Table 1.
Dimensions of isolated variation in geometrical characteristics.
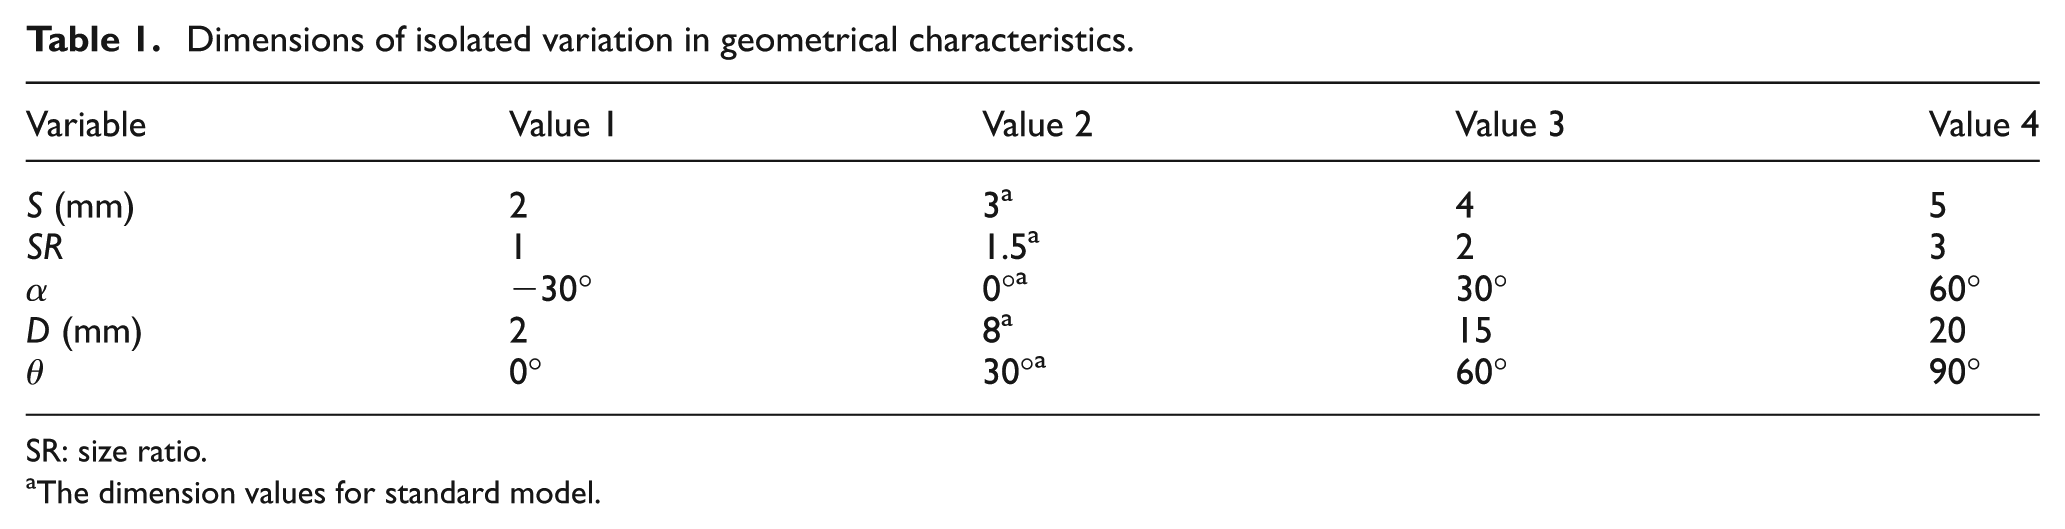
SR: size ratio.
The dimension values for standard model.
Results and discussion
CFD simulations including velocity streamline, WSS, relative wall pressure, and pressure spatial gradient on three different models are conducted (Figure 5). Row (a) shows the hemodynamic results for no aneurysm case, while rows (b) and (c) correspond to the single aneurysm and double aneurysm cases, respectively. The first column shows the velocity streamlines at the systolic time for each case. The magnitude of the velocity in the center of the blood vessel was larger compared with the boundary area, and the largest velocity appeared at the inner bend area around aneurysm a2 for all cases (about 1.166 m/s). Relative to (a), the streamlines for both (b) and (c) had random perturbations near sac a2. The greatest difference in streamline distribution occurred in case (c), which showed a vortex flow in aneurysm a1. The second column shows the WSS at the diastolic time. The WSS magnitude and distribution around a2 were the same for all the three cases. For the pressure and pressure gradient, the situations were similar to WSS. Even though the area around the neck of a1 showed a larger value, the hemodynamic results around aneurysm a2 for the multiple aneurysms model were all the same with the single aneurysm model and the model with no aneurysm. From this, we conclude that the influence between sacs of multiple aneurysms might be negligible.

Comparison of hemodynamic results under three different models case—row (a): blood vessel with no aneurysm; row (b): blood vessel with one aneurysm a2; row (c): blood vessel with two aneurysms sacs a1 and a2. All three models have the same geometrical characteristic dimension with the standard model. First column: the streamline at systolic time; second column: wall shear stress at the diastolic time; third column: wall pressure at the systolic time; forth column: pressure gradient at the systolic time.
From the simulation results (Figure 5), the maximum values of WSS, wall pressure, and pressure gradient appeared near the neck area downstream of aneurysm a1. The downstream region of the aneurysm a2 neck also showed higher values of WSS. The top of the aneurysm sac showed the lowest WSS value. Most researchers believe that high WSS, high wall pressure, and high pressure gradient contribute directly to aneurysm growth, while aneurysm rupture is related to low WSS.6,7 Thus, we predicted that the neck area at downstream of the aneurysm is the starting position for aneurysm enlargement, and the rupture position is somewhere on the top of the sac dome. Since aneurysm rupture is a complicated process involving mechanical and biological factors, we will do simulations using the fluid–structure interaction (FSI) method to examine the rupture point in the near future.
Further simulations were completed by varying the geometrical characteristics in Table 1. Since aneurysm rupture is related to low WSS, high velocity impact, high wall pressure, and high pressure gradient, we analyzed and compared the hemodynamic results with WSS at diastolic time and velocity, pressure, and pressure gradient at systolic time. The hemodynamic results were as follows.
Velocity vector distribution for the aneurysm models on geometry middle section at peak systolic time is shown (Figure 6). The velocity of the blood flow is a fundamental factor for the hemodynamic environment. As described by Baek et al., 27 the impact of the blood flow on the blood vessels produces three different physiological stresses. One is the WSS, which is the friction stress produced by viscous blood flow through the blood vessel. The WSS direction is parallel to the blood vessel. The second stress is the transmural pressure (wall pressure), which is the ring wall static body pressure caused by the blood. The direction of the wall pressure is perpendicular to the blood vessel. The third stress is the mechanical stretch, which is also called ring wall tension, and is the wall tension formed by the blood pressure. The velocity vectors of the blood flow have close associations with these three stresses, and the WSS and wall pressure are discussed in this article. In future research, we intend to also analyze the impact of mechanical stretch using an FSI method. Figure 6 shows that the blood flow in the center of the blood vessel has larger velocity than the blood flow near the wall. The inner side of the curvature around a2 showed the greatest velocity. The aneurysm sacs had little internal flow, with varying flux due to the varying geometrical characteristics. When varying the geometrical characteristics of S, SR, and α on a1, the flux in a1 was greatly changed, while there was still no difference for the sac a2. When varying the parent geometrical characteristics of D and θ, not only was the flux in sac a1 different but also it was different in sac a2.

The velocity vector contour on middle section at peak systolic time by varying geometrical characteristics with four different suitable values. The other geometrical characteristic dimensions were fixed with the value of standard model dimension each time. Arrows show the greatest difference of flux in aneurysm sac a2.
The neck area at the downstream of the aneurysm showed high WSS and pressure values and may most likely be the start position for aneurysm enlargement. We defined two points, point 1 (P1) and point 2 (P2), on aneurysm sacs a1 and a2, respectively (Figure 7(a)). The hemodynamic values of these two points during the pulse cycle under different geometrical characteristics were analyzed. In order to show the distribution of the hemodynamic factors, we also defined two polylines (L1 and L2) along the middle section of each aneurysm sac. P1 and P2 represent the starting points of these two lines, and the top point on each sac is the ending point. And these two lines are the same length of 12 mm.

(a) Points and lines defined on a1 and a2 based on WSS contours. Line 1 (L1) is defined as the line between point 1 (P1) and top point on sac a1, and line 2 (L2) is defined as the line between point 2 (P2) and top point on sac a2. The length for both two lines is 12 mm. (b) First column, WSS distribution along L1 on aneurysm a1 since geometrical characteristics varied. Second column, WSS distribution along L2 on aneurysm a2 since geometrical characteristics varied. Third column, WSS magnitude varied during two cardiac cycles on P1 under different geometrical characteristics. Fourth column, WSS magnitude varied during two cardiac cycles on P2 under different geometrical characteristic conditions.
The WSS distribution along L1 and L2 at the diastolic time and the WSS variation at P1 and P2 over the pulse cycle for each geometrical characteristic variation were conducted (Figure 7(b)). The first column shows the WSS distribution along L1 on aneurysm a1, since the geometrical characteristics for a1 and the parent blood vessel were varied. The third column shows the WSS magnitude variation over two cardiac cycles at P1. These two columns show significant variation in WSS at aneurysm sac a1 when changing a1 and the parent blood vessel’s geometrical characteristics. The largest variation occurred when altering aneurysm a1’s inflow angle α (about 317%), while the smallest was for D (81.8%). These data are consistent with previous studies on single aneurysms.14–18,22
The current objective is to evaluate the mutual influence between aneurysm sacs. (More specifically, to evaluate the hemodynamic factor’s variation in aneurysm a2 caused by changing the geometrical characteristics of a1.) The hemodynamic factor variation caused by changes in the geometrical characteristics of the parent blood vessel was analyzed for comparison.
The second column (Figure 7(b)) shows the WSS distribution along L2 on aneurysm a2. When aneurysm a1’s section size, S, increased from 2 to 5 mm, the largest WSS value along L2 on a2 decreased from 7.99 to 7.09 Pa, a variation of 12.7%; when a1’s SR changed from 1 to 3, the largest WSS value was reduced from 7.60 to 6.83 Pa, a variation of 11.3%; when a1’s inflow angle, α, changed from −30° to 60°, the largest WSS value increased from 5.88 to 6.46 Pa, a variation of 9.9%. For the parent blood vessel, when D increased from 2 to 20 mm, the largest WSS value increased from 2.33 to 7.46 Pa, a variation of 220.2%; when a1’s blood vessel angle θ changed from 0° to 90°, the largest WSS value varied from 2.97 to 19.34 Pa, a variation of 551.2%, which is about six times the initial value. So, compared with the parent blood vessel’s geometrical characteristics, the variation of WSS on a2 caused by changing a1’s geometrical characteristics was negligible. Also, when changing aneurysm sac a1’s geometrical characteristics, the WSS value variation on a2 was insignificant compared with the variation of a1 itself. The fourth column shows the WSS magnitude variation over two cardiac cycles at P2. This gives a similar conclusion that the WSS variation at P2 in a2 was caused by changes in the parent blood vessel’s geometrical characteristics, not those of aneurysm a1.
The wall pressure distribution along L1 and L2 at the systolic time was conducted (Figure 8(a)). The first column (Figure 8(b)) shows the pressure distribution along L1 on aneurysm a1. The variations were very significant, with a largest value of 223.5% when the parent blood vessel angle θ was varied. The smallest variation occurred when SR changed from 1 to 3 (19.2%). The second column (Figure 8(b)) shows the pressure distribution along L2 on aneurysm a2. The variations due to changes in a1’s geometrical characteristics were as follows. For S, the largest pressure value varied from 342.6 to 364.4 Pa, a variation of 6.4%. For SR, the pressure changed from 310.1 to 292.6 Pa, a variation of 6.0%. For the inflow angle α, the largest value increased from 375.1 to 378.5 Pa, a variation of only 0.9%. The variations due to changes in the parent blood vessel characteristics were as follows. When D increased from 2 to 20 mm, the largest pressure value increased from 263.1 to 497.5 Pa, a variation of 89.1%; when a1’s blood vessel angle θ changed from 0° to 90°, the largest WSS value varied from 284.2 to 592.8 Pa, a variation of 108.6%.
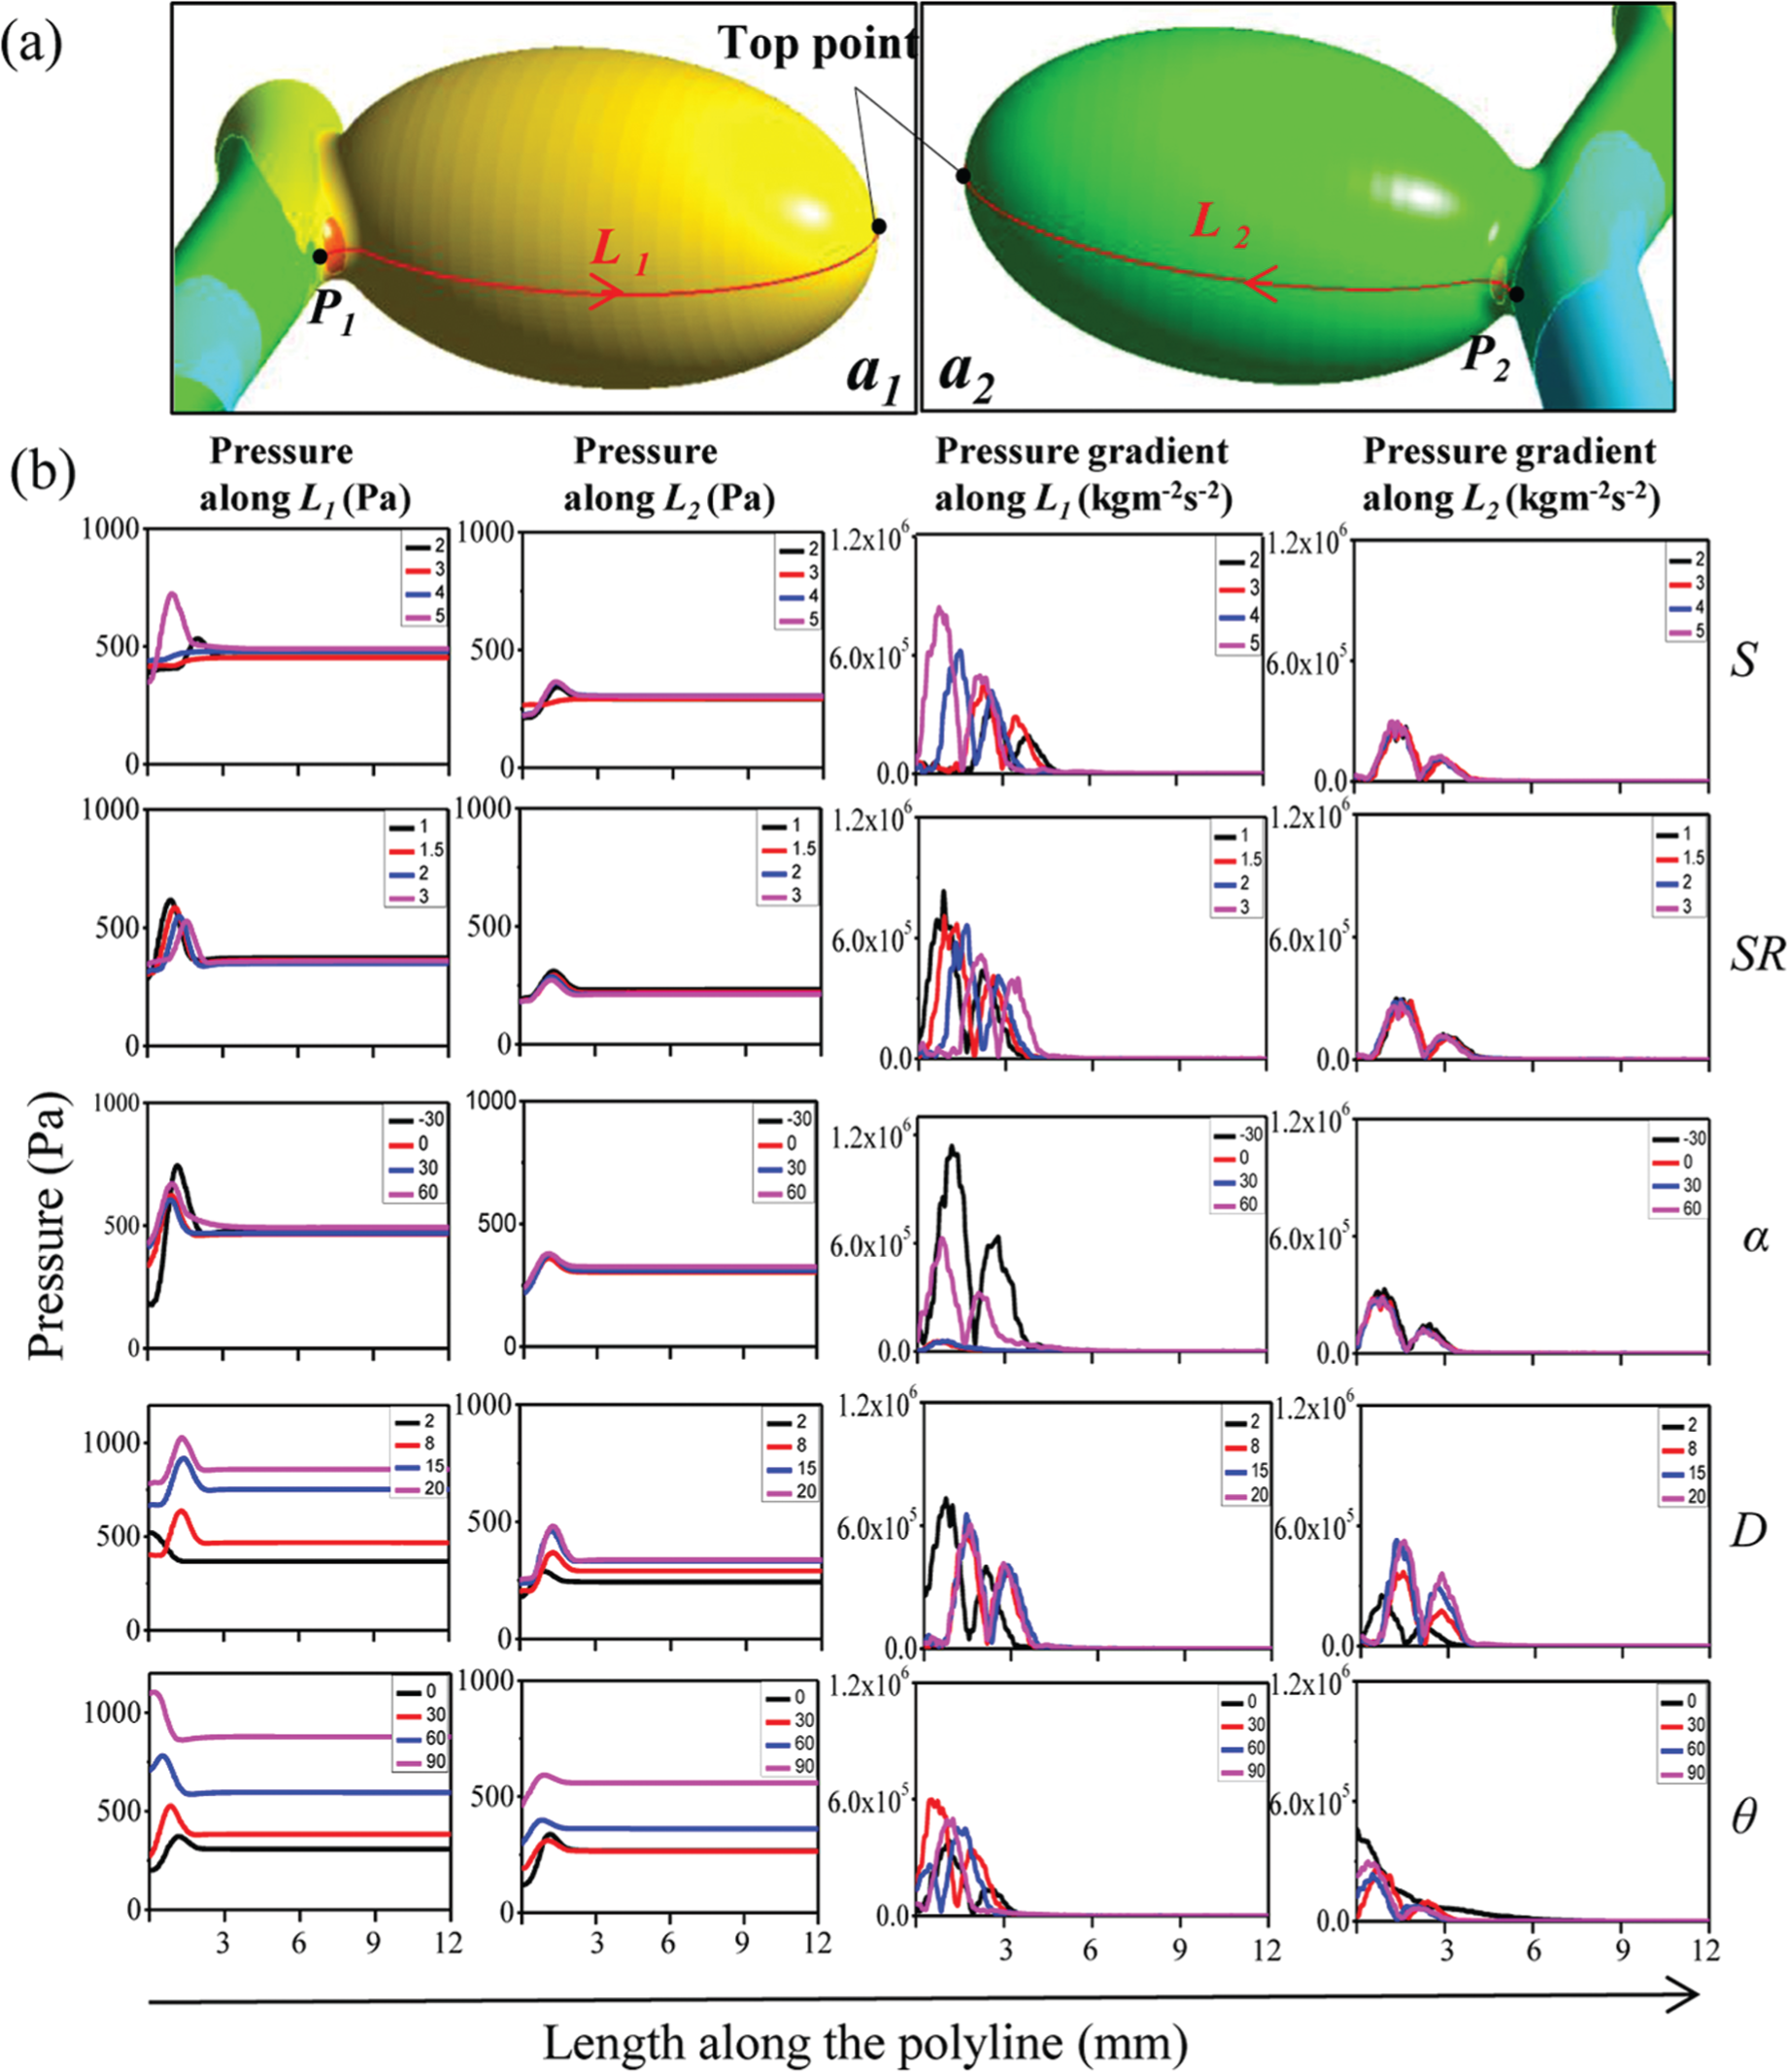
(a) Points and lines defined on a1 and a2 based on pressure contours. Lines are the same with previous definition. (b) First column, pressure distribution along L1 on aneurysm a1 since geometrical characteristics varied. Second column, pressure distribution along L2 on aneurysm a2 since geometrical characteristics varied. Third column, wall pressure gradient variation trend along L1 on aneurysm a1 since geometrical characteristics varied. Fourth column shows wall pressure gradient variation trend along L2 on aneurysm a2.
The third column (Figure 8(b)) shows the wall pressure gradient variation trend along L1 on aneurysm a1. The pressure gradient magnitude variation was 347.8% for S, 45.1% for SR, 1275% for α, 87.5% for D and 51.2% for θ. The fourth column (Figure 8(b)) shows the wall pressure gradient variation trend along L2 on aneurysm a2. The variation magnitude was 1.82% for S, 6.41% for SR, and 8.52% for α for changes in a1. The pressure value variations were 107.3% for D and 76.1% for θ for changes in the parent blood vessel.
The data show that the pressure and pressure gradient have the same effect as WSS. When the geometrical characteristics of aneurysm sac a1 varied, the hemodynamic factors in aneurysm a1 were influenced significantly, while no influence was observed on aneurysm sac a2. Compared with the influence caused by variations in the parent blood vessel, the influences caused by the variations in aneurysm sac a1 were negligible. This indicates that, in multiple aneurysms, the morphology of one aneurysm has little influence on another. Thus, the influence between aneurysm sacs may be not the reason for the higher rupture rates of multiple aneurysms.
In this research, we generated unstructured meshes on idealized models to construct an approximation and to perform numerical integration based on the traditional finite element method (FEM). We also verified mesh independence to ensure the accuracy of the simulation. While dealing with some patient-specific models, it is quite difficult to generate high-quality meshes and the process is cumbersome and time consuming. The isogeometric analysis (IGA) method using computer-aided design (CAD) model data reduces the time and difficulty of the preprocessing step significantly. 28 The IGA offers a much more direct analysis route to couple with immersed and boundary element methods without generating meshes, which is more simple than the traditional FEM. The IGA is also limited by the CAD model quality, since most current IGA methods are based on volumetric models. 29 Recently, another attractive alternative is the meshless method, which discretizes the incompressible flow governing equations by making use of point clouds.30,31 Without relying on stencils, elements, or control volumes, meshless methods also do not require mesh generation. This not only simplifies the costly and time consuming process but also avoids various topological and connectivity problems. The limitations for most meshless methods are the stability issues at boundary sites or internal points of increased complexity. 30 A meshless point collocation method is adopted to discretize the governing partial differential equations to avoid the stability issues. 32 As described by Jin, 33 the point collocation method is a simple, efficient, and flexible meshless method for interior domain numerical analysis. However, the clouds’ quality and aspect ratio need to be considered to improve the robustness of the point collocation method. IGA combined with boundary elements and point collocation meshless methods provides good references for researchers when they deal with complicated patient-specific models.
There are some limitations to this study. First, aneurysm rupture is a complicated process composed of several factors, and we do not know the exact values of the geometric characteristics that lead to rupture. Additionally, during the CFD analysis, we defined a rigid wall boundary condition, while in actuality, the blood vessels are in a physiologic state of dynamic change, so that the angle θ varies with time, which is fairly difficult to simulate. Finally, aneurysm enlargement and rupture involve an interaction between the blood and the wall of the blood vessel. On one hand, the blood flow impacts the wall to produce transmural pressure; on the other hand, the wall will react to the flow. Consequently, we would like to use the FSI method to obtain more accurate results in the future.
Conclusion
This study shows that parent blood vessel geometry characteristics such as the distance between aneurysms and the blood vessel’s angle have significant hemodynamic influence on sidewall-type multiple aneurysms. In contrast, the aneurysm geometry characteristics of one aneurysm, such as section length of the dome-neck (S), SR, and inflow angle (α), do not influence a second aneurysm’s hemodynamic environment. Stated another way, the morphology of a first aneurysm does not highly influence the rupture risk of a second. The reason for the higher rupture rate of multiple aneurysms is not due to interactions between the aneurysm sacs but to factors of each individual aneurysm. Further research will help us to gain a better understanding of multiple aneurysms and provide value for clinical medical assessment and treatment.
Footnotes
Academic Editor: Stephane PA Bordas
Declaration of conflicting interests
The authors declare that there is no conflict of interest.
Funding
This research was supported by the Basic Science Research Program through the National Research Foundation of Korea (NRF) funded by the Ministry of Education (2013R1A1A2058710).