
Abstract
This article presents a particle-tracking velocimetry experiment for studying internal flows of hydrodynamic torque converter whose guide vanes are adjustable. The torque converter in which the flow region is an enclosed space with multiple impellers has a complicated geometry of impellers. Complex flows in adjustable stator are experimentally analyzed using particle-tracking velocimetry, and some advanced measurement technique has been successfully applied. Under each opening, using the single-frame and triple-exposure method, images of the flow fields in the adjustable stator were recorded at three typical working conditions as the speed ratios were equal to 0 (stall), 0.5 (design), and 1 (idle). According to particle trajectories on the images, the displacements and corresponding velocity vectors were obtained. The internal flow pattern of the hydrodynamic torque converter with adjustable guide vanes were acquired and analyzed in two cases: the changing conditions under the same opening and the changing openings under the same condition.
Keywords
Introduction
Hydrodynamic torque converter with adjustable guide vanes, which has an adjustable ring at the torus, is different from hydrodynamic torque converter with fixed guide vanes. Its different output characteristics obtained at different adjustment positions of guide vanes contribute to the stepless speed regulation. As its different output features, the maximum efficiency and torque ratio can be obtained by adjusting the guide vanes to a proper position. It contains two aspects of transmission quality, namely, automatic adaptation and adjustable capacity. Nowadays, it is widely applied in the environment requiring speed control, such as the variable-speed and constant-frequency wind turbine, which can overcome the low-voltage ride-through problem and facilitate the direct interconnection in synchronous generator. 1
A hydrodynamic torque converter has a complex three-dimensional geometry and a wide range of operating conditions, which make it difficult to analyze its internal flow. The internal flow significantly determines the output characteristics of a hydrodynamic torque converter, so it is important to analyze its internal flow. So far, several numerical simulation and experimental studies have been applied to investigate the flows inside the hydrodynamic torque converter passages. As the development of computational fluid dynamics (CFD), numerical simulation has been made to predict the flow field.2–4 Kim et al. made a performance estimation model for a hydrodynamic torque converter using correlation between the internal flow field and energy loss coefficient. Their model was based on the change of the operating condition due to variation of the energy loss coefficient and the least mean square method. 5 De la Fuente et al. 6 numerically simulated and analyzed the characteristics of a three-dimensional, incompressible, turbulent, unsteady flow within a hydrodynamic torque converter. Discrepancies between the steady and unsteady simulations were found and discussed. Jung et al. 7 improved the accuracy of prediction for performance in the way of parametric study on the numerical scheme and the mesh resolution. Woźniak et al. 8 concluded that outlet flow of the pump showed a little dependence on the turbine relative position by analyzing the internal transient flow in the gap between pump and turbine. The above references have illustrated the great advances in internal flow analysis of torque converters by CFD approach. However, due to the complexity of internal flow, the experimental velocity distributions of the internal flow are supposed to verify the computational results.9,10
Flack used a laser velocimetry to map out the average and periodic three-dimensional velocities in different planes in the pump, turbine, and stator. The overall performance parameters such as mass flow rates, slip factors, vorticities, and torque distributions were derived. 11 Kraus et al. studied the unsteady flow field at the pump–turbine interface of a hydrodynamic torque converter with laser Doppler velocimetry (LDV). The results were compared to unsteady results for a previously examined torque converter with a small-radius ratio to determine the effect of parametric geometric changes on the flow field. 12 Generally, the flow field measurement provides the accurate information inside a hydrodynamic torque converter, while the numerical simulation is an economically feasible method with a lower accuracy.
Due to the rotation of the adjustable guide vanes, the internal flow of a hydrodynamic torque converter with adjustable guide vanes is more complex. So far, few studies have investigated the flow field inside a hydrodynamic torque converter with adjustable guide vanes. Particle-tracking velocimetry (PTV) is a noncontact, transient, and dynamic measurement method, which has always been used to directly measure the entire flow field of turbo-machinery. In this article, PTV approach is employed to nonintrusively measure the internal flow velocity in an adjustable stator of a plexiglas model exactly the same type to the hydrodynamic torque converter with adjustable guide vanes. The PTV algorithm based on single-frame and triple-exposure technique could effectively avoid the ambiguities of velocity orientation. Velocity fields are acquired by edge detection method based on the Canny algorithm as well as image calibration technology. The flow fields under the different opening and operating conditions are analyzed which are according to the results of image processing. The complex vortex phenomenon in the adjustable stator passage is discussed. Reasons for increased energy loss of the hydrodynamic torque converter with adjustable guide vanes under off-design conditions are analyzed. The obtained research results will lead to the improvement of accuracy in numerical modeling of the flow field in the hydrodynamic torque converter with adjustable guide vanes.
Experimental system of PTV
PTV algorithm
The fundamental principle of PTV is to acquire the velocity of tracer particles in images obtained at different times. The distance between the two positions of the same particle in two images can be acquired as the motion displacement of a particle within the interval time
Experimental setup
As shown in Figure 1, the experimental setup is composed of mechanical part, optical part, the image recording and display part, and a transparent specimen. The mechanical part consists of an alternating current (AC) motor, a disk brake, a gear pump, and a rotational speed measurement instrument. The optical part is composed of a 300-mW argon ion laser, optical components, a control motor, and a pulse disk. It is used to produce a continuous adjustable laser. The continuously adjustable pulse light source is 50–150 mm high and 1–10 mm wide. Exposure time of the tracer particles in the flow field can be regulated by adjusting the speed of the pulse disk at the direct current (DC) motor. Aluminum powder with the size of nearly 0.04 mm was selected as the tracer particles. The image recording and display part includes a high-definition camera, an image acquisition card, and acquisition software.

Experimental system of particle-tracking velocimetry.
Figure 2 shows the transparent hydrodynamic torque converter with adjustable guide vanes used in the experiment. Its maximum diameter is 320 mm. It has four active impellers: pump, turbine, fixed stator, and adjustable stator. The model made by plexiglas is transparent. The internal regulation mechanism was designed to adjust the guide vanes of the adjustable stator. Thus, it is convenient to record the images of internal flow field of the adjustable stator under different openings. During the experiment, the torque converter with adjustable guide vanes was filled with pure water. Water was cycled continuously from the pump, turbine, and fixed stator to the adjustable stator, so that the hydrodynamic torque converter with adjustable guide vanes could continuously maintain the operation.

Transparent hydrodynamic torque converter with adjustable guide vanes: (a) cross-sectional view and (b) plexiglas model.
Image acquisition and processing
Image acquisition
Before the experiment was conducted, the rotation angle of the adjustable guide vane was divided equally from the full-open position to the full-closed position. The experiment was then conducted at different working conditions with corresponding openings. Figure 3 displays the adjustable guide vanes at the full-open position and the full-closed position. When the vanes rotate for 40° from the full-open position, the flow passage is full closed. Test points were selected within the rotation angle from 0° to 40°. x is defined as the opening of the adjustable stator,

Adjustable stator at the opening of 0 and 1: (a) full open x = 0 and (b) full closed x = 1.
Given that the adjustable stator has a significant effect on the performance of the hydrodynamic torque converter with adjustable guide vanes, the behaviors of internal flow field of the adjustable stator were measured. Pump speed was constant at 100 r/min throughout the experiment, and the images were recorded at the openings of 0, 0.5, and 1. For each opening, the internal flow fields of the adjustable stator were measured at the stall (i = 0), design (i = 0.5), and idle (i = 1) conditions. i = Nturbine/Npump, where N is the rotating speed (r/min). As the adjustable stator is a centripetal wheel, watching from the axial plane (along the torque converter rotating axis section), the flow of the adjustable stator wheel runs from the long-radius direction to the small-radius direction. Figures 4–6 show the recorded images of the adjustable stator at the openings of 0, 0.5, and 1. All the recorded images were obtained by the image capture software Pinnacle Studio v8.3.

Particle images of adjustable stator at the opening of 0: (a) stall condition (i = 0), (b) design condition (i = 0.5), and (c) idle condition (i = 1).

Particle images of adjustable stator at the opening of 0.5: (a) stall condition (i = 0), (b) design condition (i = 0.5), and (c) idle condition (i = 1).

Particle images of adjustable stator at the opening of 1: (a) stall condition (i = 0), (b) design condition (i = 0.5), and (c) idle condition (i = 1).
Image processing
The recorded images were processed to obtain the displacements of tracer particles and the velocity vector of the internal flow field in the adjustable stator. The image processing scheme is shown in Figure 7. The flow image recorded at the opening of 0 under idle condition (i = 1) in Figure 4(c) is served as an example to elaborate on the extraction method of the internal velocity field.
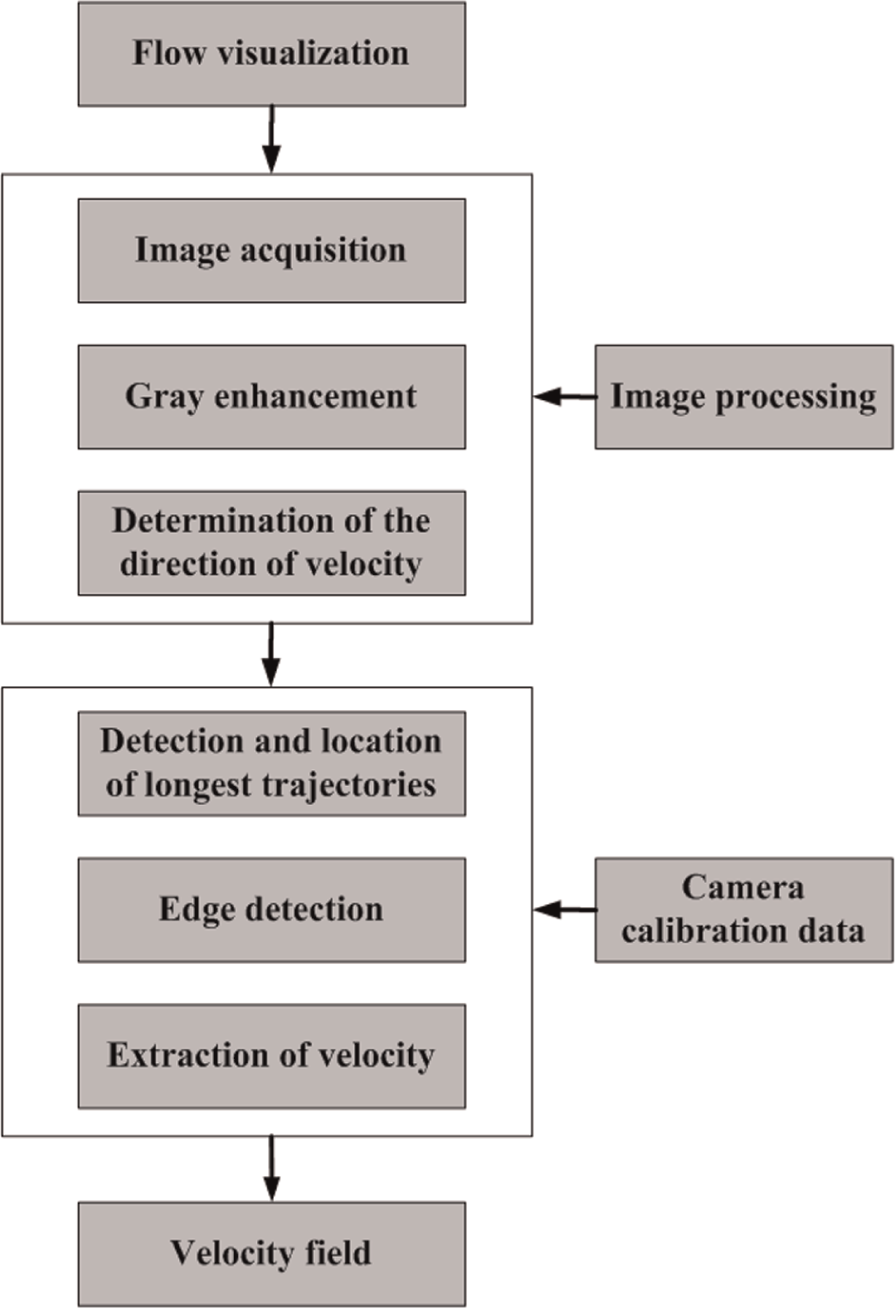
Image processing scheme.
Determination of the direction of velocity
When PTV technology is utilized to measure velocity, the direction of velocity is determined by the trajectories obtained within exposure times. Due to the ambiguities of direction, the direction determination has two results. To solve this problem, single-frame and triple-exposure technique is utilized to record images. Figure 8 shows the corresponding pulse disk with three different gaps. As successive laser passes the pulse disk, three trajectories with different lengths are displayed in the image. The shortest trajectory is defined as the arrow tail, the longest trajectory is defined as the arrow itself, and the second longest trajectory is defined as the arrow head. The direction of velocity is from the arrow tail to the arrow head.
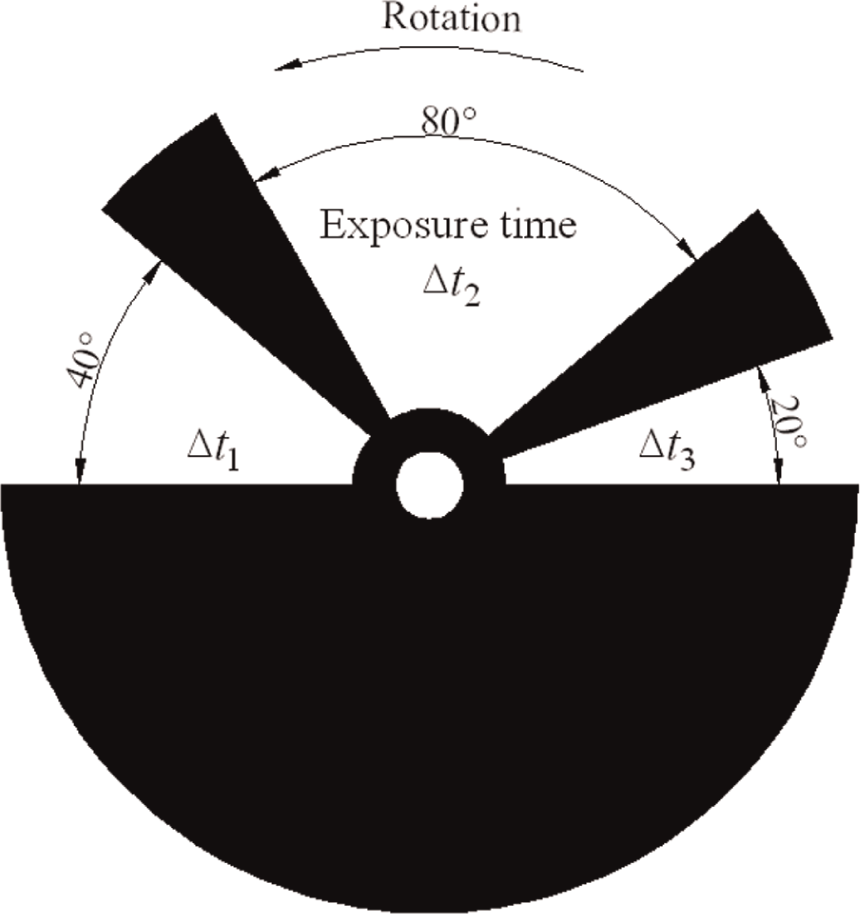
Pulse disk and corresponding trajectories (
In order to improve readability of the recorded images, pre-processing of the images was acquired. After image gray enhancement, the trajectories of the particles in the image became clear, and the direction identification became easy. The arrow head, the arrow itself, and the arrow tail of the three trajectories can be easily distinguished, and the direction of the internal flow field can be accurately determined, as shown in Figure 9.

(a) Image pre-processing and (b) determination of flow velocity vector.
Camera calibration
The trajectories of particles obtained in images are displayed in pixels. The charge coupled device (CCD) camera was calibrated to obtain the corresponding relationship between pixel and millimeter and determine the displacement of the actual particle. A corresponding calibration disk was created for the calibration. Figure 10(a) shows a calibration target with a series of uniform apertures (2 ± 0.005 mm in diameter) distributed on the radius. The calibration target was fixed on the outer wall surface of the hydrodynamic torque converter with adjustable guide vanes. Figure 10(b) shows the obtained calibration image.
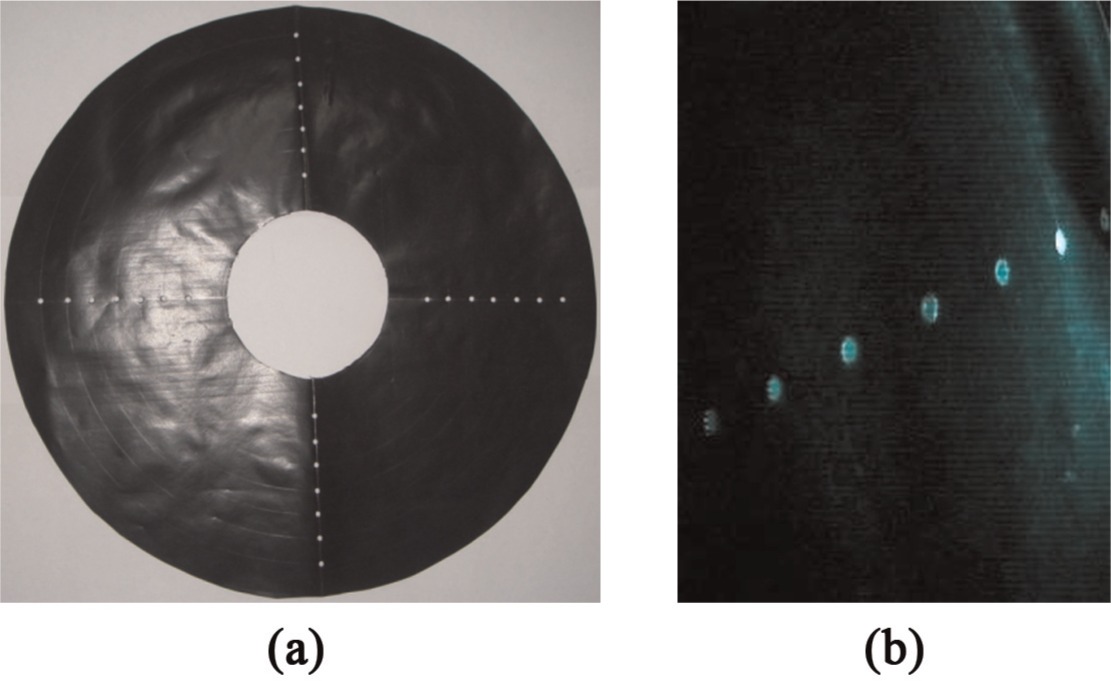
(a) Calibration target and (b) calibration image.
The physical size corresponding to the unit pixel was obtained by comparing the actual physical size of the standard aperture and the pixel size of the aperture detected in the image. The corresponding relation between pixel and millimeter was thus determined to be 1 pixel = 0.264 mm.
Determination of flow velocity
In the pretreated image, the particle displacements in the flow field can be acquired with the extracted edge coordinates of the trajectories and the image calibration data. The speed of the pulse disk determines exposure time of the tracer particles. Ultimately, the internal flow field of the hydrodynamic torque converter can be calculated.
Image edge detection and the extraction of single-pixel edge coordinate
A dual-threshold method is introduced through a nonmaximum suppression process to detect the strong and weak edge points of the image. The first and last coordinates of the trajectories are extracted from the edges. The edge detection steps include filtering, image enhancement, detection, and positioning.
The filtered image
where
As the changing values of neighborhood strength are the basis of edge detection, the gradient magnitude
The first-order partial derivative matrices of x- and y-directions are shown as follows
The gradient magnitude and direction of the corresponding positions


The nonmaximum suppression is an important step for the edge detection in Canny algorithm. Through searching for a local maximum pixel point, the gray value of the remaining other points is set to 0 and be removed. Then, through the dual-threshold method, all edge points whose values are less than the low threshold would be also assigned to 0 and removed, the points which are larger than the high threshold should be connected. At the breakpoint of the contour, the point whose value is between the two thresholds in eight neighborhoods should be researched to form a complete contour.
Through a compiled MATLAB codes, the sub-windows of different sizes were set to extract the single-pixel edge coordinates based on the edge detection results. The first and last coordinates of the trajectory of particle motion were extracted.
Exposure time
The pulse disk displayed in Figure 8 is driven by the DC motor controlled by the switching rectifier. Given that the exposure time selected in the experiment directly affects the light intensity of the tracer particles in the image, a reasonable exposure time should be selected by adjusting the speed of the DC motor. During the experiment, the motor speed is n = 1525 r/min. According to the formulas
Extraction of velocity
After extracting the displacement of the tracer particles, particle velocity can be calculated. As shown in Figure 11, the displacements are achieved after extracting the longest trajectories in the images whose exposure time is

(a) Image edge detection and (b) determination of flow velocity.
The calculation formula of particle velocity in flow field is shown as follows
where
Flow field analysis of the adjustable stator
The internal flow field velocity in the flow passage of the adjustable stator was calculated through the image processing. The internal flow pattern of the hydrodynamic torque converter with adjustable guide vanes was analyzed under the following two conditions: the changing conditions under the same opening and the changing openings under the same condition.
Internal flow field analysis under the same opening
Figure 12 shows the velocity fields in the flow passage of the adjustable stator under the opening x = 0.5 at different working conditions. In Figure 12, line AB represents the outer wall of the torque converter, and regions C and D represent the vanes. When the light comes from the outer wall, the velocity fields in the partial region inside the outer wall are missing because the light is sheltered by the outer screw mounted on the shell of the torque converter. The brightness in rear vane area would be low because of the shielding of vanes C and D. Thus, it is difficult to identify the velocity field in this region and the partial inner area of the outer wall.
Internal flow velocity field of adjustable stator under the opening of 0.5: (a) stall condition (i = 0), (b) design condition (i = 0.5), and (c) idle condition (i = 1).
As shown in Figure 12, the inlet flow direction at the inlet in the adjustable stator varies with the working conditions, whereas the flow direction at the outlet is almost the same. The velocities reach the maximum under idle condition (i = 1), and the maximum inlet velocity is approximately 0.287 m/s, while the maximum outlet velocity is 0.463 m/s. As the outlet flow area in the adjustable stator is larger than the inlet, the outlet velocity is faster than the inlet velocity. The inlet flow continues to affect the working surface of the adjustable guide vanes under the three typical working conditions because of the fixed stator’s effect. When the speed of the pump is kept constant, the outlet flow of the adjustable stator affects the pump. Thus, in the pump passage, the flow runs along the blades in the directions of the inlet and outlet angles of the blade (the outlet flow exhibits a small deviation from the outlet angle of the blade). The flow affects the fixed stator after passing through the turbine. Both of the fixed stator and adjustable stator are stationary, and the outlet flow of the fixed stator continuously affects the working surface. Because of the fixed stator, the angle between the inlet flow direction and the inlet angle direction of the adjustable guide vane increases with the speed ratio. The internal flow pattern of the adjustable stator differs from that in an ordinary three-element torque converter. The inlet flow would not affect the nonworking surface of the vane.
Under the stall condition (i = 0), the outlet flow from the fixed stator affects the working surface of the guide vane in the adjustable stator when the turbine is kept stationary. Therefore, a certain angle is formed between the inlet flow direction and the inlet angle direction of the adjustable guide vane. A vortex phenomenon is observed because the flow impacts the working surface of the adjustable guide vane. A block region is formed on the working surface of the guide vane because the flow pressure on the working surface is higher with diminished flow velocity. A vortex is finally formed as the block region extended into the flow passage. Under the design condition (i = 0.5), the flow velocity from the fixed stator increases, and the angle between the inlet flow direction and the inlet angle direction of the adjustable guide vane also increases. No complex flow is observed since the impact of the flow is weak. Given that the loss is minimal, the efficiency of the torque converter is maximized. Under idle condition (i = 1), the deviation of the outlet flow of the fixed stator increases, whereas the angle between the inlet flow direction and the inlet angle direction of the adjustable guide vane reaches its maximum value. The inlet flow continues to affect the working surface of the adjustable guide vane. A vortex is observed on the nonworking surface of the adjustable guide vane near the inlet. A low-energy fluid region is formed on the nonworking surface of the guide vane because the flow velocity on the working surface is higher than that on the nonworking surface with the same radius. A vortex is formed due to the deviation of flow.
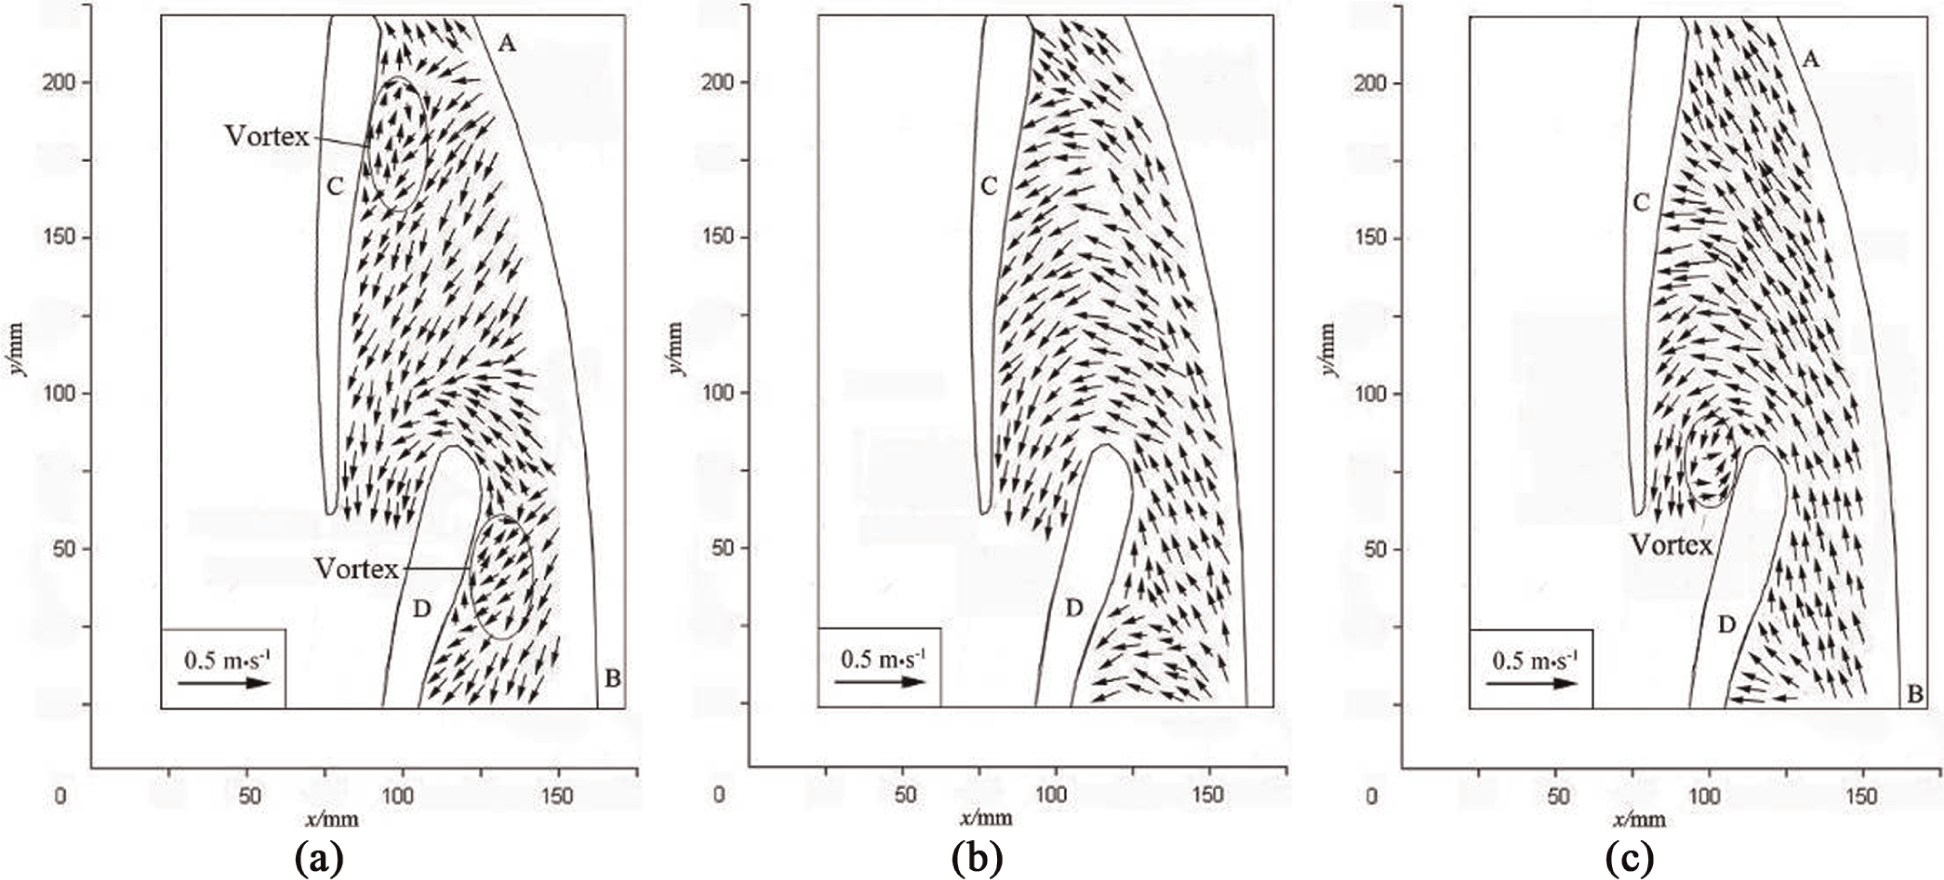
Internal flow field analysis under the same working condition
Stall condition
Figure 13 displays the internal flow velocity field of the adjustable stator under different openings at the stall condition (i = 0). When the adjustable guide vanes are full closed (x = 0), the flow is mainly remained inside the stator because the heads and tails of all the vanes of the adjustable stator contact with each other to form a closed circle. The circulation flow rate of the adjustable stator is zero. When the opening (x = 0.5, x = 1) is increased, the incline angle of the adjustable guide vane decreases and the inlet velocity remains stable, while the angle between the inlet flow direction and the inlet angle direction of the guide vane decreases and the outlet velocity decreases. The outlet flow direction varies with the openings. The vortex phenomenon emerges near the inlet of the vane’s working surface. Under the same working condition, the inlet flow of the adjustable stator remains constant for the flow from the fixed stator remained constant. The vortex phenomenon emerging on the working surface of vanes is formed due to the impact of flow on the working surface, where the pressure increases and flow velocity decreases. The vortex area expands with the increase in the opening.

Internal flow velocity field of adjustable stator under the stall condition: (a) opening x = 0, (b) opening x = 0.5, and (c) opening x = 1.
Design condition
Figure 14 shows the internal flow velocity field in the flow passage of the adjustable stator under different openings at the design condition (i = 0.5). Under the design condition, when the guide vanes are full closed (x = 0), the circulation flow rate of the adjustable stator is still zero. When the guide vane opening (x = 0.5, x = 1) is increased, the incline angle of the adjustable guide vane decreases and the inlet velocity is kept constant, while the angle between the inlet flow direction and the inlet angle direction of the guide vane decreases and the outlet velocity decreases. The outlet flow varies with the openings. Under the same working condition, for the outlet velocity of the stationary stator is unchanged, the inlet velocity of the adjustable stator under different openings remains constant. With the increase in the guide vane’s opening, the flow area increases and the outlet velocity decreases.

Internal flow velocity field of adjustable stator under the design condition: (a) opening x = 0, (b) opening x = 0.5, and (c) opening x = 1.
Idle condition
Figure 15 shows the internal flow velocity field in the flow passage of the adjustable stator under different openings at the idle condition (i = 1). When the guide vanes are full closed (x = 0), except a few of flow would leak out, the circulation flow rate of the adjustable stator is still zero. When the opening increases (x = 0.5, x = 1), the incline angle of the adjustable guide vanes decreases, and the inlet velocity of the adjustable stator remains unchangeable, while the outlet velocity decreases, and the outlet flow direction varies with the openings. Under the same working condition, the inlet velocity of the adjustable stator and the outlet velocity of the stationary stator are the same. A vortex occurs on the nonworking surface of the adjustable guide vanes near the inlet because the flow velocity on the working surface is higher than that on the nonworking surface with the same radius. A low-energy flow area is formed on the nonworking surface of the adjustable guide vanes because of flow deviation. The flow area increases and the outlet velocity drops with the increase in the opening. This low-energy flow area on the nonworking surface of the guide vanes increases, and hence, the vortex area increases.

Internal flow velocity field of adjustable stator at the idle condition: (a) opening x = 0, (b) opening x = 0.5, and (c) opening x = 1.
In conclusion, under the same opening, the flow velocity increases with the speed ratio. The inlet flow of the adjustable stator affects the guide vane’s working surface, and the angle between the flow direction and the inlet angle direction of the adjustable guide vane increases. As the outlet flow area is larger than the inlet flow area in the adjustable stator, the velocity of outlet is faster than the inlet. At the off-design conditions, vortex phenomenon was observed, and reasons for the vortex phenomenon were analyzed. Under the same working condition, when the opening increases, the inlet flow velocity remains unchangeable (the direction of the outlet velocity varies with the angle of adjustable guide vane), while the outlet flow velocity of the adjustable stator decreases. Because of the influence of the fixed stator, the inlet velocity of the adjustable stator remains constant. However, for the increases in the outlet flow area, the outlet velocity decreases.
Conclusion
In this article, PTV approach was employed to investigate the flow behavior of a transparent hydrodynamic torque converter with adjustable guide vanes. By the single-frame and triple-exposure method, images of the flow fields in the adjustable stator were recorded under different openings and different working conditions. The displacements and velocities of the particle tracers were obtained by reconstruction of particle trajectories. By comparing the internal velocity vector fields in the adjustable stator, the internal flow pattern of the hydrodynamic torque converter with adjustable guide vanes was analyzed under the following two conditions: the changing conditions under the same opening and the changing openings under the same condition.
The internal velocity vector fields of hydrodynamic torque converter with adjustable guide vanes are obtained, which provide a basis for improving the understanding of its flow fields. Future work includes the measurement of more parametric of flow field data, such as pressures and turbulence intensities. Details of more flow field data will be available for future in-depth research of the hydrodynamic torque converter with adjustable guide vanes.
Footnotes
Academic Editor: Hakan F Oztop
Declaration of conflicting interests
The authors declare that there is no conflict of interests regarding the publication of this article.
Funding
This project was supported by the National High Technology Research and Development Program of China (2014AA041502); the Basic Research Programs of Jilin Province, China (120102JC01032095); and the Natural Science Foundation of China (51305156).