
Abstract
This article introduces a prototype measurement method for investigating deep-water mooring systems. Measurement information and specifications are determined according to mooring system analysis. Mooring line information is difficult to measure underwater, particularly for aging platforms. To solve this problem, a novel mooring line tension measurement strategy based on lumped mass method is proposed. A type of self-contained sensor is designed and manufactured to realize dynamic response measurement of mooring systems underwater. The sensor is described in detail, including its design requirement, hardware design, and installation mode. A comprehensive field test system was constructed on a semi-submersible platform in South China Sea. Prototype data, including the data measured during typhoons, are introduced and discussed to improve the accuracy, feasibility, and stability of the proposed measurement method.
Introduction
Under harsh environmental excitations, the safe operation of floating structures greatly depends on accurate positioning. Due to the good mechanical properties and low cost, multi-point mooring systems have been widely used as station keeping equipment for decades.1,2 As compliant mooring structures, catenary mooring lines change their shape to provide restoring force. Therefore, the safety of a mooring system can be guaranteed by the accurate estimation of the maximum line tension and dynamic response of mooring lines.
Numerical analysis methods and conducting model tests are conventionally employed in the study of mooring lines.3–8 However, simplifying the model introduces uncertainties that are difficult to quantify in the calculation. Moreover, model tests have been challenged with the increase in the water depth of marine resources. In view of the limitations in laboratory facilities, a normal scale model experiment cannot be conducted for deep-water mooring systems. 9
The model test for studying deep-water mooring systems can be carried out on an in-site mooring line and can be called a field test. Mechanical behaviors, design parameters, and failure modes of mooring systems can be directly investigated using field tests, including unknown phenomena occurring on new design structure under unclear environmental conditions. Prototype measurement for investigating operation conditions of mooring line has emerged as an important method in the study of deep-water mooring systems.10–15 Several measurement techniques and sensors have been developed to detect mooring lines. Monitoring the tension at the top of mooring lines using load cell is the most straight-forward measurement method. Due to the advantages of low cost and high measuring accuracy, this method has been widely used in the existing mooring system.16–19 In general, load cells are installed at the top of mooring lines. Influenced by the contact of mooring system and chain stopper, dynamic response of mooring line gained by load cell is smaller than the true value. In addition, for permanent mooring system, it is hard to maintain or replace the load cells. Nonetheless, load cells have yielded a large amount of extremely valuable data. Presetting monitoring system is another widely used measurement technique for mooring systems. Fiber optical gauges or strain gauges are presetted along the mooring line to investigate operation conditions. Smith and Williams 20 introduced a direct tension measurement method for mooring lines. Using polymeric optical fibers, fatigue life of synthetic fiber mooring line can be estimated. Van den Boom et al. 21 developed a monitoring system to measure tension and moment of mooring chain. Presetting monitoring system could acquire accurate dynamic response of mooring systems. However, due to the limitation of installation mode, this measurement method is not suitable for aging platforms. In recent years, many other measurement techniques and sensors for mooring systems have been developed. Du et al. 22 discussed the tension measurement technique for stud-less mooring chain. A novel sensor is designed to obtain mooring line tension by measuring lateral variation of chains. The sensor could be used on in-site mooring systems. But it is only applicable for stud-less mooring chain. Hall 23 proposed an optical caliper-type mooring chain measurement system. The system can measure the length and diameter to inspect integrity of mooring chain. Brown et al. 10 introduced a remote operated vehicle (ROV)-deployable loose stud detection system. The system can distinguish chain stud between “loose” and “tight.” The above two measuring equipments are suitable for integrity management of mooring systems, but unable to obtain mooring line tension.
At present, there are mainly three kinds of measurement systems: (1) dry measurement system, using load cells to obtain mooring line tension at place of chain stopper on the deck; (2) presetting measurement system, investigating mooring line operation conditions with presetted fiber optical gauges or strain gauges; and (3) in situ measurement system, inspecting in-site mooring systems with special designed measurement instruments underwater. However, due to the high cost and difficulties in installation and maintenance, traditional measurement methods are not suitable for wide implementation. There are still plenty of mooring systems that are short of valid measurement systems. A different approach is therefore needed for deep-water mooring line tension measurement.
In this article, a new mooring system measurement method is proposed for investigating mooring system underwater. In consideration of the implementation requirements, a mooring line tension underwater measurement strategy based on lumped mass method is proposed. By employing the proposed measurement strategy, mooring line tension can be calculated conveniently and effectively from simple measurement information. In prototype measurement, the key problem is to find a way to obtain prototype data continuously and simultaneously even during typhoons. However, special sensors for mooring line measurement are still largely unavailable because of the difficulties in water proofing, power supply and data transmission underwater. To obtain the response underwater, a type of sensor is designed and manufactured for recording geometry varieties of mooring line. The sensor is designed to be self-contained, which has been widely applied in industrial fields.24–27 In order to satisfy implementation demands, design requirements such as low power consumption, miniaturization, and low cost have been considered in hardware design of the sensor. Meanwhile, an assistant system is applied for underwater installation of self-contained sensors.
The proposed measurement method based on self-contained sensors has been implemented on a semi-submersible platform in South China Sea. A number of valuable data have been recorded during 5 months’ field test. Prototype data, including the data measured during typhoons, are presented and discussed to improve the accuracy, feasibility, and stability of the proposed prototype measurement method.
Underwater dynamic measurement strategy of mooring line tension
Theoretical and numerical analysis methods, such as catenary method, lumped mass method, finite element method, and coupling analysis method, are employed in the study of mooring lines.28–33 Among them, lumped mass method is considered effective and widely applied for analyzing catenary mooring lines. Therefore, the proposed measurement strategy is based on lumped mass method.
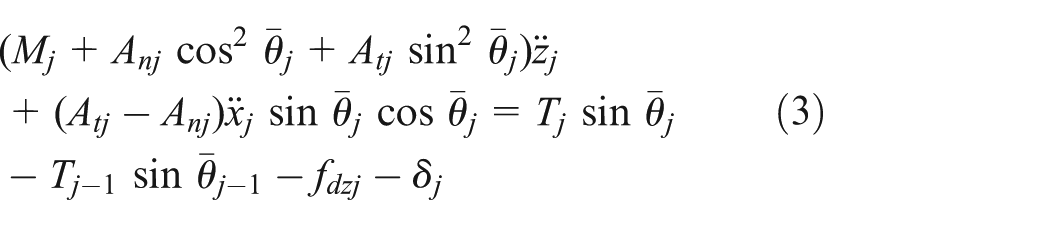
A lumped mass model of the mooring line is shown in Figure 1. The mooring line is discrete into N lumped mass nodes. Massless springs are used to connect nodes in consideration of the tangential elasticity of the line. The equations of motion for the jth lumped mass node can be written in global coordinates as follows

where
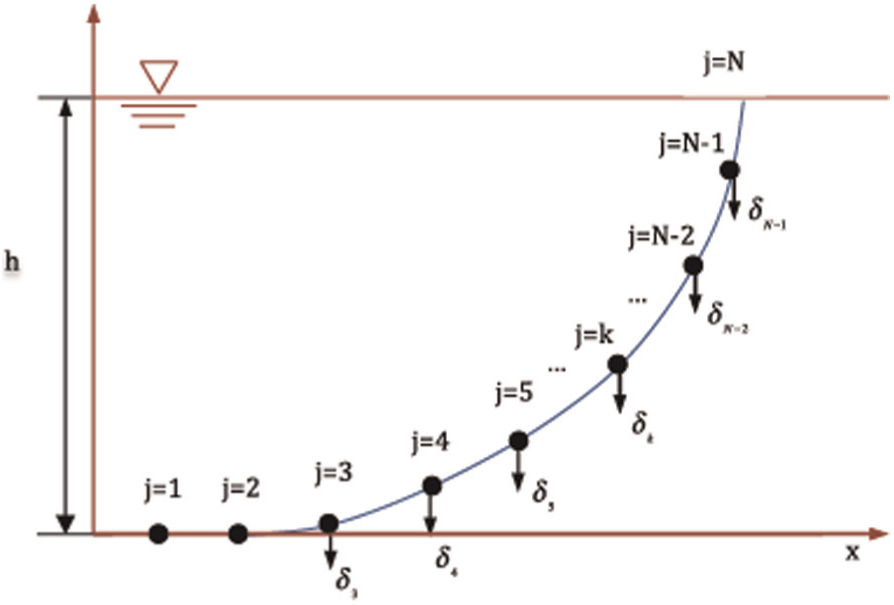
Lumped mass model of mooring line.
Figure 2 depicts the lumped mass–spring configuration at the jth node. The force on the jth node contains line tensions T and


where
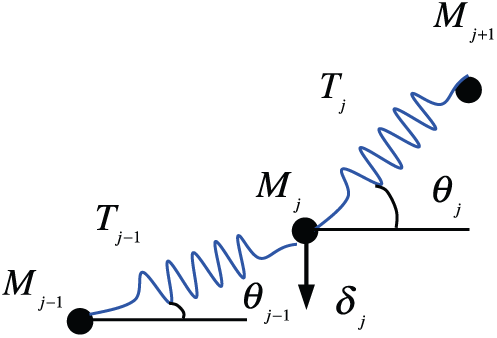
Lumped mass–spring configuration at jth node.
Drag forces
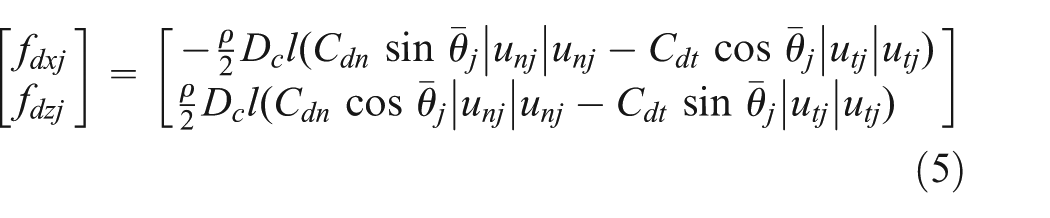

where
To solve the equations of motion in equation (5), the following initial and boundary conditions at the anchor position and displacement excitation at node N should be introduced


In general, the motions of the floater are measured to determine the top displacement boundary conditions of the mooring line. However, deep-water platforms are usually far away from land. It is difficult to obtain motions with high accuracy for the reason lacking of reference. Global Positioning System (GPS) and accelerometers are utilized as the main equipment for motion measurement of deep-water floaters. Generally, the positioning accuracy of GPS is 1 m and can reach 0.1 m using differential GPS signals. The accuracy is sufficient for floater positioning, but it is inadequate for dynamic analysis of mooring line tension as boundary conditions of displacement. Accelerometer can measure displacement with high precision. However, due to the limitation of integral method, absolute displacement cannot be obtained by accelerometer. Therefore, prototype floater motions are unsuitable for mooring line tension analysis.
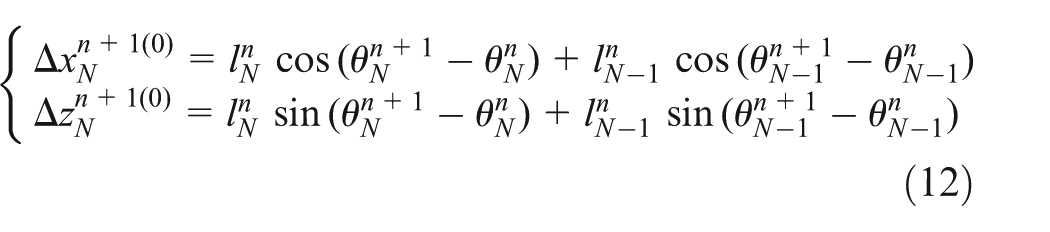
A new underwater measurement method with two inclinations is developed to perform the analysis of mooring system with accuracy. The displacements of node N at time n+1 is given as follows
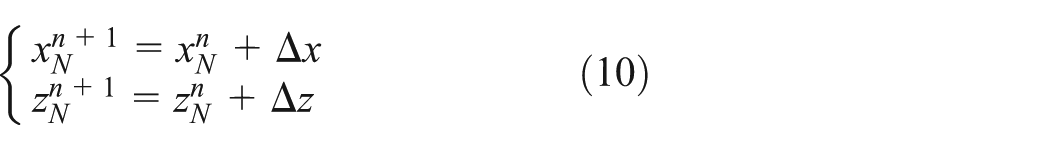
where

Here,
In field tests, it is impossible to measure all inclination angles at each node of the mooring line. Nonetheless, the angle change at the lower part of mooring line is not as significant as that on the topside. An iterative process with two inclination angles on the topside of the mooring line is proposed to perform mooring line tension analysis. The new value of the topside displacement at the ith iteration can be calculated by the iterative format shown in equations (12) and (13)

where
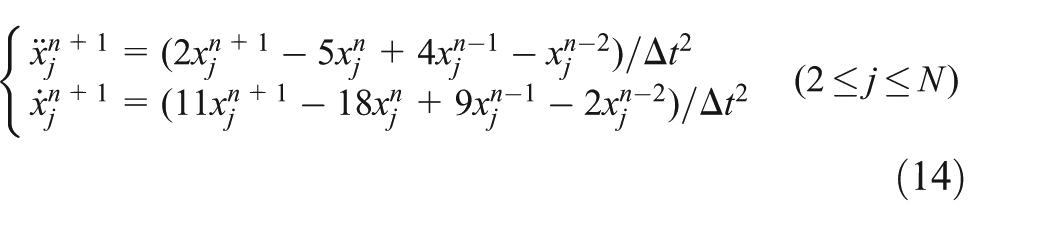
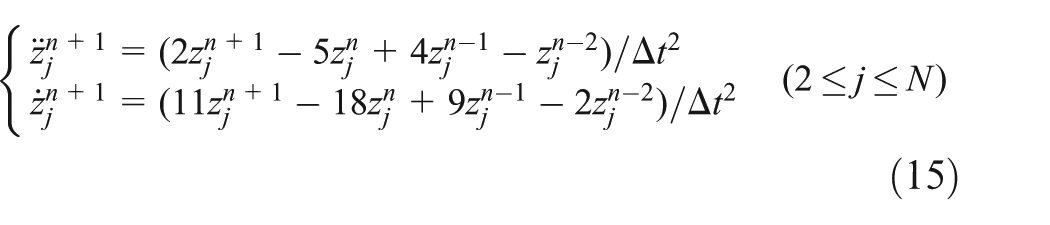
According to the displacement of node j at the ith iteration, the time domain relations between nodal displacements, velocities, and accelerations may be approximated by Houbolt method as follows
At time n+1, the constraint equation

Based on the above conditions, new mooring line tension
The simplification of the measurement information suggests that the underwater line tension measurement strategy is feasible to realize with high sensitivity and low cost. The inclination angle directly measured by the proposed system can be used to calculate the real mooring line tension, including dynamic components. The measurement strategy satisfies the requirements for both short-term inspection and long-term health monitoring.
Design of underwater self-contained sensor
To meet requirements of the underwater measurement of inclination angle, a type of self-contained sensor was designed and implemented in the proposed system. This self-contained sensor can collect and record geometry variations of the mooring line without cable. Therefore, it conveniently protects the system from harsh working conditions as well as improves the system’s stability, reliability, and durability. To satisfy the requirements of the implementation, the following aspects should be considered in the design and manufacture of the sensor.
Measurement capability of sensors
The sensors should possess adequate measurement capability to obtain complete measurement information time history. The parameters of the sensor, such as measurement range, sampling frequency, frequency response, and precision, should meet the measurement requirements of all possible working conditions of the mooring line.
Durability
One disadvantage of monitoring is that environmental conditions cannot be controlled. To obtain suitable prototype data for analysis, long-term monitoring should be conducted to record large amounts of data, including the data during typhoons.
Feasibility of field application
Self-contained sensors are installed on mooring chains underwater, meaning that the sensors have to be miniaturized and waterproof. The installation mode must also be considered.
A self-contained sensor was designed and manufactured in considerations of all the design requirements. The sampling frequency of the sensor can be adjusted from 1 to 10 Hz, and frequency response reaches up to 28 Hz. The capability of sensors can cover all dynamic frequency orders. To meet the design requirements, sensors should adopt the following design criteria:
Self-contained. The sensor itself is responsible for data acquisition, processing, storage, and power supply. Thus, the sensor can be used without cables under any environmental condition, including typhoons. In addition, the sensor has an extended interface. Extended measurement modules, such as water depth, acceleration, temperature, and salinity, can be added on the self-contained sensor according to the measurement requirements. The extended interface also allows for the installation of an acoustic communication module and spare batteries.
Low power consumption design. This instrument is mainly composed of the embedded microprocessor unit, dual-axis tilt sensor, analog-to-digital (A/D) conversion, data storage, watchdog, real-time clock, and serial communication. The system block diagram is shown in Figure 3. All the abovementioned devices are of low power consumption design. The working current of self-contained system is only 8 mA in operative mode and 0.39 mA in standby mode. In other words, if the power supply of the self-contained system adopts two batteries with a capacity of 19 Ah, the system can operate continuously for at least 5 months.
Modular designed system circuit. The overall design of the system’s underlying circuit is a bus structure with various modules that are independent of one another. The modules form a cylinder and are interconnected on the bus plate. The modular designed system circuit can meet demands of miniaturization and improve anti-interference ability and communication stability;
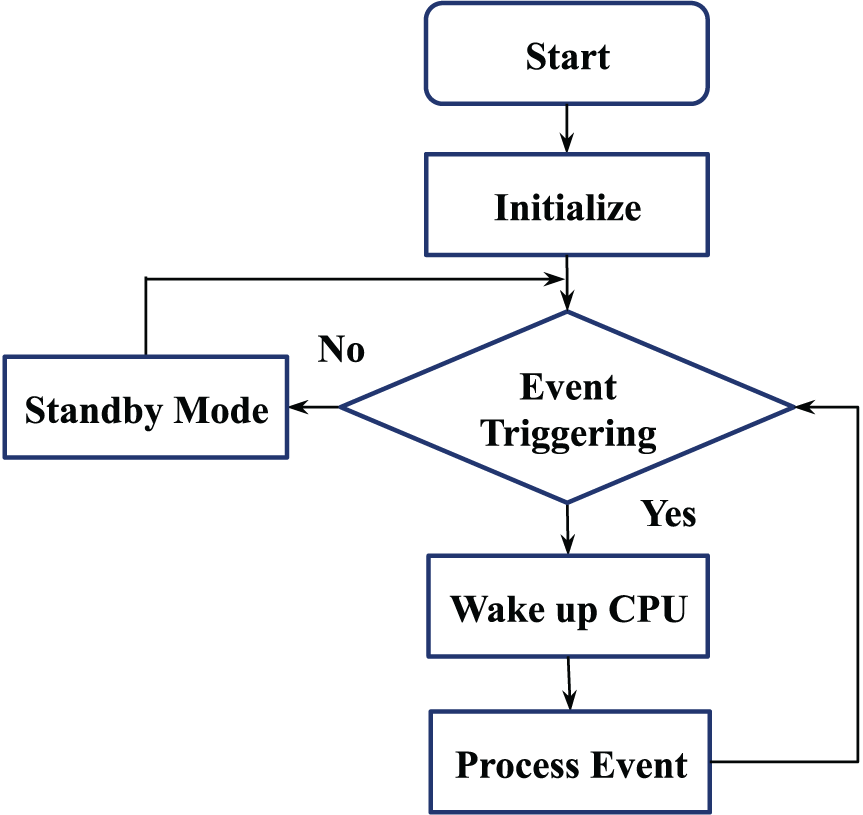
Completely event-triggered designed software system. The self-contained sensor operation process is shown in Figure 4. Under non-trigger condition, the system is in standby mode, and an auxiliary clock is used as system timer. When event-triggered, the CPU is waken up and immediately converted to operative mode. The system operates at high speed to process the event. After the work is completed, the system is converted back again to standby mode, waiting for next event triggering. Therefore, the system can maximize the trigger event interval time.
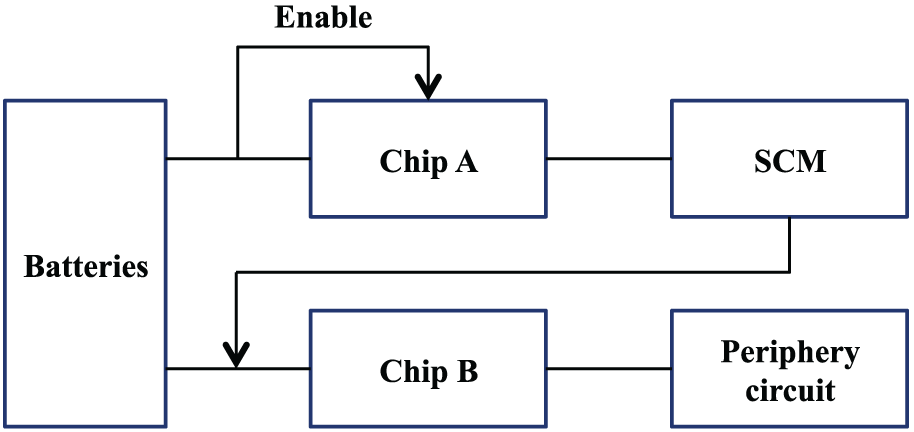
Power management unit. The power management unit is designed by double power chips management mode. Two power chips control the power supply of single chip microcomputer (SCM) and the peripheral circuit separately. The schematic of the power management unit is shown in Figure 5. When the system is in standby mode, only chip A works to supply power to SCM. The peripheral circuit is closed by SCM using enable end. When event triggering occurs, chip B starts to work, and the system is converted to operative mode. The power management unit significantly improves power efficiency and stability significantly.

System block diagram of self-contained inclinometer.
Completely event-triggered designed software.
Schematic of power management unit.
The self-contained inclinometer developed based on the design criteria can meet the requirements of prototype data acquisition on high precision, high sensitivity, large frequency response range, and low power consumption. Moreover, low cost is specially considered in the design of sensor. The integration of circuits of the self-contained inclinometer is shown in Figure 6.
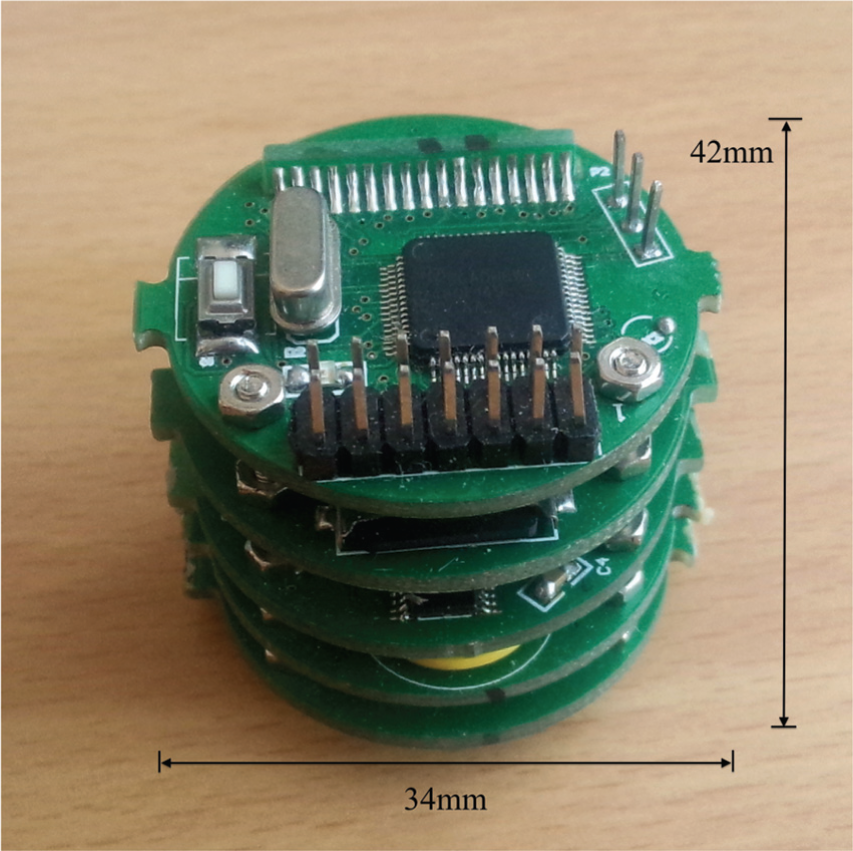
Integration of circuits of the self-contained inclinometer.
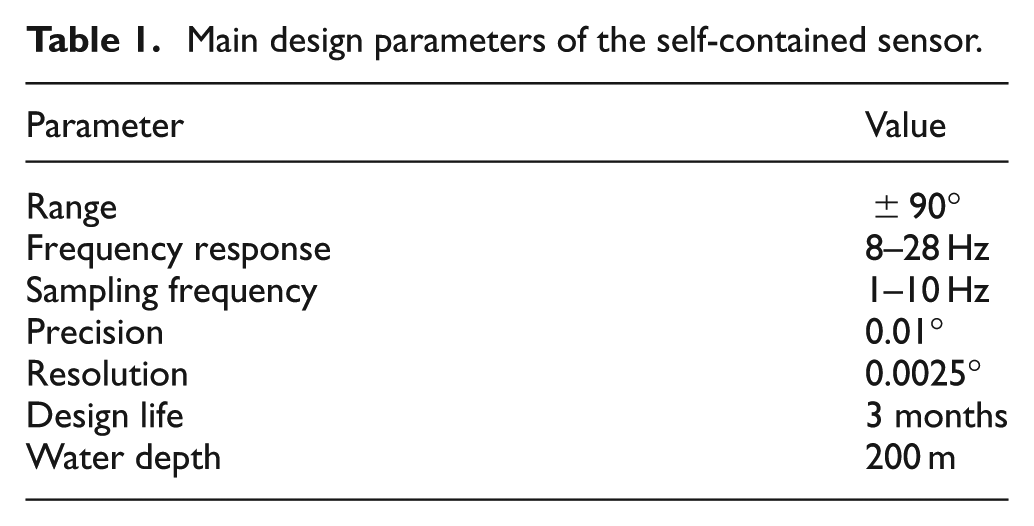
A protective barrel is manufactured to protect the sensor from water pressure, vibration, and corrosion. The protective barrel is designed to work in the water of 200 m depth. The size of protective barrel is 210 mm × 60 mm (height × diameter). And the weight is 2.2 kg (with batteries). Due to the miniaturization and lightweight design, the influence of sensors on structure dynamic response can be ignored. Figure 7 shows the self-contained inclinometer with water-resistant cover. The main design parameters of the sensor are listed in Table 1.

Self-contained inclinometer with water-resistant cover.
Main design parameters of the self-contained sensor.
Moreover, a specially designed clamp is used to fix the sensors on the mooring chains. This clamp and the simulation installation diagram are shown in Figure 8. Both divers and ROVs can complete the installation and retrieval operations of the clamp. In order to calibrate installation error, the measurement results gained by devices during calm weather are compared with the mooring line tension measured by load cell at the same time, which is seen as the theoretical value. The comparison results are used to do initial calibration of the measurement system.

Specially designed clamp and simulation installation of sensor: (a) clamp and (b) simulation installation diagram.
Field test and results
The self-contained sensors were installed on the NanHaiTiaoZhan (NHTZ) FPS in South China Sea, which is a semi-submersible platform with an asymmetric mobile spread mooring system. Each mooring line is composed of four components. The mooring line parameters are shown in Table 2. Ten sensors are installed on the mooring chain of mooring lines No. 4 and 7. All sensors have reached their design working life and have been successfully retrieved by ROV. Figure 9(a) depicts the installation layout of self-contained sensors, and Figure 9(b) shows the self-contained sensor used underwater.
Mooring line parameters.

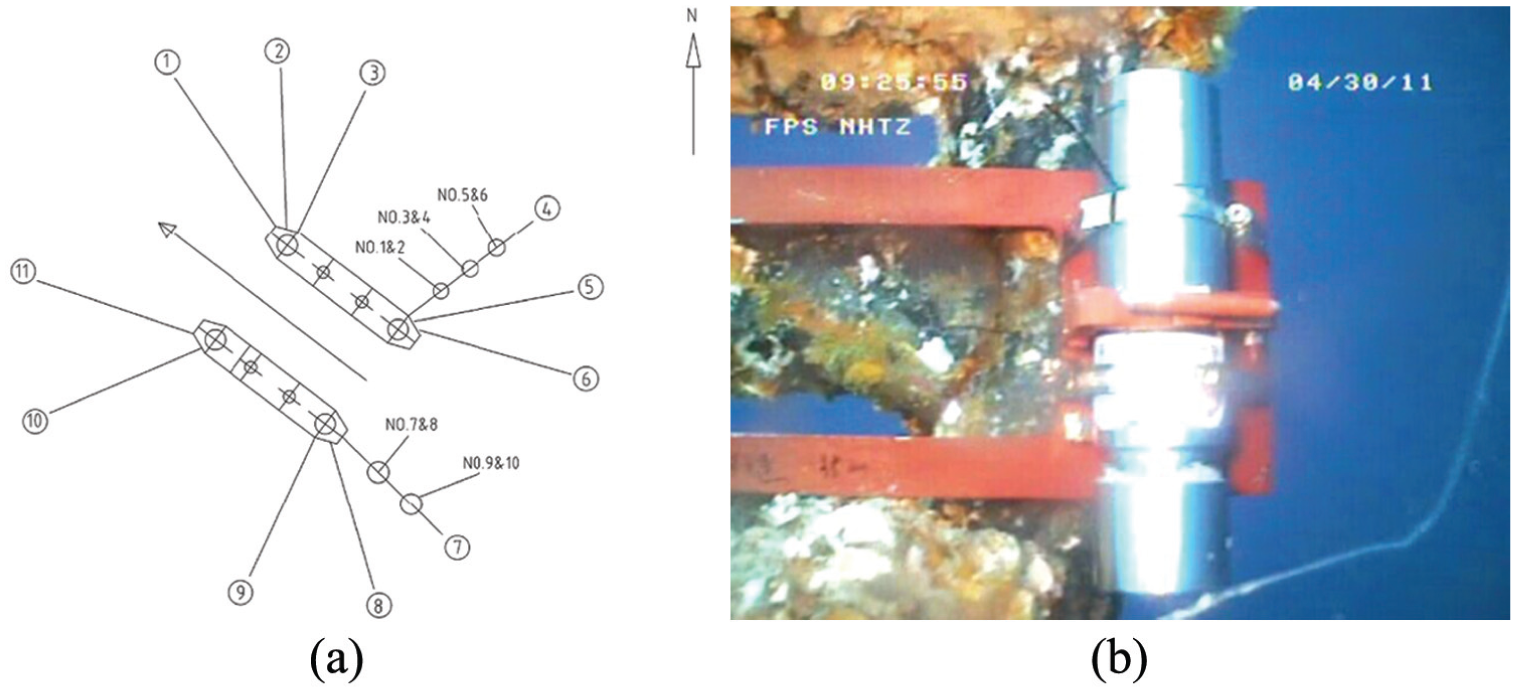
Self-contained sensors used on mooring system of NHTZ FPS: (a) installation layout and (b) a sensor used underwater.
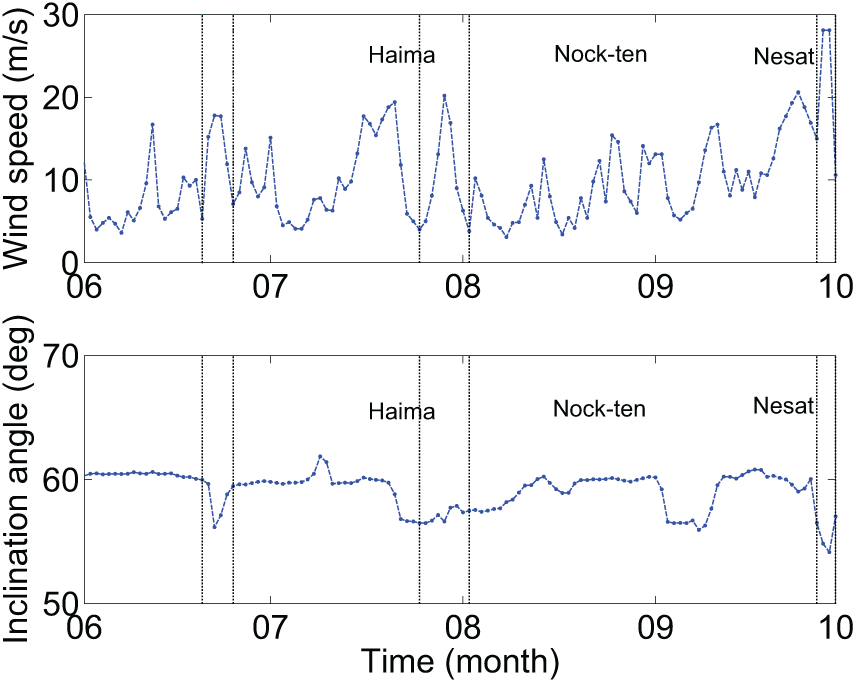
The field test was conducted from May to October 2011 to prove the feasibility and stability of the proposed system. Figure 10 shows the view of daily maximum value of inclination angle of No. 3 self-contained sensor. And the daily maximum values of wind speed recorded by anemometer, which is installed on the same platform, are also demonstrated in the figure. The prototype data show that the self-contained sensor can meet the continuity and synchronization requirements of measurement. The prototype data during three typhoon periods were also recorded and are marked on the figures. To further study the performance of the field test system, prototype data recorded from 22:00 to 22:20 in 28 July, during typhoon Nock-ten, is selected for further analysis.
Daily maximum values of wind and inclination angle during measurement period.
Figure 11 provides the result of power spectral density (PSD) of dynamic response of mooring line, which is marked as Mooring 2. To distinguish the mooring line dynamic response between typhoon weather and calm weather, the data recorded on 2 June are selected to calculate PSD marked as Mooring 1. Hydrodynamic analysis with “ORCAFLEX” is carried out to study dynamic behavior characteristics of mooring line. Mode analysis results of the whole line and mooring chain, which is the first component of mooring line, are listed in Table 3.

PSD comparison of angle change, wave, and floater motions.
Results of mode analysis.

The prototype data of floater motions and wave measured at the same time are also analyzed and marked in the figure. The findings show that both Mooring 1 and Mooring 2 have spectral peaks at 0.16 Hz, which is close to the first-order mode of mooring chain.
Besides, there is an additional spectral peak with 0.10 Hz for mooring tension measured during typhoon pass by. Comparing with PSD results of wave and roll motion, we believe that there is significant response for mooring 2 on wave frequency. Therefore, under harsh weather, the significant wave frequency component should be considered in the analysis of mooring line. Moreover, affected by sway and surge motions, low-frequency component increases in mooring line dynamic response. PSD comparison results show that the underwater field test system can accurately obtain the frequency domain characteristics of mooring lines.
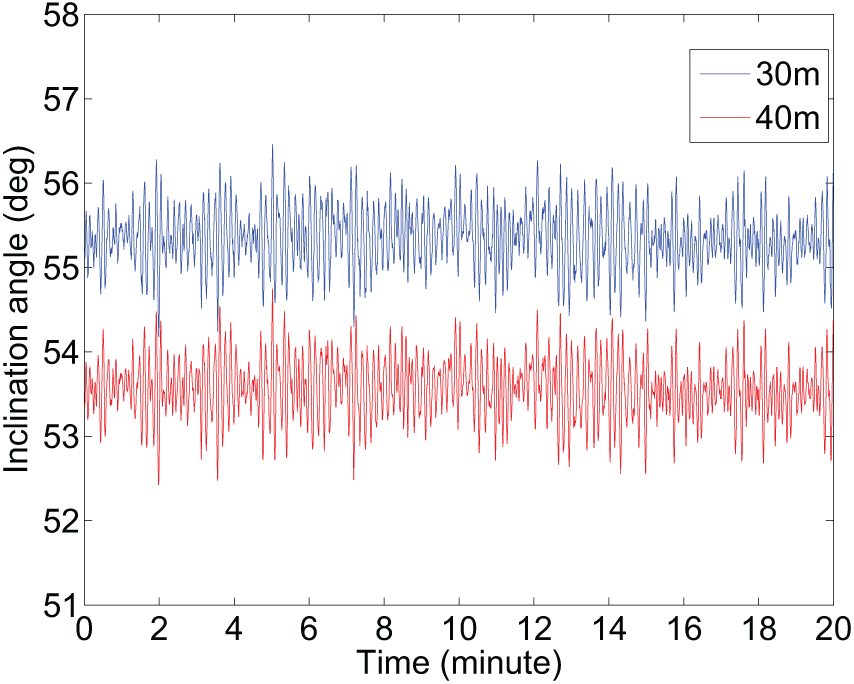
Mooring line tension is obtained using the measurement strategy discussed in section “Underwater dynamic measurement strategy of mooring line tension.” The time series of inclination angle variations of mooring line No. 4 recorded by sensors No. 3 and 5 during selected periods is shown in Figure 12.
Inclination angle variations measured by sensors installed at mooring line No. 4 during selected periods.
Sensors No. 3 and 5 are installed separately at a water depth of 30 and 40 m. The inclination angle varieties measured by sensor No. 3 range from 54.18° to 56.46°, whereas that measured by sensor No. 5 range from 52.42° to 54.75°. The phase difference between two inclination angles is an important parameter in the measurement of mooring line tension by the method introduced in section “Underwater dynamic measurement strategy of mooring line tension.” Phase difference can be analyzed using equations (17)–(20)


where x are the data recorded by sensor No. 3, y are the data recorded by sensor No. 5, n is the length of the data, and c is the phase difference between two inclination angles.
The result of phase difference analysis is 0.034°. In view of the timing correction by the GPS clock, the phase difference between the data recorded by different self-contained sensors at the same time is small enough to meet the requirements of mooring force analysis.
To demonstrate the accuracy of the measurement results, mooring line tension obtained by load cell is used for comparison. The load cell is installed on the top of mooring line to measure mooring line tension directly. The measurement precision of the load cell reaches up to 0.1 kips. In Figure 13, the mooring line tension measured by the load cell is shown by the red line, whereas the mooring line tension measurement result is shown by the blue line. The maximum value of mooring line tension measured by the load cell is 173.7 kips, the minimum value is 171.7 kips, the mean value is 173.1 kips, and the standard deviation is 0.48. The maximum value of mooring line tension measured by self-contained sensors is 181.8 kips, the minimum value is 166.3 kips, the mean value is 173.3 kips, and the standard deviation is 2.50. The comparison results demonstrate that the mean values of mooring line tension measured by two methods are close. Traditionally, mooring line tension directly measured by load cells is considered the theoretical value. Therefore, the comparison of mean values can be regarded as a reflection that the measurement strategy is feasible, and that the result is accurate. In view of the low sampling frequency and frequency response, the dynamic response of mooring line tension measured by load cells is significantly lower than that measured by self-contained sensors. The mooring line tension measured by self-contained sensors can reflect more frequency components, which is important for stiffness and fatigue analysis of mooring systems.

Comparison of measured and theoretical mooring line tension during selected period.
An important aspect of mooring system research is elucidating the contribution of wave frequency components on mooring line tension analysis. Figure 14 shows the PSD result of mooring line tension measured by self-contained sensors. There are two spectral peaks in the PSD of mooring line tension at 0.10 Hz, which is close to the wave frequency, and 0.16 Hz, which is the natural frequency.

PSD result of mooring line tension measured by self-contained sensors.
Another important aspect is the contribution of different frequency components on mooring line tension analysis. Quantitative analysis of wave frequency components is carried out on mooring line tension. The analysis results are shown in Figure 15. The maximum value of mooring line tension considering all frequency components (MT) is 181.8 kips. The maximum values of mooring line tension without considering natural frequency component (MT-NF) and mooring line tension considering neither natural frequency nor wave frequency component (MT-WF) are 180.2 and 174.8 kips, respectively. The mean value of mooring line tension is 173.3 kips. MT-NF and MT-WF are, respectively, 1% and 4% less than MT. The comparison results suggest that the contributions of high frequency and wave frequency on mooring line tension are significant under harsh weather. A similar work has been carried out by Technip Offshore. 34

Comparison results of mooring line tension considering different frequency components: (a) time domain and (b) maximum value.
Conclusion
A mooring system measurement method is proposed in the article including an underwater line tension measurement strategy and a novel self-contained inclinometer. Mooring line tension can be measured with high accuracy using prototype data of two inclination angles directly recorded by self-contained sensors underwater. The measurement system was installed on a semi-submersible platform in South China Sea. After a working period of 5 months, a large amount of data, including three typhoon processes, were obtained and recorded by a database. To improve the feasibility of the field test system, preliminary analysis of prototype data is performed in the following aspects:
Time domain prototype data analysis. Views of prototype data time series about environmental condition and dynamic response of mooring line have shown that the self-contained sensors can meet the continuity and synchronization requirements of multivariable measurement.
Dynamic response of mooring line measured underwater. PSD comparison results show that the self-contained sensor can accurately obtain the frequency domain characteristics of mooring lines.
Comparison of mooring line tension measured by load cells and self-contained sensors. The similar mean values of mooring line tension indicate the feasibility and correctness of the underwater measurement strategy. Mooring line tension measured by the self-contained sensor has a higher sensitivity. That means measurement results can reflect more frequency components of mooring line tension, which are important for stiffness and fatigue analysis of the mooring system.
Contributions of different frequency components on mooring line tension. There are two different frequency components in PSD result of mooring line tension, namely, wave frequency at 0.10 Hz and natural frequency at 0.16 Hz. During the selected typhoon period, the maximum value of mooring line tension calculated considering neither wave frequency nor natural frequency components is 4% less than the maximum value measured. This finding suggests that the mooring line underwater measurement system has a good dynamic performance.
The measurement method discussed in this article is an untraditional method on mooring line research. The field test was implemented on an in-site structure to obtain mechanical behaviors of mooring line directly under excitation of real environmental loads and floater motions. The results of preliminary analysis have proved the feasibility, stability, and durability of proposed measurement method.
Footnotes
Academic Editor: Xiaotun Qiu
Declaration of conflicting interests
The authors declare that there is no conflict of interest.
Funding
The authors acknowledge the support of Important National Science & Technology Specific Projects of China (2011ZX05026-002-02) and the National Basic Research Program of China (2011CB013705).