
Abstract
Assembly molding presents an interesting approach to innovative product solutions. Here, individual components can be simultaneously positioned, affixed, and provided with a casing. However, while overmolding elements in the mold cavity with hot polymer melt, high mechanical loads occur on, in some cases, very sensitive components such as electronic devices. For the design of such systems, it is important to know these stresses, the influences on their quantities, and mathematical options for their prediction. In this article, a new measurement method for determining the forces acting on a small element in the cavity during the injection molding process in three dimensions is presented. Therefore, a new installation method for a force sensor was developed. The results in this article concentrate on force changes during one molding cycle. Our research shows that there are different mechanical load spectra in the different phases of the molding process. For example, the force component in flow direction on an element in the cavity is positive in the direction of the flow during filling. However, after the filling step, the force becomes negative due to the contraction of the injected material and results in a continuously increasing permanent force.
Introduction
Injection molding is a very economical process for the production of complex polymer parts. With special processes, such as assembly injection molding, the capabilities of a standard process can be extended and, thus, an assembly of various components can be produced in one manufacturing step. The expression “assembly molding” is used for injection molding processes in which a plurality of parts made of plastic or other materials were joined to one component or module via primary forming. 1 In the last two decades, the use of assembly molding to enclose electrical and electronic components has increased more and more. 2 Here, the sensitive components can be protected against mechanical shock, corrosive liquid, or gaseous media.
If elements in the molding tool—inserts or components of the tool—are overmolded, they are exposed to different loads. There are thermal loads which, for example, depend on the mold and melt temperature. Because of the melt flow and the pressure required to fill the mold and compensate shrinkage, mechanical loads are applied. The polymer’s shrinkage and components’ thermal expansion further can lead to thermo-mechanical loads. Their potential impact on an electronic device, such as resistor, during encapsulation is shown in Figure 1 schematically. In addition to that, there could be stress caused by affixing and sealing the insert in the tool. This whole load can result in damage or even part failure in the cavity, especially when they are as sensitive as various electronic devices. And also, solid metal lead frames can be distorted.

Sketch of the loads on inserts during the overmolding process (T: temperature; F: force; M: momentum).
The aim of this research is to measure and calculate the mechanical and thermal loads applied on components during injection molding to determine the effects of materials, process parameters, and design. This knowledge can then be incorporated into the design of components and the manufacturing process. As one important step, this article deals with the online-measurement of mechanical loads on small components in the cavity.
Basics
In a very simplified manner, encapsulating inserts with a molten polymer entails a flow around a body by a fluid. This exerts forces on the body. 3 The flow force Ff is caused by the shear stresses in the tangential direction (Fs) and the pressure perpendicular (Fp) to the surface at the interface of the body (equation (1)) 3

The mechanical load on components in injection molding from the flowing melt has been computationally and experimentally studied in the area of mold design, particularly within the subject of core shift. For example, thin-walled parts such as yoghurt cups or syringes are manufactured with a core in the mold. A nonuniform flow of the molten polymer over the core on one side can lead to pressure differences on the core’s surface and thus result in a deformation of it. Process parameters could be one cause 4 as well as an asymmetric part or inlet design or an unbalanced venting. 5
Already in 1981, Bangert 6 presented an approach to calculate the core shift. The notion that the core shift results from pressure differences on the core surface in the process is essential. Nowadays, to predict the core displacement by means of a simulation, the pressure distribution of the flow simulation is coupled to a mechanical simulation.7–9 Bakharev et al., 7 for example, show such calculations with the software Autodesk Moldflow®. The authors find that the core shift during filling is the greatest, while decreasing in the pressure phase and is freezing upon solidification. Thornagel 8 showed that the greatest deformation of the core occurs at the maximum pressure load in the tool, but decreases again during the cooling phase.
In the 1990s, there was a transfer of methods used in core shift analyses to finite element method (FEM) simulations of inserts such as melting cores, sheets of metal, or lead frames to optimize the tool and process design.10,11 Glaser pointed out the occurrence of shear stresses during flow and that there is a transient deformation, which may vary according to the varying loads during mold filling.
Aside from mechanical loads caused by the melt flow and the pressure field in the cavity, the shrinkage and thermal expansion of the components must be considered. A polymers’ volume contraction causes shrinkage during injection molding and affects the dimensional stability and warping of molded parts. Consequently, this is very important for practical applications and therefore, there are different methods to measure it online in the mold. For example, there is a mechanical method with a membrane in a movable ejector pin or methods using optical sensors.12,13 Here, the dimensional stability of the part thickness is observed.
In transfer-molding with thermosets for micro packaging chips, Schreier-Alt 14 used a Fiber-Bragg-Grid for measuring the stress on the chip during processing. This system is not suitable for injection molding because it is very fragile and cannot endure the high pressure during molding with thermoplastics.
Despite the fact that there has been a great amount of work done in the associated areas, the field of assembly injection molding offers numerous unanswered questions. One deals with the real mechanical loads on small elements in the cavity.
Materials and methods
Material
For the overmolding experiments, a polycarbonate (PC; Makrolon OD2015 from Bayer MaterialScience, Germany) was chosen. Because of its transparency, this material allows an optical analysis of the part after the overflow of the force sensor and, as such, an additional process control. Furthermore, the high viscosity in comparison to other polymers should bring clearer effects.
Material characterization of the PC
Tests on the shear-dependent viscosity of the PC were carried out in a high-pressure capillary rheometer from the company Rosand. The test temperature was varied at three levels (280°C, 300°C, and 320°C). The change in the specific volume of the PC during cooling was determined with a pvT measurement device (type pvT100; SWO Polymertechnik GmbH, Krefeld). The pressure was varied at 1, 800, 1600, and 2000 bar.
Injection molding tool with force sensor
With the aid of Wiesauplast Deutschland GmbH & Co. KG, the author developed an injection mold that allows measuring the complex load on small components directly in the cavity. Figure 2 (left) shows a picture of the sample produced with this tool. With its modular design, the tool allows numerous variations of the specimen geometry as well as process parameters.
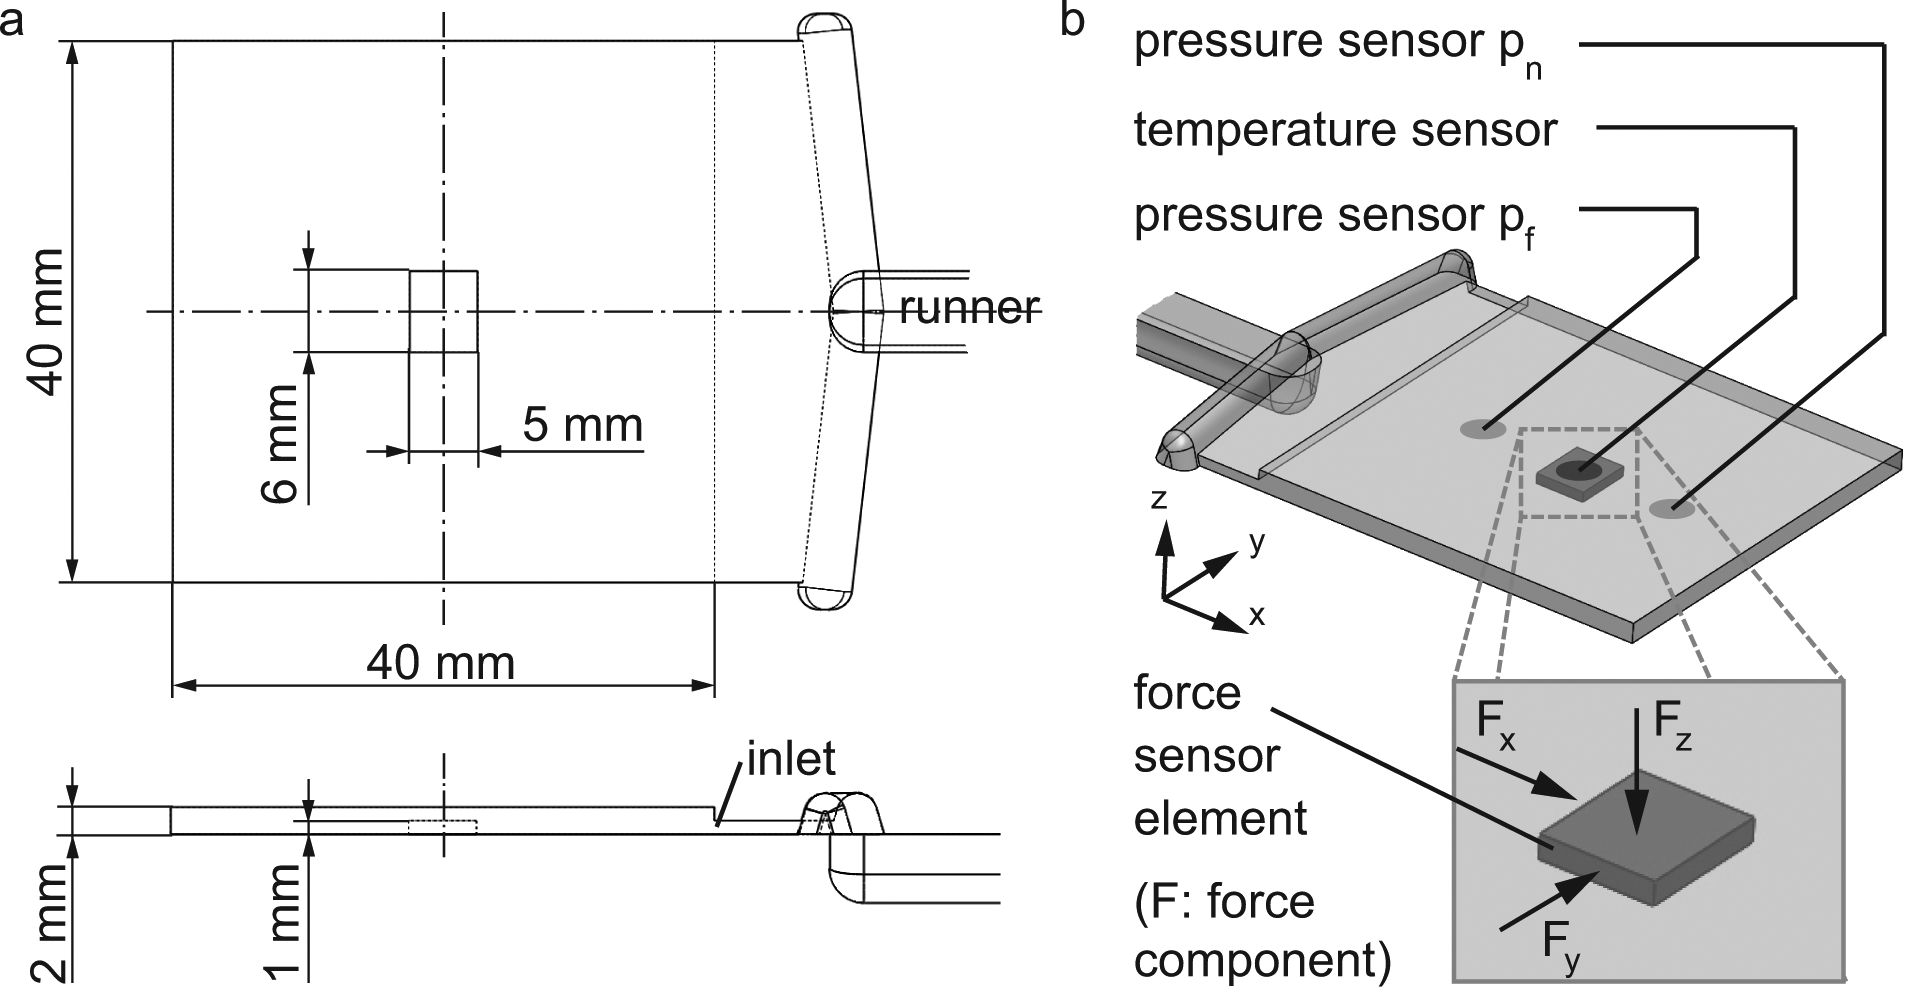
Sample for measuring the forces during overmolding: (a) size of the sample and the measurement element (6 mm × 5 mm × 1 mm) and (b) sensor positions and coordinate system (pn: pressure sensor near the gate; pf: pressure sensor far from the gate).
The mold has two piezoelectric pressure sensors (diameter 4 mm; Kistler, Winterthur) and one infra-red (IR) temperature sensor (diameter 4 mm; FOS Messtechnik GmbH, Schacht-Audorf) on the nozzle side of the mold. These are conventionally used in injection molding and are located along the melt flow direction (pn: near the gate; pf: far from the gate) (Figure 2 (right)). Figure 2 (right) also shows the element for force measurement (6 mm × 5 mm × 1 mm) and its position in the cavity. The force measurement was accomplished with a standard three-way force sensor (Kistler, Winterthur, Switzerland) which was stiffly connected to the measurement element in the cavity. The force measurement is based on the piezoelectric principle. The built-in quartz rings (one for each component of the force) exert a force equivalent charge to a charging amplifier (Kistler, Winterthur, Switzerland). A basic requirement for a force sensor in this application is that it is able to measure highly dynamic processes like the injection molding process under elevated temperatures in the tool. The measurement starts when the mold closes. The pressure sensors’ values and the signal of the force in the perpendicular direction Fz are smoothened out in the following figures.
Force sensor calibration
In order to ensure accurate measurement with the force sensor, it must be mounted with a preload. After installation, the measurement accuracy was tested with the help of weights and the calibration curves were recorded. During these measurements, the tool was heated up to the temperature prevailing during the injection molding process. In the x- and y-directions, the values were approximately 1% higher than the applied forces and in the z-direction about 5%. Due to the sensor’s design, there is a cross-talk between the force components. This effect also depends on the installation. The calibration measurements showed values in the range of the manufacturer’s data as shown in Table 1.
Cross-talk of the components of the force sensor.

Injection molding
The measurements were carried out on the injection molding machine Engel ES 330H/200V/80HL (Engel, Schwertberg, Austria) with a screw diameter of 25 mm. The melt temperature was 280°C, and the mold temperature was 100°C. The injection velocity was 40 mm s−1. To investigate the effects of melt overflow, only short-shots were made, that is, the melt stopped flowing right before the end of the cavity and no packing pressure was applied.
Results and discussion
Material characterization
The PC used has a shear-thinning behavior (Figure 3). At the injection molding temperature of 280°C, its viscosity—measured by the capillary rheometer—decreases about 50% (ca. 100 Pa s to ca. 50 Pa s) in the for injection molding process relevant shear rate range of 103 to 104 s−1. The temperature- and pressure-dependent specific volume indicates the shrinkage potential of the material (Figure 4). According to the material supplier, the molding shrinkage is 0.6%.

Material data PC—temperature T and shear rate γ dependent viscosity η.

Material data PC—temperature T and pressure p dependent specific volume v.
Force measurements
The diagrams in Figure 5 show exemplified temperature and pressure measurements on the surface of the cavity gained by standard temperature and pressure sensors. In Figure 6, the curves of the associated force measurements in three directions are depicted. The measurement started when the mold was closed and ended with the mold opening. A long cooling time was chosen to obtain information on the force development during the cooling period.

Temperature T and pressure p during overmolding (standard infra-red temperature and pressure sensors).
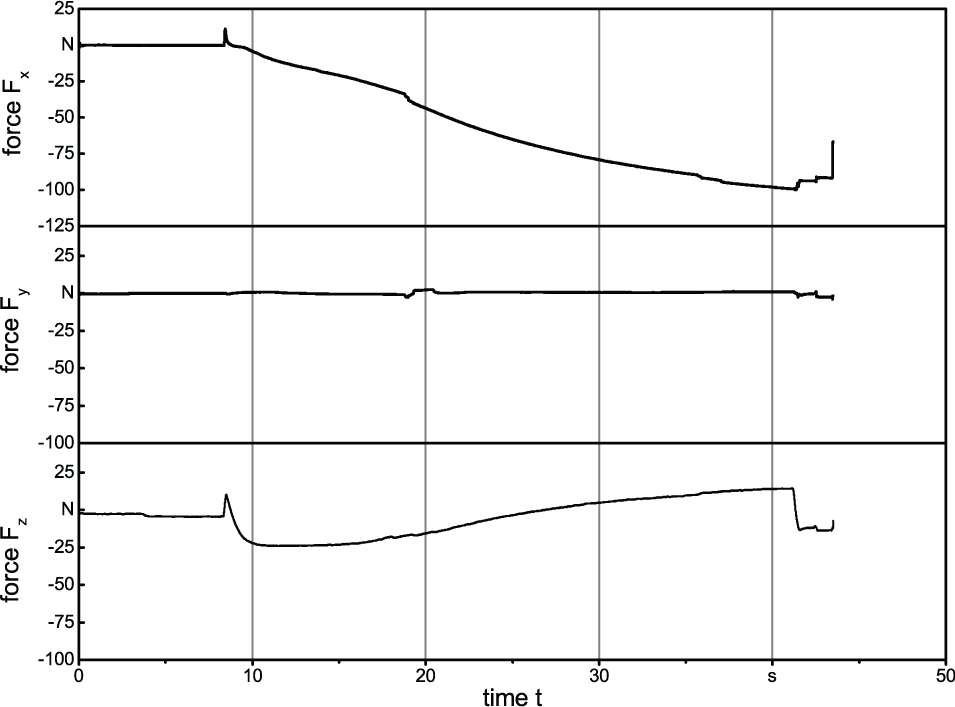
Forces on the small element in the cavity during the overmolding process.
The temperature quickly increased while injecting the melt and eventually reached its maximum, Figure 5, after which it slowly decreased. There was a pressure gradient in the cavity along the flow path during the filling phase, Figure 5. The sensor closer to the gate (pn) showed a pressure peak during filling. Away from the gate (pf), this cannot be observed. Here, the pressure signal rarely rose.
The force profile in the flow direction (Fx) peaks in the positive direction during the filling phase, Figure 6. This happened almost at the same time as the peak of the pressure sensor signal near the gate (pn), Figure 6. This force acted in the direction of flow of the melt. After filling, the force in x-direction dropped and increased opposite to the flow direction, Figure 6. After about 20 s of measurement, a slight fast drop in the signal was recognized. The change in the force signal after about 40 s was caused by the mold opening and the ejection of the part.
In the y-direction, traverse to the sensor, no force Fy could be detected during filling (Figure 6). Here, a slight oscillation occurred after 20 s, too. After this, the force signal was zero again until opening the mold and deforming the part. The force signal in the direction perpendicular to the sensor (Fz) showed, like signal Fx, a peak during the filling phase (Figure 6). The force then decreased quickly. After about 20 s, it went back to zero and increased again until the mold opening.
The peak of the force signal Fx in the flow direction of the melt during the filling phase was caused by the shear stresses and the pressure acting on the sensing element in the cavity while the melt was flowing (Figure 6). At the end of the filling process, the volume shrinkage occurred, resulting in a force signal opposite to the flow direction, which rose continuously until demolding.
Because the melt flow around the sensing element was symmetric, there was no delectable signal in the Fy direction while filling the mold. When calculating a pressure with a peak force signal Fz during filling at approximately 17 N and a surface area of the element to be measured at 30 mm2, the result is about 6 bar. This value is between the maximum pressure measured at this time with the sensor near the gate pn (ca. 14 bar) and the pressure far from the gate pf (0 bar). This corresponds to the sensors’ position.
The effect on the force signals after measuring for 20 s may be explained by the separation of the molded part from the mold wall (Figure 6). At about 20 s, the pressure signals of the pressure sensors at the mold wall also went back to zero. The detachment would explain why there is a short and rapid decrease in the force signal Fx (in the flow direction) with an ongoing decrease once the bond between the part and mold has been removed. The short oscillation of the force signal Fy could also be explained through an uneven peeling. After 20 s, the direction of the force perpendicular to the sensing element changes, too. During the flow over the sensor element, the melt applies pressure to the element and leads to a short peak. Afterwards, the prefix of the force changed may be due to the part’s connection to the mold wall and the shrinkage. When the part disconnected from the wall, the force resulting from the shrinkage could then change (Figure 6).
Conclusion
The results shown in this article prove that the new measurement concept provides data which are coherent to interpret and can thus form the basis for further work in this area. These initial findings lead to the conclusion that for designing of assembly injection molded systems and determining the appropriate manufacturing conditions, a two-part evaluation process should be carried out. Not only the magnitude of force but also the time of exposure and the duration is relevant. During the filling phase, force peaks, and during the cooling phase, constant loads occurred.
Further investigations with this measurement method will bring more information about the influencing factors on the forces like material selection, geometry, and processing conditions. These can also be used for the development of design and processing information and for the improvement of simulation methods.
Footnotes
Acknowledgements
The authors would like to thank the ministry for the promotion of their scientific work in the context of the project “Einhausung von MID-Baugruppen im Montagespritzguss für den Einsatz unter extremen Umweltbedingungen.” Moreover, they wish to extend their thanks to the companies which accompany and support the project: Bayer MaterialScience, Germany, for the materials supplied; the tool supplier Wiesauplast Deutschland GmbH & Co. KG, Wiesau, Germany, for their support with the tool development; and Kistler Instrumente AG, Winterthur, Switzerland, for their support with sensor technologies. The results are part of the dissertation of Dr-Ing. Martina Heinle.
Academic Editor: Seung-Bok Choi
Declaration of conflicting interests
The authors declare that there is no conflict of interest.
Funding
The 16591N IGF-project of the Research Association Molded Interconnect Devices was conducted within the framework of the “Industrielle Gemeinschaftsforschung und - entwicklung (IGF/AiF)” program of the Federal Ministry of Economics and Technology (BMWi).