
Abstract
The objective of this study is to evaluate the repercussions of the pathological deviation of the coxa brevis, femur, and tibia without the pathological deviation of the axis in the femoral or tibial frontal plane. The stress distribution in the proximal and distal joints was evaluated in relation to the deviations using transmission photoelasticity. Two-dimensional femur and tibia models were developed from frontal panoramic radiographs, which were later used to fabricate molds and photoelastic models. A force of 8 N was applied to the top of the femoral head. For the deviation of the coxa brevis and for the femur and tibia without pathological deviation, the stresses were more critical in the calcar region of the proximal femur. In the distal femur and proximal and distal tibia, the stress distributions were in accordance with the models, the proposed fixation conditions, and the long bone geometries. The most important conclusion of this investigation was that joint deviation also alters the stress on all primary joints of the lower extremities. From this study, it will be possible to develop better correction criteria for angular deviations and discharges of bone and joint forces of the lower extremities and to provide refinements to prostheses.
Introduction
The mechanical axis represents the functional discharge of forces from the hip to the ankle, as represented by a straight line that begins in the center of the femoral head and extends to the center of the tibiotalar joint.1–3 In normal conditions, this line should cross the knee up to 9.0 mm medially to the tibial bones.4,5 The mechanical axis depends on the geometrical alignment between the tibia and the femur, which in turn depends on the anatomy of the bones. Thus, for the femur, the mechanical axis is tilted 7 ± 2° relative to the anatomical axis, although both axes coincide on the tibia. 6
Disturbances in the anatomical and mechanical axes of the lower extremities are important, as they affect the locomotion efficiency and can lead to osteoarthritis of the hip, knee, and ankle.5,7–10 The alignment of the lower extremities in the frontal plane is directed by the bone morphology (normal or pathological) and by the mechanical axis that represents the functional discharge of the forces. This axis is represented in the panoramic radiograph of the lower extremities by a line from the center of the femoral head to the center of the ankle. In normal cases, it passes up to 9.0 mm medial to the ankle. 11 This relationship is altered when there is an angular deviation.
The mechanical axis is often used in corrective surgery to align the lower extremities. There are no complete studies, however, of the repercussions of different types of deviations in the various joints of the lower extremities.
Thus, the objective of this study is to evaluate the repercussions of pathological deviations of the coxa brevis, femur, and tibia without pathological deviations of the axis in the frontal plane of the femur and/or the tibia. The stress distributions were evaluated in the proximal and distal joints using plane transmission photoelasticity. The application of compression forces produced internal stresses capable of qualitatively and quantitatively determining the levels and distributions of stresses along the bones and joints due to a change in the alignment, which causes stress redistribution.
Materials and methods
Selection of the deformities
This study used images of bones of the lower extremities (femur and tibia) obtained from frontal panoramic radiographs of the lower extremities of individuals with alterations in their anatomical and mechanical axes of their femurs. These individuals were treated in the Pediatric Orthopedics Sector of the Clinics Hospital of the School of Medicine of Ribeirão Preto of the University of São Paulo (Faculdade de Medicina de Ribeirão Preto da Universidade de São Paulo). All patients had already received radiographs as part of their routine evaluation and treatment. Thus, new images were not necessary for this study.
Inclusion and exclusion criteria
Panoramic radiographs of subjects with simple deviations (that is, deviation at only one anatomical plane.) in the alignment of their lower extremities in the frontal plane were included in the study. In the case of shortening of the lower extremities, the radiographs were collected with compensation of the heels until the pelvis was level. The subjects with radiographs below the necessary technical quality were excluded. Grotesque or combined deviations in more than one plane or more than one deviation in the same bone were excluded. Radiographs with the following deviations were selected: coxa brevis and femur and tibia without pathological deviation of the axis.
Radiographs were selected from patients of both genders of at least 16 years of age (skeletal maturity of the lower extremities). Informed consent forms were read and signed individually by all of the patients selected for the study. The informed consent forms were prepared according to Resolution Conselho Nacional de Saúde (CNS) 196/96 (139.074).
Radiographic technique
The radiographic examination of the individuals included in the study consisted of a frontal panoramic radiograph of the lower extremities obtained in a standardized manner, which shows the hips and all of the lower extremities to the ankle.
A Philips device (Germany) with a radiographic chassis measuring 35 × 91 cm2 was used. To obtain good-quality radiographs, the film focal distance was set at 3 m with 70 kV and 60 mA.
The subjects were placed in a standing position, with their lower extremities in a symmetrical position, their knees extended, and their patellae positioned forward. The X-ray beams were oriented with the horizontal path and the ampoule of the rays directed at the knees (Figure 1).
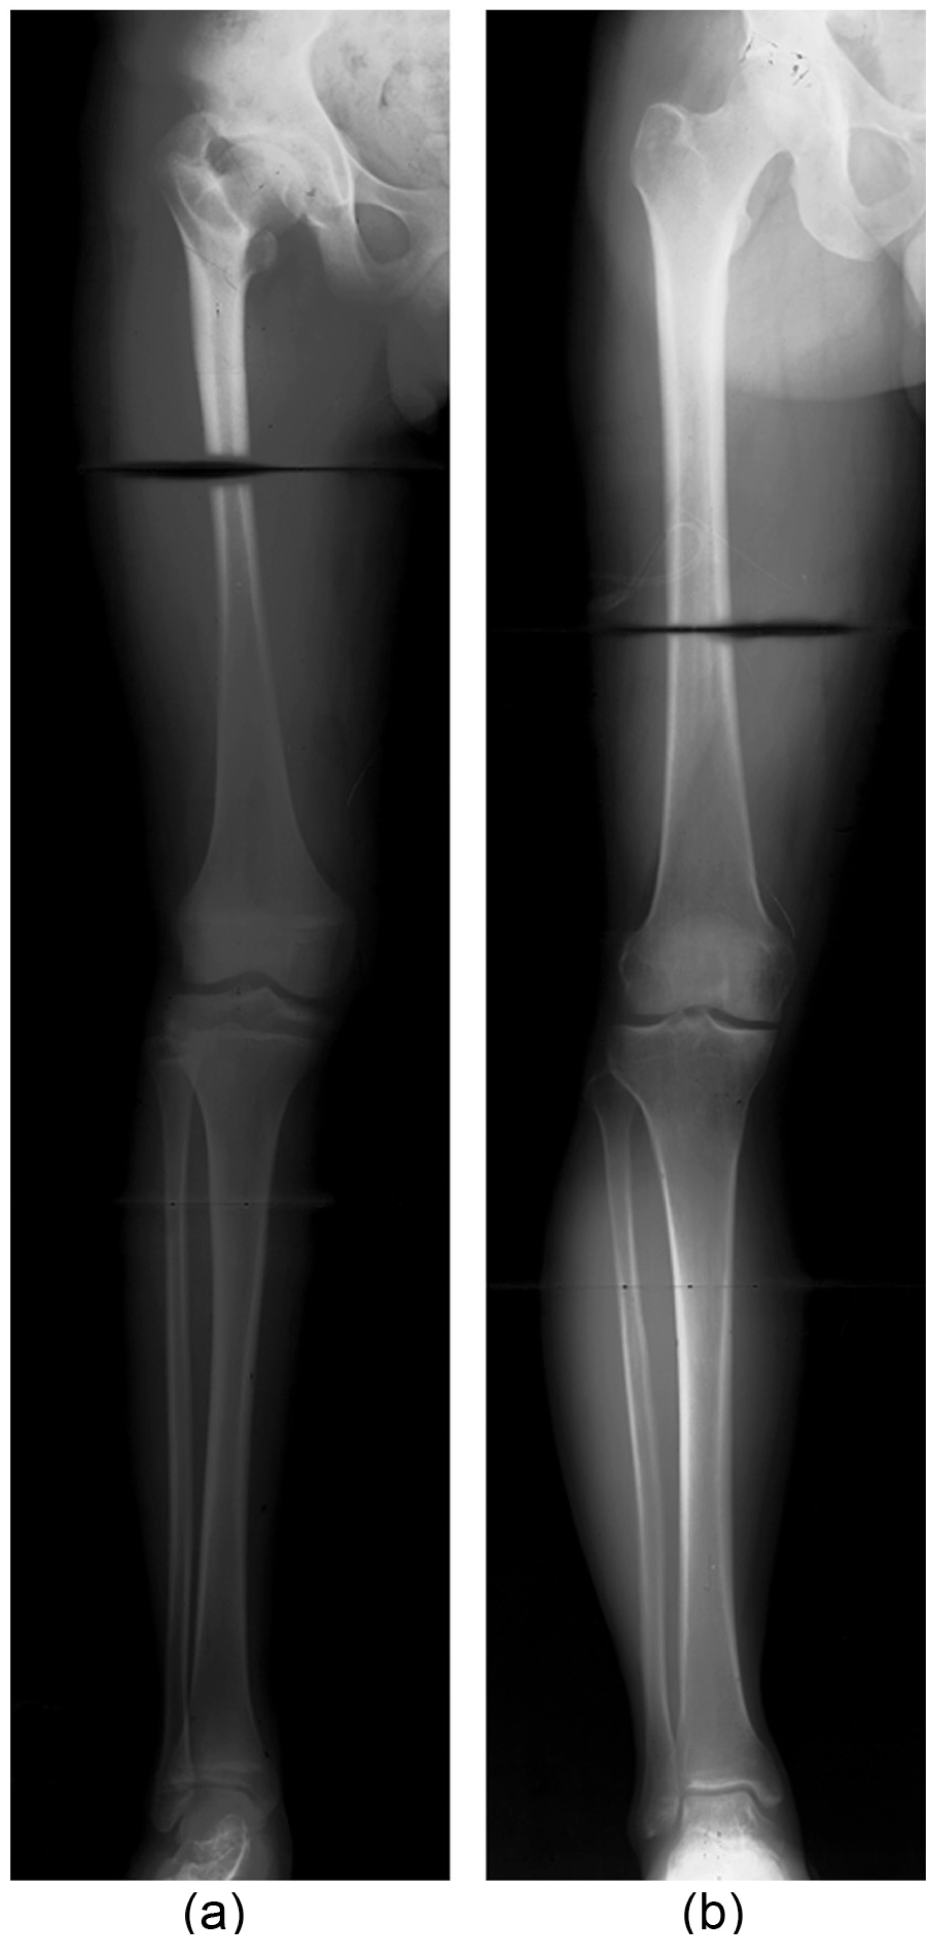
Panoramic frontal view of the lower extremities. (a) Presence of coxa brevis deformity which is characterized by a shorter neck and higher greater trochanter. (b) Femur and tibia without pathological deviations of the axes.
Radiographic analyses
The radiographic examinations consisted of frontal panoramic radiographs of the lower extremities, obtained in a standardized manner to capture the hips and all of the lower extremities to the ankle.
The parameters used to trace the mechanical (Figure 2) and anatomical axes followed the guidelines provided by Paley et al. 12 The values for the mechanical axes (8 ± 7 mm), the cervical–diaphyseal angle (124°–136°), and the lateral distal tibial joint angle (86°–92°) are shown in Table 1.
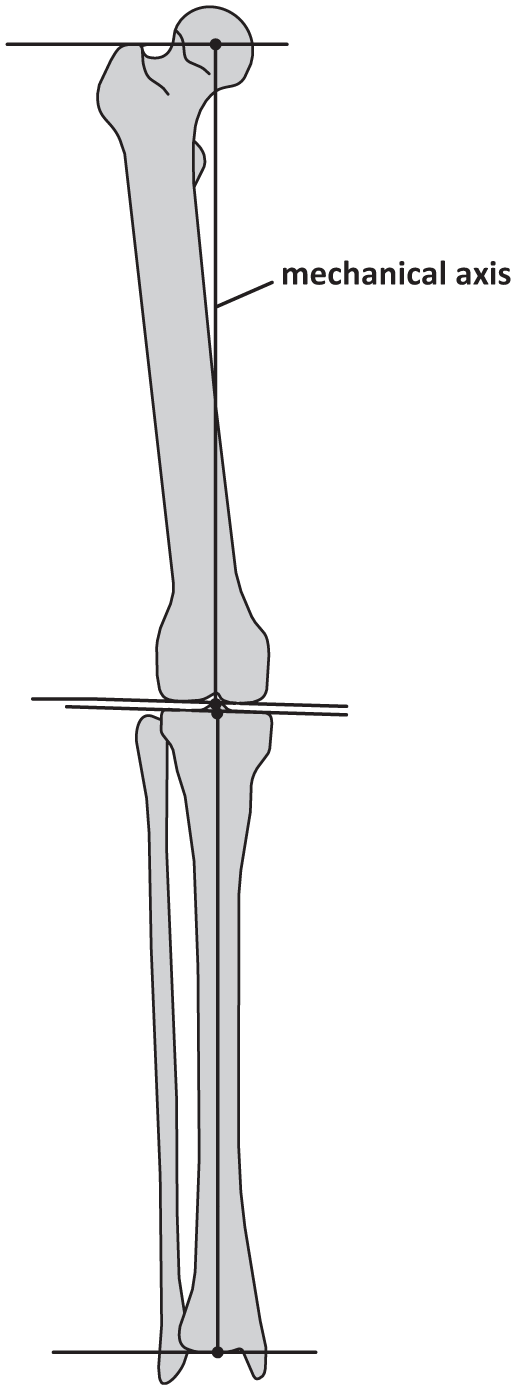
Schematic drawing of the long bones of the lower limbs, to illustrate the mechanical axis on the front plane.
Values of the mechanical axes and the cervical–diaphyseal and lateral distal tibial joint angles in the radiographs used in the analyses.

Geometric model
The geometries of the femurs and tibias were obtained through the frontal panoramic radiographs. The radiographs were scanned at high resolution, maintaining the real dimensions of the femurs and tibias. The images were inserted into AutoCAD® to generate bone contours using the Spline function. The contours are shown in Figure 3.

Geometric models obtained from the radiographs: (a) coxa brevis and (b) femur and tibia without pathological deviations of the axes.
Photoelastic model
From the geometric models, acrylic models of the femurs and tibias were fabricated by water jet cutting, permitting a rigid standardization of the experimental technique (photoelasticity). To obtain the photoelastic models, four acrylic photoelastic molds were used: two for the femurs and two for the tibias. The silicon rubber (Master®) was poured into the photoelastic mold to create a silicone plate, which was positioned on the inside of the mold. The previously made acrylic mold of the femur or the tibia was then placed above this plate. After this procedure, the silicon mixture and the catalyzing agent were poured into the photoelastic mold, permitting reproducibility and good surface finishing of the acrylic mold of the femur and tibia.
On the interior of the acrylic mold of the femur and tibia, only the proximal and distal regions of the bone structures were filled with the flexible photoelastic epoxy resin and the catalyzing agent (Polipox®). The bodies or diaphyses of these structures were made of acrylic. The limits of the proximal and distal articular segments (hip, knee, and ankle) were defined by the epiphyseal square of Heim, for which the sides have the same length as the widest part of the epiphysis. 13
Four photoelastic models were made: two for the deviation of the coxa brevis and two for the femur and tibia without pathological deviations. All of the models were 15.0 mm thick. The photoelastic resin had an optical constant of 0.2 N/mm fringe, a Modulus of Elasticity of 4.51 MPa, and a Poisson coefficient of 0.4 v.
The photoelastic analysis was performed using a transmission polariscope during the application of a compression force. The acetabulum was represented in an anatomical manner in two planes, using an acrylic mold for each type of deviation of the anatomical and mechanical axes of the femur and tibia. The acetabular mold was positioned in an anatomical manner over the femoral head, and an intra-articular mold made of silicon rubber was interposed to uniformly fill the space between the acetabular and femoral mold to biomechanically simulate the articular cartilage. A compression force of 8 N was applied to the top of the femoral head using an acrylic hemi-cupula that represented the acetabulum.
The complete set (acetabulum–femur–tibia) was positioned in the load application device at 17° of the valgus in the frontal plane relative to the vertical axis, according to the Pauwels 14 principles. The internal stresses were analyzed in the proximal regions of the femurs in a qualitative and quantitative manner (KPa).
The shear stresses were calculated in a standardized manner with points located every 5.0 mm along the entire length of the photoelastic model. Thus, the quantity of points varied according to the geometry for the femurs and tibias. The proximal region of the femur was divided into the trochanter, Ward’s triangle, stress range, calcar, and proximal, medial, and distal thirds regardless of the type of deviation. The distal regions of the femur and tibia and the proximal region of the tibia were divided into medial, central, and lateral thirds.
For the coxa brevis deviations, 88 points were analyzed for the proximal femur (PF), 125 points were analyzed for the distal femur (DF), 99 points were analyzed for the proximal tibia (PT), and 32 points were analyzed for the distal tibia (DT) (Figure 4). In the femurs and tibias without pathological deviations of the axes, 155 points were analyzed for the PF region, 141 points were analyzed for the DF region, 100 points were analyzed for the PT region, and 39 points were analyzed for the DT region (Figure 5). The value used for the optical constant was 0.2 N/mm fringe.

Schematic of the points analyzed in the coxa brevis: (a) proximal femur (PF), (b) distal femur (DF), (c) proximal tibia (PT), and (d) distal tibia (DT).

Schematic of the points analyzed in the femur and tibia without pathological deviations of the axes: (a) proximal femur (PF), (b) distal femur (DF), (c) proximal tibia (PT), and (d) distal tibia (DT).
The procedure to obtain the sheer stress values was similar to that used in the vertical polariscope, applying the Tardy compensation method. 15
Results
A qualitative analysis was performed for the photoelastic models corresponding to the PF, DF, PT, and DT groups for deviations of the coxa brevis, femur, and tibia without pathological deviations of the axes. In the PF group, the location of the beginning of the fringe orders and the greatest concentration of stress was in the region of the calcar regardless of the deviation. For deviations of the coxa brevis and the tibia and femur without pathological deviation of the axes, the locations of the beginning of the fringe orders were in the medial third regions of the femoral heads. For deviations of the coxa brevis, the regions with the lowest concentrations of stress were the trochanters, while in the femurs and tibias without pathological deviations, these regions were in the Ward’s triangle (Figure 6).

Pattern of the isochromatic fringe orders obtained during the analyses of the proximal femurs (PF) for the following deviations: (a) coxa brevis and (b) femur and tibia without pathological deviations of the axes.
In the DF group, for the coxa brevis deviations, the concentrations of stress were highest in the lateral third regions and lowest in the medial third regions. In the femurs and tibias without pathological deviations of the axes, the regions with the highest and lowest concentrations of stress were the central and medial thirds, respectively (Figure 7).

Pattern of the isochromatic fringe orders obtained during the analyses of the distal femurs (DF) for the following deviations: (a) coxa brevis and (b) femur and tibia without deviations of the pathological axes.
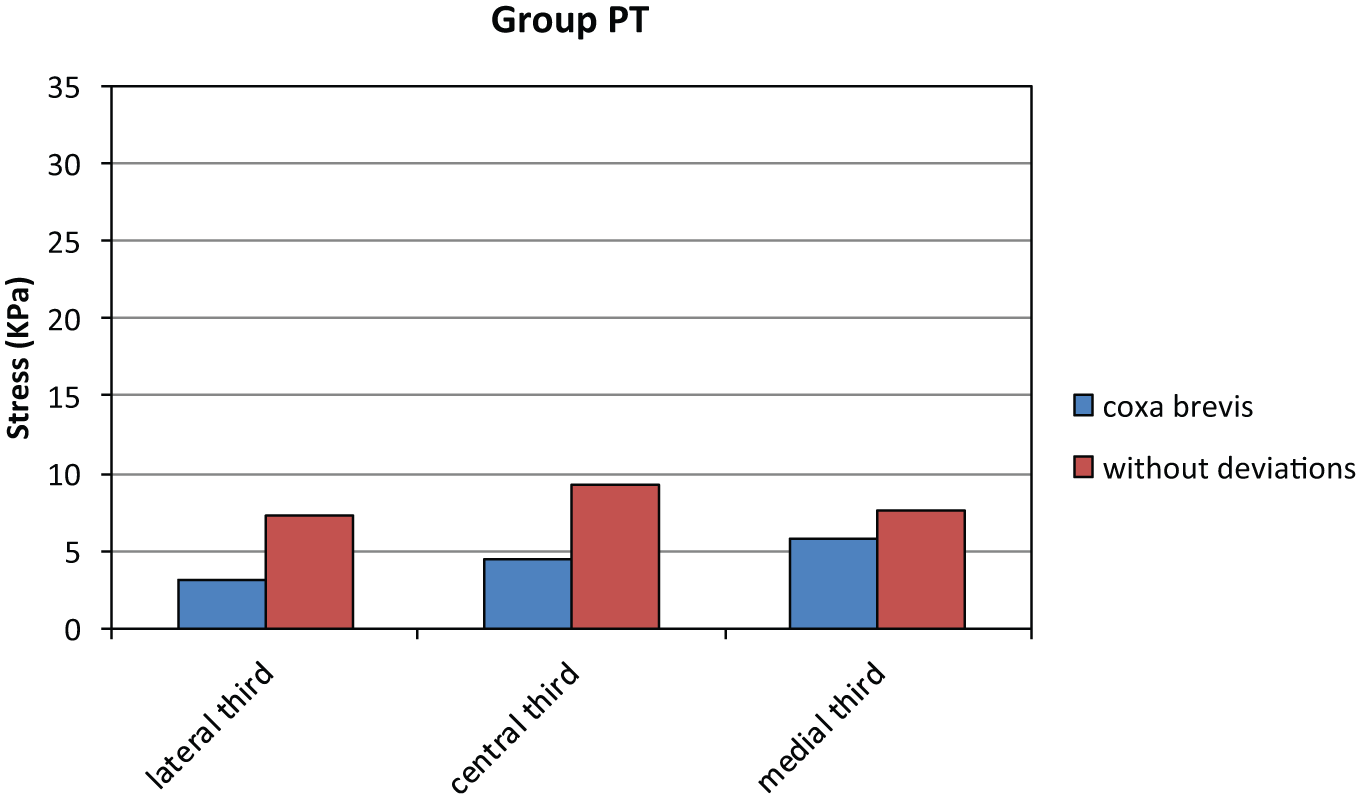
In the PT group, for the deviation of the coxa brevis, the highest stress levels were in the medial thirds and the lowest levels were in the lateral thirds. In the femurs and tibias without pathological deviations of the axes, the regions with the highest and lowest concentrations of stress were the central and lateral thirds, respectively (Figure 8).

Pattern of the isochromatic fringe orders obtained during the analyses of the proximal tibias (PT) for the following deviations: (a) coxa brevis and (b) femur and tibia without pathological deviations of the axes.
In the DT group, for the deviation of the coxa brevis, the stresses were highest in the medial thirds, while in the femurs and tibias without pathological deviations of the axes, the stresses were highest in the lateral thirds (Figure 9).

Pattern of the isochromatic fringe orders obtained during the analyses of the distal tibias (DT) for the following deviations: (a) coxa brevis and (b) femur and tibia without pathological deviations of the axes.
With respect to the distributions of stress, in all of the experimental groups, we observed greater applied load, greater formation of fringes along the photoelastic model, and, consequently, greater stresses in the most critical area.
The results obtained are in agreement with the models, the proposed fixation conditions, and the geometries of the long bones. For different fixation conditions, different results may be observed. Thus, as the compression force increases, the stresses increase beginning in the region of the calcar.
In the quantitative analysis, the Tardy compensation method was used to determine the sheer stress values (τ) in the experimental groups PF, DF, PT, and DT for the two types of deviations (coxa brevis and femur and tibia without pathological deviations of the axes).
An analysis of the general behavior of the photoelastic models was performed for all of the groups for each type of deviation. Graphics were composed to represent the values of the general averages of the shear stresses with points located according to the seven regions (trochanter, Ward’s triangle, stress band, calcar, proximal, medial, and distal thirds) that make up the PF region in the three types of deviations (Figure 10).

The average values for shear stress obtained through analysis of the proximal femur group (PF).
Figures 11–13 show the distributions of the general averages for the shear stress values in the DF, PT, and DT groups with points located in three regions (lateral, central, and medial thirds) for the deviations of the coxa brevis and femur and tibia without pathological deviations of the axes.
Average shear stress values obtained through analysis of the distal femur (DF) group.

Average shear stress values obtained through analysis of the proximal tibia (PT) group.

Average shear stress values obtained through analysis of the distal tibia (DT) group.
Discussion
Although the concept of anatomical and mechanical deviations of the lower extremities is not new in orthopedics, the subject has recently received greater interest due to the study by Paley 6 about the correction of complex deviations. There is also greater interest due to the more widespread use of articular prostheses that are more personalized and that must be in harmony with the local stresses.
However, previous studies concentrated more on the effects of the deviations on the affected joints rather than the effects of simple deviations of the joints above and below, with even less emphasis on the combined deviations. Thus, currently, for a knee prosthesis surgery, the surgeon knows that the frontal angle of the joint must be restored, but when there are associated deviations in the hip and ankle, there is no detailed information about how to proceed.
With our study, it is now possible to determine how anomalous stresses are distributed through the proximal and distal joints to establish which deformities are most deleterious. For example, our study can be used for prostheses in deformed bones, with or without the need to correct deviations secondary to the primary deviation.
The originality of this investigation is in studying the association of deviations of the anatomical axis and the repercussions on the entire extremities, not just in the proximal regions. According to Mullaji and Shetty, 16 the permanence of the deviation of the valgus ankle can cause lateralization of the mechanical axis after a total arthroplasty of the knee. This can cause an excessive overload in the lateral region of the ankle, potentially generating complications in the implant. For this reason, it is very important to evaluate the entire ankle in detail.
Deviations of the mechanical axes of the lower extremities cause important modifications in the distribution of forces and stresses, not only in the closest joints but also in more distant joints. This can have important repercussions in terms of complications observed in prostheses with wearing and loosening or degeneration of other joints, even with the correction of the primary deviation.
Prolonged deviations in the mechanical axes lead to joint dysfunctions, leading to a process of wear that causes pain and restriction of movements and requires joint replacement treatment with prostheses in advanced cases. 17 On the other hand, the deviations need to be corrected before or at the time of arthroplasty. Currently, however, surgeons are more concerned about the correction of the deviation of the joint that is being operated on. Our results provide preliminary evidence that the alignment of deviations, even in other bones or regions, significantly alters the distribution of forces in the entire lower extremity.
The alignment of the lower extremities is characterized by the physiological angles of the proximal region of the femur, knee, and ankle that must be synchronically aligned such that the final mechanical axis is placed up to 9 mm medially at the center of the knee.3,18–20
In the coxa brevis deviation, there is a more horizontal orientation of the pelvis, increasing the downward shear forces on the femoral head. The compression forces are significantly reduced due to the lateral and superior positioning of the larger trochanter, increasing the effective stress angle. The greater the varism, the greater the medial shear force.
In femurs and tibias without pathological deviations in the PF regions, the stresses were greatest in the calcar region followed by the medial third region. This is in accordance with the classical concepts. In the DFs and PTs, the stresses were distributed in a centralized manner, as expected by the deviations. In the DTs, the stresses were highest in the lateral third regions. This may have occurred because the mechanical axes were traced in a standardized manner, without considering the deviations in valgus of the hindfoot (talus and calcaneus).
Some of our results are considered to be preliminary, as some alterations of the stresses are difficult to explain. Future studies will delve deeper to evaluate the alterations of the deviations in the various joints. A second follow-up study will employ the finite element method to better explain the results. After this study is completed, it will allow for the development of better correction criteria for angular deviations, discharges of bone, and joint forces of the lower extremities and provide improvements for prostheses.
Conclusion
The deviation in the mechanical axis of the coxa brevis caused an alteration in the distribution of stresses in both the femur, which was expected, and the tibia (proximal and distal). The stresses were also altered in the deviation of the femur and PT. The most important conclusion of this investigation, however, was that a deviation in a joint can also cause an alteration in the stresses of all of the primary joints of the lower extremities.
Footnotes
Declaration of conflicting interests
We certify that the results of this article neither have nor will confer a financial benefit to us or on any organization with which we are associated. We certify that all applicable financial and material support for this research (e.g. NIH or NHS grants) is clearly identified on the title page of the manuscript.
Funding
This project was funded by FAPESP (funding 2012/08390-0).