
Abstract
Electric vehicles have replaced many gasoline vehicles in urban environments. The magnitude of vibrations and emissions from electric vehicles are less than those from conventional gasoline-powered vehicles. However, electric vehicles still have mechanical vibrations, such as those created by the power system. During vehicle acceleration, driveline vibration is very prominent. This work focuses on vehicle vibration caused by the electric powertrain in electric vehicles under rapid acceleration/deceleration and gear shifting. Since the dynamic response of an electric motor is rapid, driving torsional vibration arising from acceleration/deceleration and gear shifting is typically transmitted from driveline to vehicle’s body, adversely affecting a driver’s comfort. This work presents a novel effective control logic that reduces vibrations from an electric driveline system. This system controls the electric motor to suppress driveline torsional vibration transmitted to the driver’s seat, effectively reducing vertical vibrations and enhancing driver comfort. This work conducts simulations and hardware tests. In the development of the driveline and motor control logic, Adaptive Modeling Environment for Simulation analytical software is applied to create the driveline system model. To model structural vibrations, HyperMesh is used, and LS DYNA is applied to simulate free vibration and forced vibration. The analytical results for free vibration are compared with empirical data. The analytical results for driveline dynamics are applied as input for the finite element model to analyze forced vibration. Vibrations from the electric driveline move through the motor mount and frame to the driver’s seat track. The simulation results demonstrate this control logic strategy applied to an electric bus motor controller effectively reduces fluctuation in driveline torque during acceleration by up to 84.19% and during gear shifting by up to 44.96%. The reduction in vibration of the driver’s seat track during fixed-gear acceleration was maximal at 45.96%, and the reduction during gear shifting was 24.11%.
Introduction
As a transportation mode that reduces emissions of carbon dioxide and adverse environmental effects, electric vehicles have garnered considerable attention. The noise, vibration, and harshness (NVH) performance requirements are high in custom’s demand for electric vehicles. The contribution of driveline torsional vibration to a vehicle’s NVH quality is significant, such that dynamic torsional vibration analysis is very important.
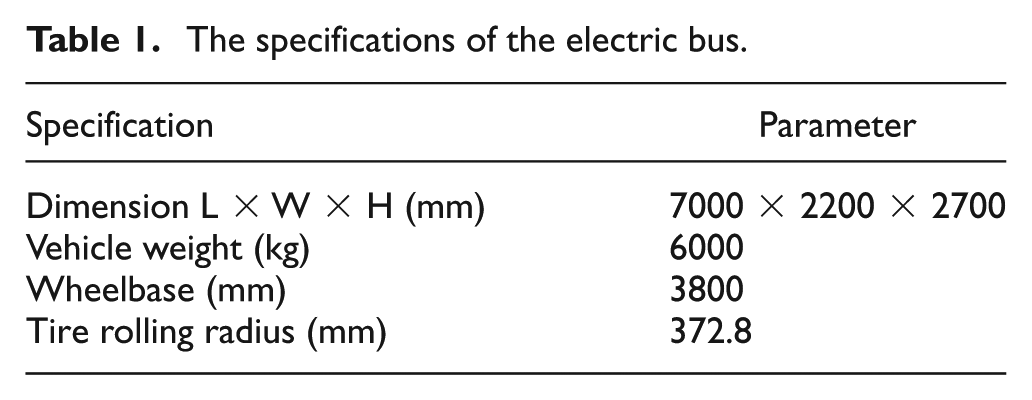
The electric vehicle has replaced the internal combustion engine (ICE) driveline with an electric motor power system, such that vibrations caused by the explosive power of an ICE no longer exist. That is, electric vehicles have fewer vibrations and emissions than conventional vehicles. However, electric vehicles without an engine explosion vibration to disguise as a background make mechanical vibrations, such as the driveline system vibration, more obvious. During vehicle launch, driveline vibrations are especially prominent. This study focused on the electric bus (Figure 1). The specifications of the bus are listed in Table 1. The riding observational test indicates that vibrations during acceleration are obvious, as are vibrations when a driver shifts gears. Although the overall amount of vibrations is less than that of traditional gas-powered buses, these vibrations can still be uncomfortable for passengers and drivers. Ehsani et al. 1 established dynamic system simulation models for electric vehicles using an electric motor. The model used electric motors and a battery pack to replace the ICE as the power source, while all other components remained the same. Zhong and Wei 2 examined the differences between the electric driveline system and conventional gasoline-powered vehicles. In the electric driveline system, the power source was replaced with a motor, and the transmission had no clutch. The transmission system also lacked a torsional vibration absorber, resulting in poor damping. However, the overall electric power system responds rapidly to motor torque but its damping effect is insufficient. Sudden changes in motor torque, such as during rapid acceleration, cause torsional vibration of the driveline system. Although some studies controlled the motor to inhibit vibrations, Karikomi et al. 3 studied vehicle responses. This work effectively suppresses vibrations using a novel torsional vibration-control system. Feed-forward compensation is applied to suppress the torsional vibration due to motor torque, and feedback compensation suppresses vibrations caused by external interference and model errors. Inagaki et al., 4 who examined the use of a switched reluctance motor (SRM) as a power source for electric vehicles, developed 2-degree-of-freedom (DOF)-H∞, a control logic, to control rapid responses to torque and reduce both vibration and noise. Fujimoto et al. 5 investigated the use of the ICE engine and the electric motor as a power source for vibration-related problems in hybrid vehicles and developed a method that uses a motor’s rapid response to reduce vibrations generated during acceleration. Moriya et al. 6 studied both electric cars and hybrid vehicles. The quick responses of the electric motor reduce driver comfort. Therefore, feedback control for motor speed to predict body acceleration is applied to reduce torsional vibration from the power system. Tang et al. 7 analyzed the vibration caused by the compound planetary gear of power-split hybrid electric vehicle. A theoretical model was built to evaluate the noise level. In their study, both the pure electric mode and the hybrid drive mode were tested and verified. Hwang 8 studied vibrations related to the two-mode hybrid driveline system during the auto-start of ICE engine. With quick response of electric motor torque, the electric motor could compensate for driveline vibration caused by the gasoline engine and drive shaft.

The electric bus.
The specifications of the electric bus.
To complete the complex design work within a short period, car manufacturers have harnessed computer-aided engineering (CAE) technology. Early analysis of structural dynamic responses used a modal superposition method or direct integration method. 9 The direct integration method includes two kinds of methods, namely, an explicit method, such as the difference method and Runge–Kutta method, 10 and an implicit method, such as the Houbolt method, 11 Newmark method, 12 and Wilson-θ method. 13 Improved methods, such as the Hilber–Hughes–Taylor (HHT)-α method 14 and collocation method, 15 have the advantages of, say, unconditional stability and controllable high-frequency modal numerical damping effects.
To analyze structural vibrations, Wang and Li 16 used the finite element method (FEM) for a numerical solution and applied ANSYS software to construct an FEM boat model for vibration analysis. A reduced-scale model was constructed for experimental modal analysis. An equivalent FEM boat model was verified using the scaled structure. Chen and Hwang 17 evaluated the structure vibration of the vehicle traveling on the random road. The fatigue life of components of vehicle structure was predicted. Turek and Ventura 18 tested a highway bridge for vibrations, and the experimental measurements were applied to validate the computer models for subsequent design. With basic vibration measuring instruments, such as an accelerometer, the amplitude distribution in the time domain can be identified, helping elucidate the overall waveform and peak amplitude of vibrations. The Fourier transform can convert the time-domain data into frequency-domain data, and it can identify the various frequency components of a vibration signal. Corelli and Brown 19 used an impact hammer for modal analysis, which helped identify the noise associated with the natural frequency of vibrations. Blood et al. 20 and Gomez-Gil et al. 21 evaluated the seat vibration with different seat heights and types of seat materials. Nassiri et al. 22 evaluated the comfort of commercial bus passengers regarding the noise and whole-body vibration. Their study showed that the engine and wheels were the major sources of vibration passed to the insides of the buses. Li et al. 23 measured the seat vibration of an electric bus and evaluated the passengers’ comfort. Sekulić and Dedović 24 analyzed the vibration comfort of the passengers for an intercity bus using a 7-DOF model. The criteria of comfort are based on the international standard ISO 2631 and Acoustical Society of America ASA S2.72.25,26
This work suppresses vibrations in electric buses via a novel motor control strategy. That is, torsional vibration of the driveline system transmitted to the bus driver’s seat through the bus structure can be suppressed, effectively reducing vertical vibration of the driver’s seat. Thus, comfort while driving is enhanced. This work conducts the simulations and hardware tests. In the development of the driveline and motor control logic, Adaptive Modeling Environment for Simulation (AMESim) software is applied to create the driveline system model. To model structural vibrations, HyperMesh is used, and FEM is applied to simulate free vibration and forced vibration. The analytical results for free vibration are compared with empirical data. The analytical results for driveline dynamics are applied as input for the finite element model to analyze forced vibration. Vibrations from the electric driveline move through the motor mount and frame to the driver’s seat track.
The remaining sections are as follows: the development of the driveline model and analysis, the finite element modeling and analysis of the electric bus, the simulation results for vibration reduction, and the conclusion.
Driveline model and analysis
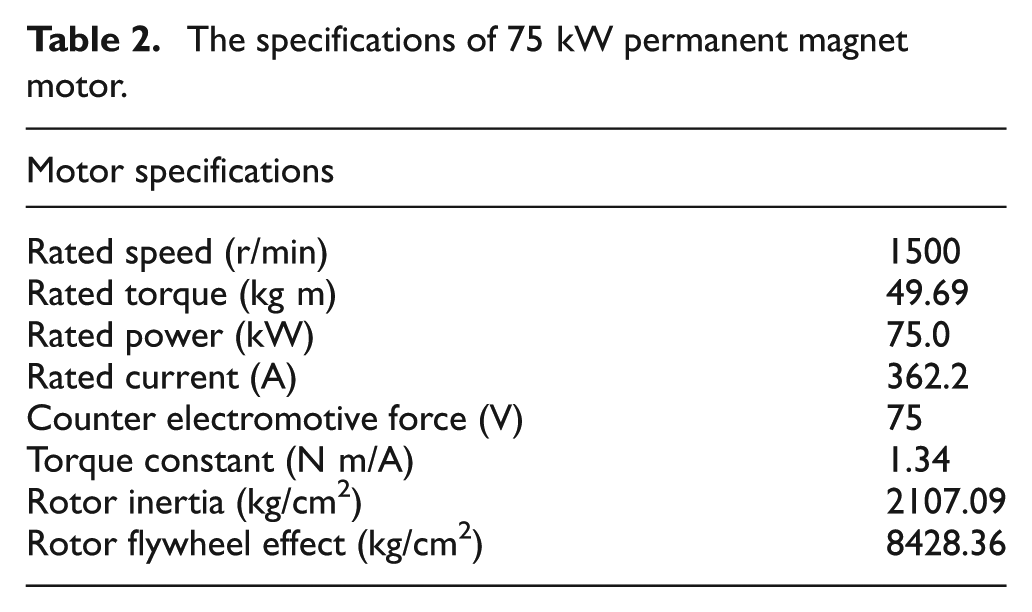
The driveline system of the electric bus in this work has a 75-kW permanent magnet synchronous motor, a clutch, a six-speed manual transmission, a drive shaft, and a differential. 1 The specifications of the motor are listed in Table 2. The driveline system is modeled using AMESim software. Figure 2 shows the diagram for the power system for the electric bus.
The specifications of 75 kW permanent magnet motor.

The driveline system for the electric bus.
Control strategy for vibration reduction
The bus driveline system includes a long drive shaft, gearbox, and differential. Due to the slenderness of the drive shaft, the rotational stiffness of the drive shaft is low and so is the natural frequency. During the bus acceleration or gear shifting, the quick motor torque response could cause a twist of the drive shaft and further trigger the vibration of the driveline system. The vibration-reduction control is applied to compensate the torsional vibration of the drive shaft whose major vibration frequency is below 20 Hz. The transfer function uses a wider frequency range and emphasizes the frequency range below 80 Hz for human comfort consideration. This is according to the general guide, ISO 2631 and ASA S2.72,25,26 which described that human is more sensitive to the frequency range between 1 and 80 Hz.
In this study, the source of vibration for this electric bus during acceleration and gear shifting is mainly caused by the torsional vibration of the drive shaft. Therefore, this research focuses on the vibration caused by the driveline system whose frequency is lesser than 20 Hz, and the vibration-reduction control logic is developed and applied to the electric driveline system to compensate the torsional vibration of the drive shaft, as shown in Figure 3. The proposed control logic predicts vehicle driving torque acting on the tires based on motor acceleration, and this torque is then compared with the demanded torque of the power system. The differences between these two sets of torque values are applied to adjust motor torque. Since the vibration frequency of the drive shaft is below 20 Hz, a low-pass filter is applied to reduce the noise effect from the high-frequency signals. The transfer function uses the frequency range below 80 Hz for human comfort consideration. The gain is used to scale down the adjust torque which is calculated based on the difference between driver-demanded torque and vehicle driving torque. The driver-demanded torque is the torque calculated based on the acceleration pedal. The vehicle driving torque is the torque used to drive the vehicle which is delivered from the differential. In general, drivers do not expect any vibration during vehicle acceleration or gear shifting; therefore, the objective of the study is to smooth the vehicle acceleration and reduce the acceleration vibration by adjusting the motor driving torque. And the amplitude of the gain is adjusted to obtain good controlled performance to suppress the acceleration surge. The control parameters are obtained through the design of experiment. 6 With the correcting torque, torsional vibration of the driveline system can be effectively reduced when the vehicle accelerates and gears are shifted. Figure 3 shows a schematic diagram of the control method.

Schematic diagram of the driveline control system for torsional vibration reduction.
The equivalent moment of inertia, Jv , of the inverse reference model (Figure 3) is derived as follows

where Jv is the equivalent moment of inertia (kg m2) of vehicle mass and the driveline system, Jw is the equivalent moment of inertia relative to the wheel of the drive shaft, M is the vehicle mass (kg), r is the tire radius (m), G 1 is the differential gear ratio, and G2 is the transmission gear ratio.
Electric power system simulation and analysis
The main source of vibrations for an electric power system is the electric motor, which has highly dynamic response characteristics. This feature allows the motor to produce quick acceleration response, which causes the higher rotational deflection of the drive shaft, which is very long in a bus, and then torsional vibrations. In this work, the driveline system is modeled to analyze driveline vibrations during fixed-gear acceleration/deceleration and when a driver shifts gears. Figure 4 shows the steps in vibration analysis using AMESim modeling software. The control logic developed to reduce vibrations will be added to each model for comparison.
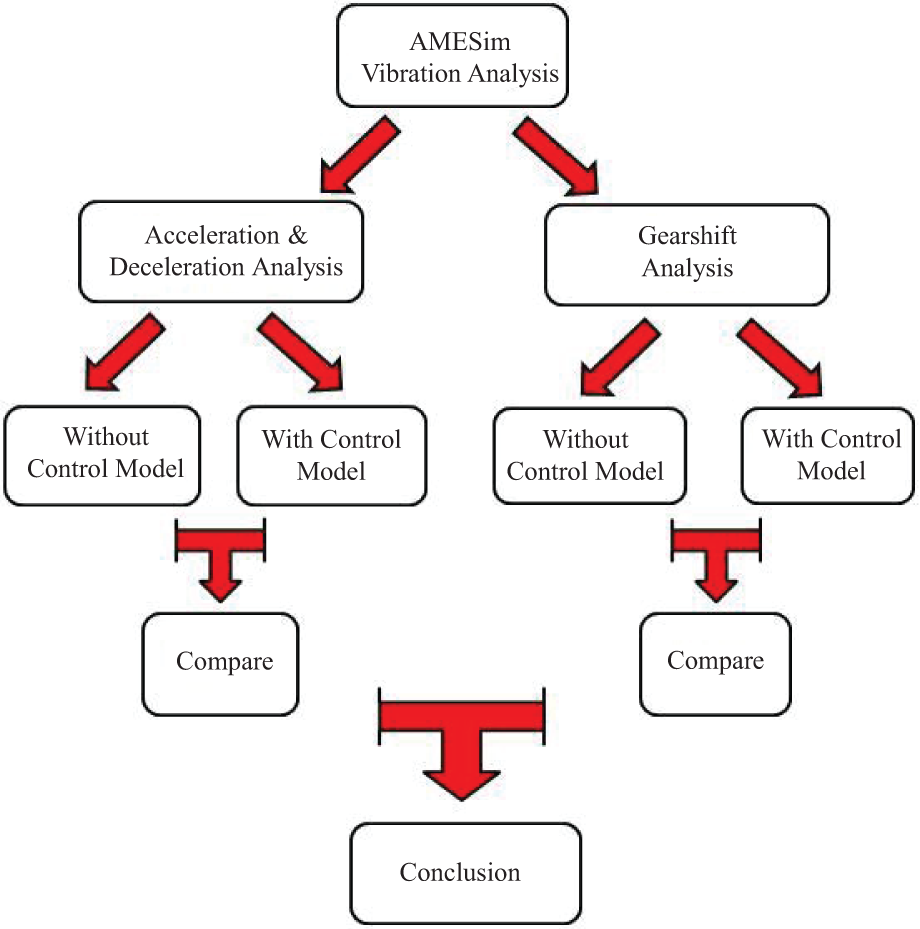
Analytical flowchart for driveline vibration reduction.
Electric motor model
The electric motor model used in this research is the permanent magnet motor model provided in the commercial software, AMESim. The motor torque is based on the generalized Ohm’s law providing the base equations for various phases


where Usd
and Usq
are the stator voltages on the Park’s d-axis and q-axis, respectively; Isd
and Isq
are the stator currents on the Park’s d-axis and q-axis, respectively; Rs
is the stator winding resistance;


where Isd and Isq are the stator currents on Park’s d-axis and q-axis, respectively; Lsd and Lsq are the stator cyclic inductances on Park’s d-axis and q-axis, respectively. The electromagnetic torque is given by

Fixed-gear driveline model
Two fixed-gear models are used: one without a vibration-reduction method, the base model; and the other with vibration control, the control model. During simulated acceleration, motor speed is maintained initially at 1500 r/min. The accelerator pedal is then pressed, and motor torque is increased to 487.459 N m in 0.1 s. When motor speed reaches 2200–2400 r/min, the accelerator pedal is released and the vehicle decelerates. Figure 5(a) shows the AMESim base model, comprising the driveline and vehicle body. Figure 5(b) is the AMESim controlled model, comprising the base model and vibration-reduction algorithm. The vibration-reduction control diagram is depicted in Figure 6. This control is applied to the AMESim driveline. The vehicle acceleration is estimated by directly taking the derivative of motor angular velocity. The vehicle driving torque is then estimated by the product of motor angular acceleration and the vehicle equivalent inertia. A design of experiment (DOE) is used to find the control variables for better vibration reduction.

The AMESim driveline fixed-gear model: (a) fixed-gear base model and (b) fixed-gear model with vibration-reduction control.

The vibration-reduction control diagram.
Gear-shifting driveline model
Two gear-shifting models are used: one without a vibration-reduction method and one with the proposed vibration-reduction control logic. During the simulation of gear shifting, the initial motor speed is 1500 r/min. The accelerator pedal is then depressed, and the motor torque is increased to 487.459 N m in 0.1 s. When motor speed reaches 2200–2400 r/min, the accelerator pedal is released and the clutch is disengaged to shift gears. After the gear is shifted, the clutch is re-engaged. Figure 7(a) shows the AMESim gear-shifting base model, and Figure 7(b) shows the AMESim gear-shifting control model, comprising the base model and the vibration-reduction method.

The AMESim driveline gear-shifting model: (a) gear-shifting base model without vibration-reduction control and (b) gear-shifting model with vibration-reduction control.
Finite element modeling and analysis
This work attempts to reduce vibrations caused by driveline torsional vibration. Driveline vibration passes through driveline mounts to the vehicle’s body and through the body to the driver’s seat. These vibrations can make a driver and passengers uncomfortable. This work uses driver-seat acceleration to assess vibration amplitude and improvement via vibration reduction. Finite element models, the driveline system model and vehicle structure model, are discussed as follows.
Driveline FEM modeling
The driveline system has an electric motor, a clutch, a six-speed manual transmission, a drive shaft, and a differential. HyperMesh is applied as a pre-processor, and three-dimensional (3D) solid elements and two-dimensional (2D) shell elements are used for the FEM mesh. Figure 8 shows the FEM models of these driveline components.
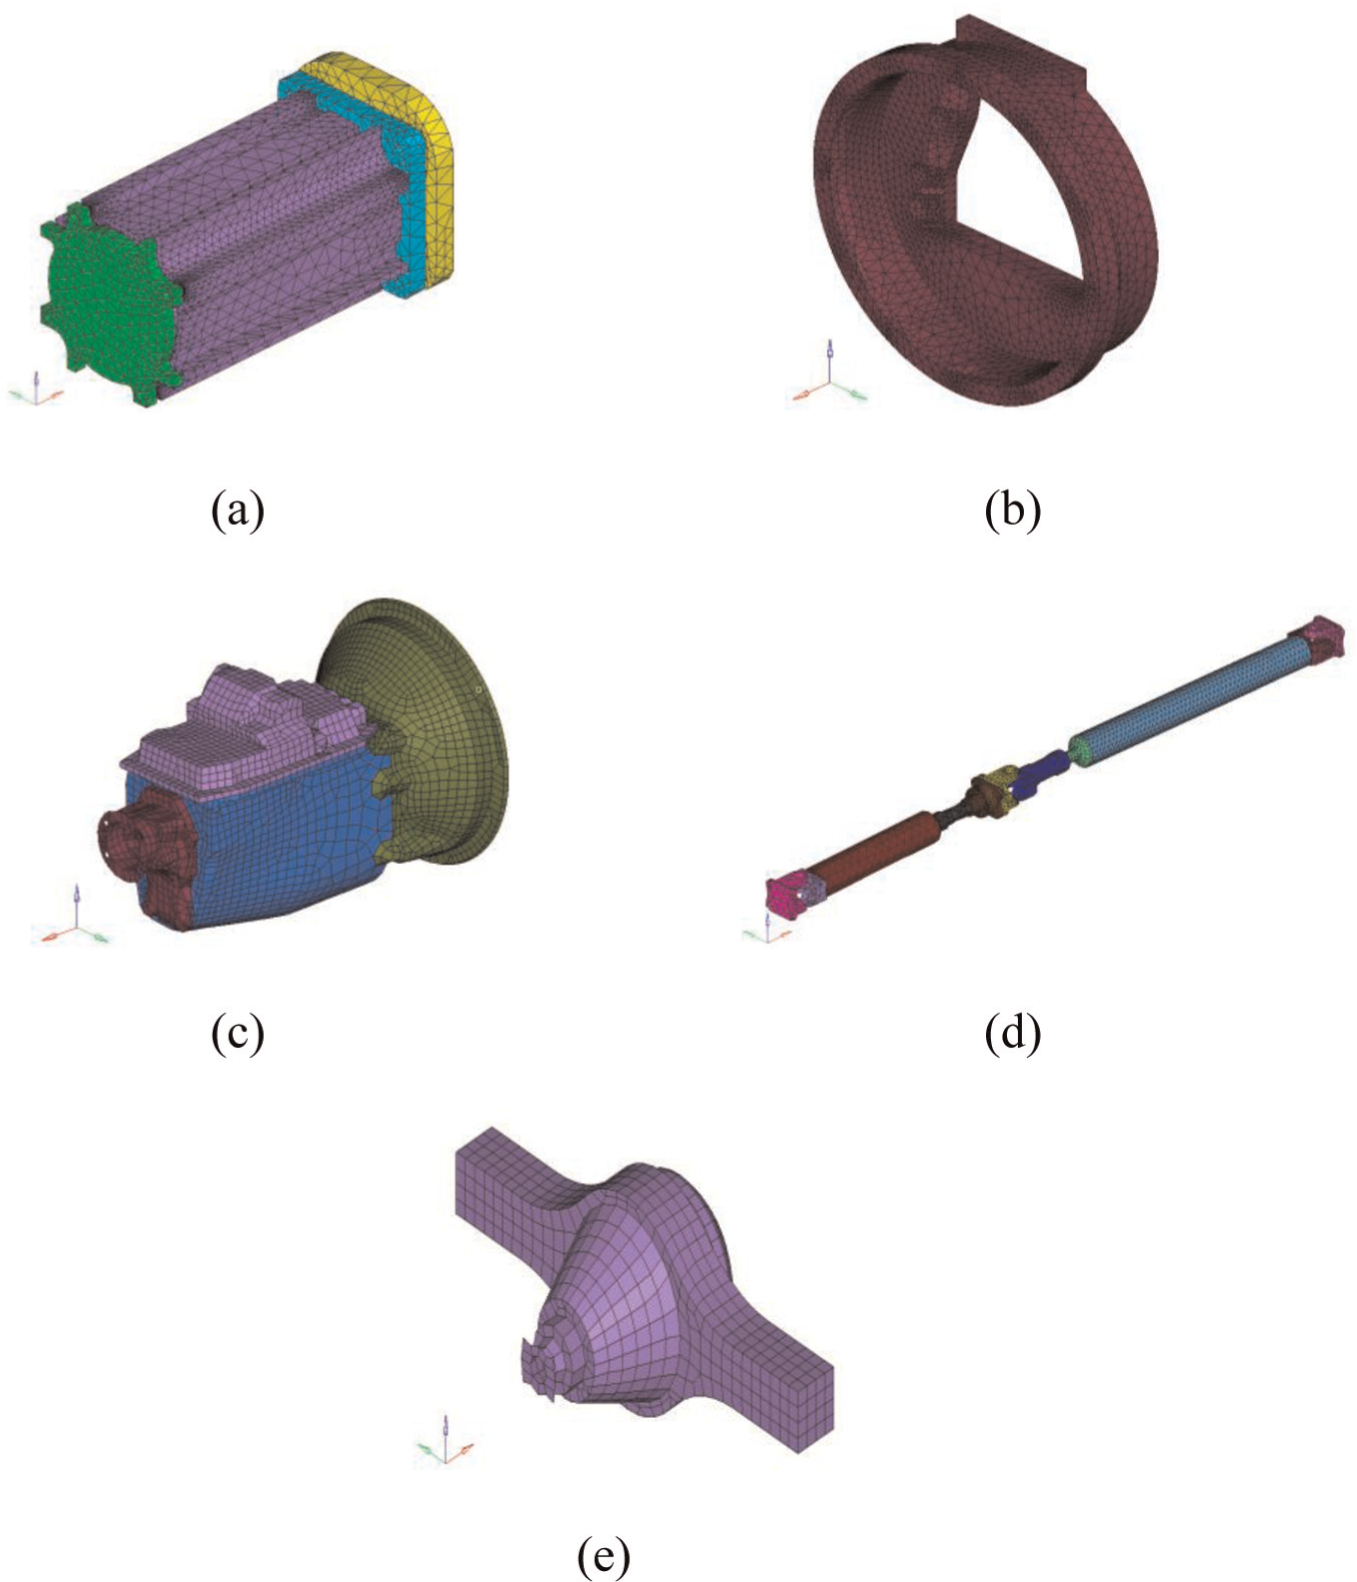
The FEM models of driveline components: (a) electric FEM model, (b) adapter FEM model, (c) six-speed transmission FEM model, (d) drive shaft FEM model, and (e) differential FEM model.
Vehicle structure modeling
The vehicle body has a chassis, vehicle body structure, and surface skin. The car seat, tire, and battery pack are contained by the vehicle chassis. Figure 9 shows three views of the FEM model of the vehicle body.
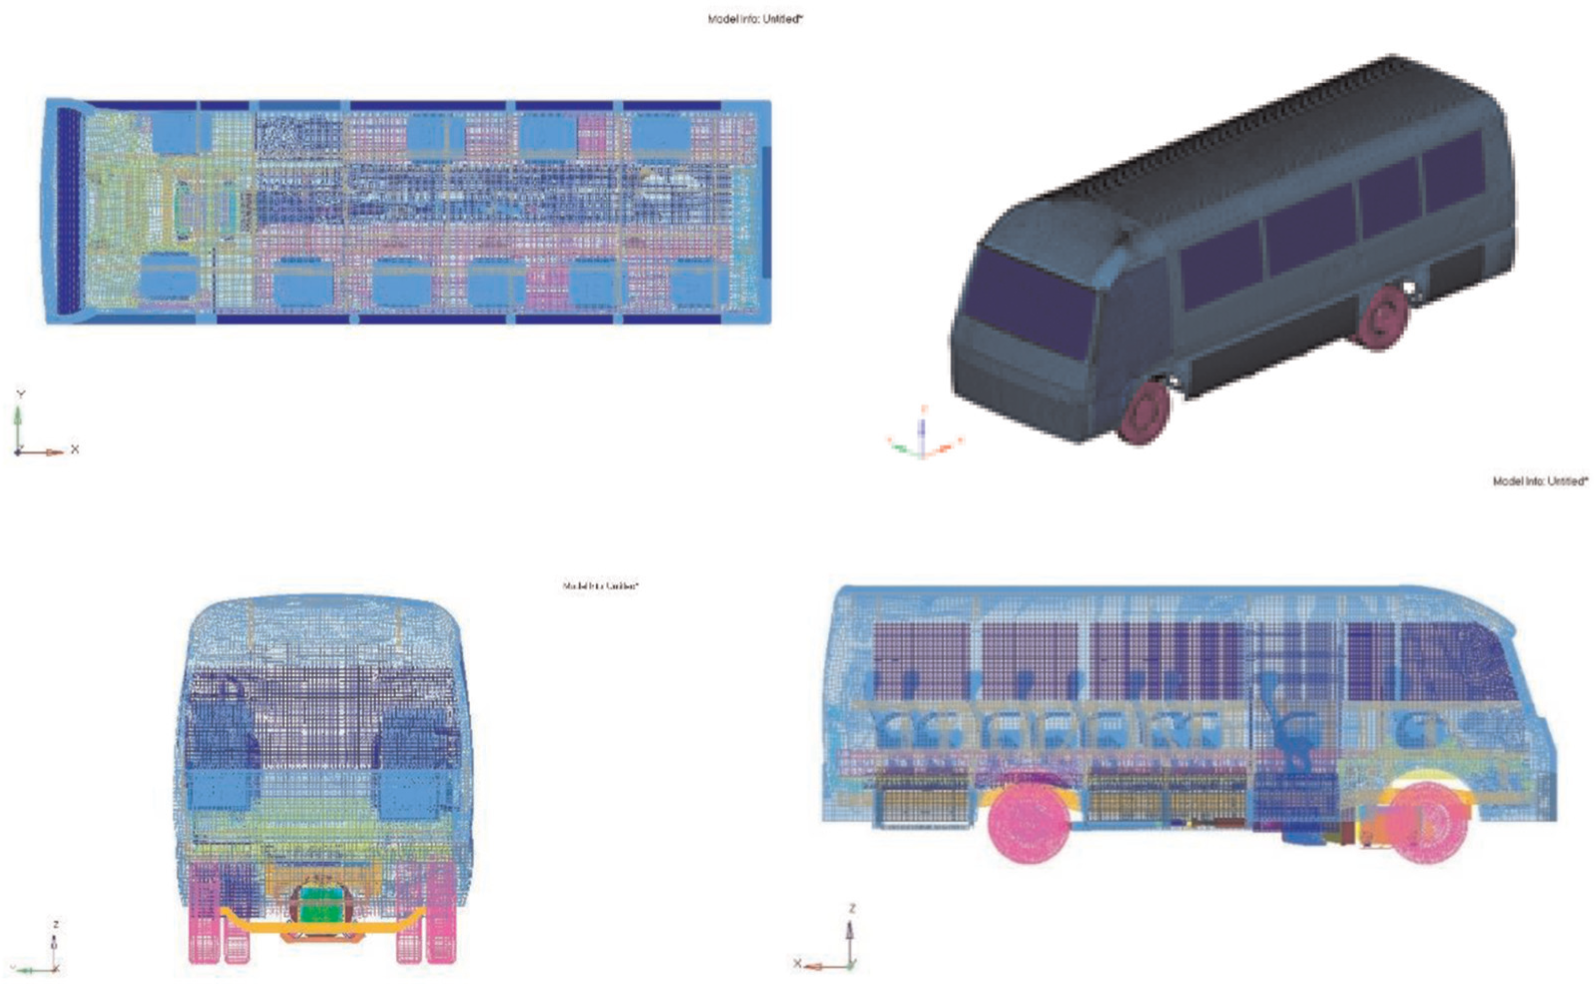
Vehicle body FEM model.
The electric bus has a motor in its front and a rear-wheel drive system. The driveline is attached to the chassis through mounts and suspensions. Figure 10 shows the assembled FEM vehicle model with its driveline system.

The assembled FEM model of the vehicle and driveline system.
Driveline load condition
This work addresses the seat-track vibration caused by the electric driveline system. Driving torque from the AMESim driveline dynamic model is extracted and applied to the assembled vehicle FEM model (Figure 11). This vibration torque, which is a function of time, passes through the driveline mounts and vehicle body to the driver’s seat.

The FEM driveline system load condition.
Vehicle finite element model correlation
To ensure the accuracy of the vehicle FEM model, model data were first compared with the measurement data. The frequency response of the electric bus was measured, and this response was compared with that of the vehicle structure simulated by FEM. During the experiment, the electric bus was supported by two 3-ton jacks under the front chassis and two under the rear chassis to ensure that tires are elevated (Figure 12).

Electric bus supports for measurements: (a) rear supports and (b) front supports.
For system frequency response, this experiment used a rubber mallet to produce an impact force at one corner of the structural beam of the chassis, and an accelerometer was attached to each of the other three corners to measure the acceleration response signal. Excitation was produced at the four corners of vehicle frame. These measured time response signals were processed with a fast Fourier transform into frequency response signals. Figure 13 shows the experimental architecture.

Experimental architecture for frequency response.
For comparison, the frequency response function (FRF) was applied on to the FEM model of the vehicle’s structure. Four simulations were analyzed. For each simulation, an excitation was applied to one corner of the frame, and three acceleration responses at the other three corners were recorded. Table 3 shows these chosen excitation points and responding points.
Excitation points and responding points for FEM FRF analysis.

In the experiments, excitation produced by the rubber mallet was not a unit of excitation force, such that the force in the simulations and the experiments was not the same. The simulation data and experimental data were validated with natural frequencies and the amplitude curve’s overall spectrum trend. Figures 14 and 15 show the measurement data and the simulation results for frequency response due to front left excitation and rear right response, respectively. Table 4 compares frequency responses. The errors of frequencies 1, 3, and 5 exceed 5%, and the errors of remaining frequencies are less than 5%; maximum difference is roughly 9%.
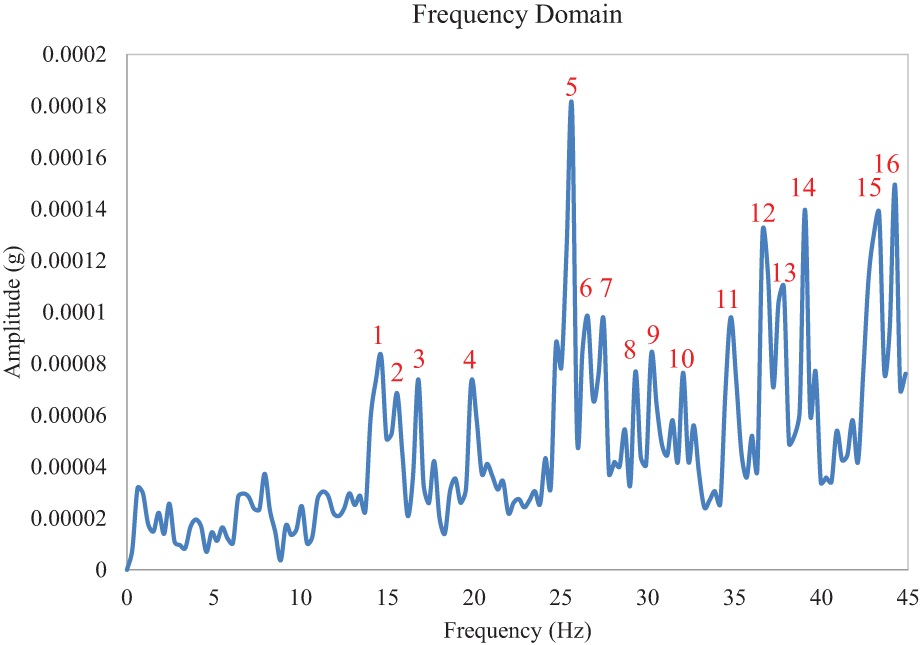
Measurement data for frequency response (front left excitation and rear right response).

Frequency response by FEM analysis (front left excitation and rear right response).
Comparison of frequency response in measurement data and FEM analysis (front left excitation and rear right response).

Figures 16 and 17 are the frequency responses obtained from the hardware measurement and simulation, respectively. They are the cases with excitation at the right front point and measurement at the left rear location. Table 5 summarizes the results. Only the first two frequencies have discrepancy between 6% and 9%. The remaining frequencies have differences less than 5%. A good correlation between the simulation and experiments is demonstrated.
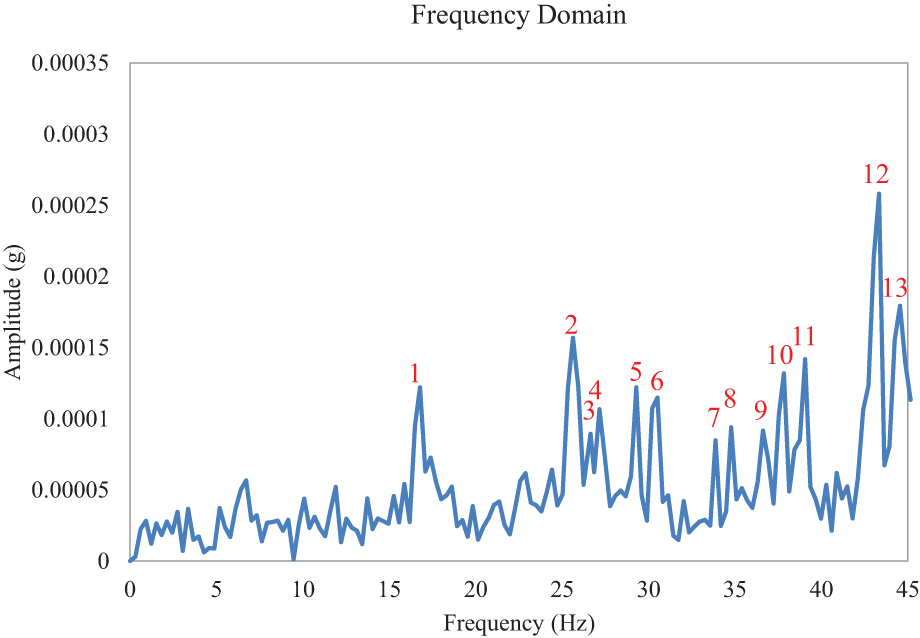
Measured frequency response (front right excitation and rear left response).
Frequency response by FEM analysis (front right excitation and rear left response).
Comparison of measured frequency response and that by FEM analysis (right front excitation and left rear response).

A comparison of all 12 data, four excitations, and three measurements for each excitation indicates that the error range for frequencies is within an acceptable range, and the overall amplitude trend is similar for FEM analysis and the measurement data. Comparison results show that the FEM model closely resembles real vehicle models.
The experimental results and FEM analysis have inaccuracies. Noise and other variables related to the surrounding environment can also cause differences. The FEM model is based on the design of construction and may differ slightly from the actual structure and cause differences in frequency response.
Simulation results for vibration reduction
This section discusses the simulations results. The AMESim dynamic driveline model was first simulated with and without the vibration-reduction algorithm, and driving torque from the driveline dynamic model was applied as a load condition of the vehicle’s structure for FEM analysis. These vibrations from excitation of the electric driveline pass through the driveline system’s mounts, causing the vehicle’s structure to vibrate. Then, seat-track acceleration is used to assess the effect of the vibration-reduction algorithm. Figure 18 shows the flowchart of this analytical process.

Flowchart of analysis of vibration reduction.
Driveline dynamic simulation
This driveline simulation has two driving conditions: fixed-gear acceleration and gear shifting.
Fixed-gear acceleration
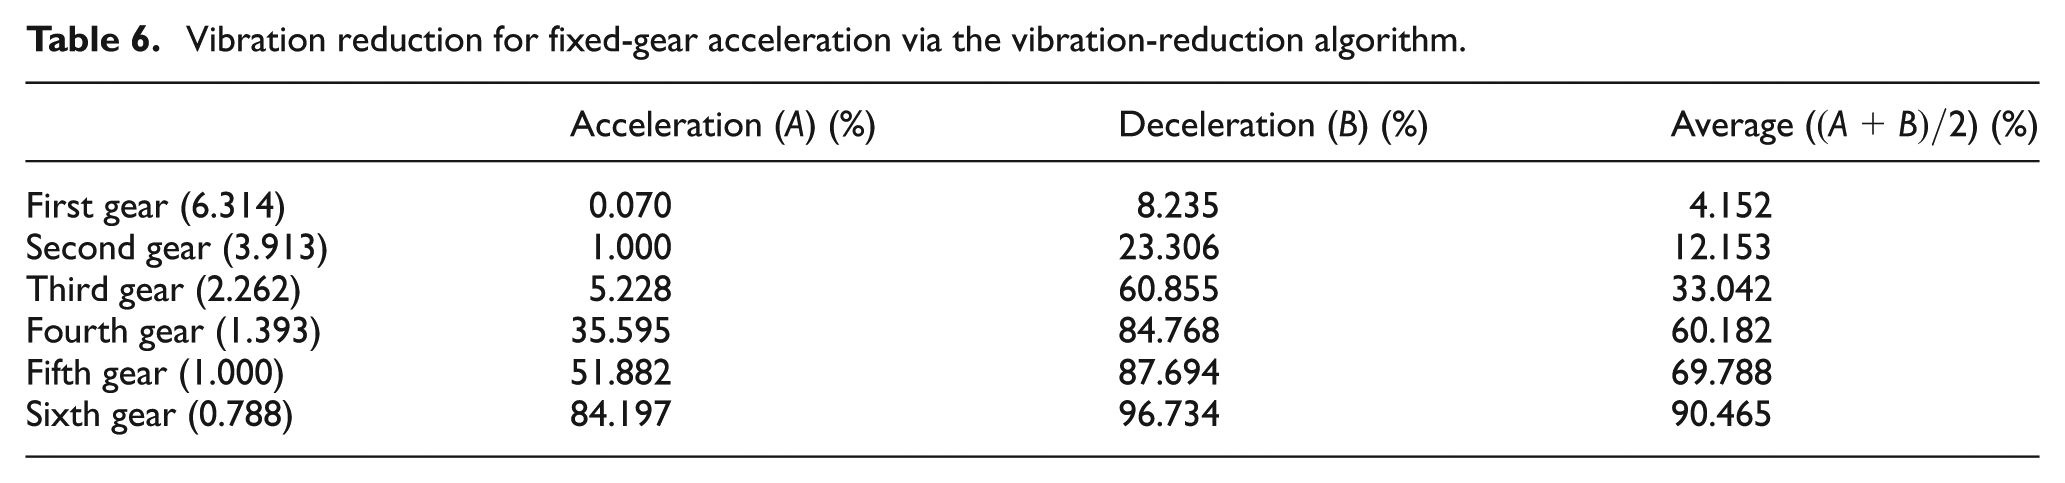
For fixed-gear acceleration, the gearbox has six gears, and acceleration and deceleration are simulated for each gear. To assess the impact of the vibration-reduction method, the peak-to-peak value of vehicle acceleration is recorded. During simulated acceleration, the accelerator pedal is depressed and released at 2000 r/min motor speed. Figure 19 shows the electric motor torque with and without vibration control with the sixth gear. The maximum motor torque when adjusted by the vibration-reduction method is 4 N m. Figure 20 shows vehicle acceleration with and without vibration control with the sixth gear. The peak-to-peak vehicle acceleration without vibration control is 0.033 m/s2, and this is reduced to 0.005 m/s2 with vibration control. The maximum amplitude reduction for acceleration is 84.197%. Table 6 summarizes the suppression of vehicle acceleration amplitude for six fixed gears in the simulation. The proposed vibration-reduction algorithm works best when the transmission is in sixth gear.

Electric motor torque with and without the vibration-control algorithm.

Vehicle acceleration with and without the vibration-control algorithm.
Vibration reduction for fixed-gear acceleration via the vibration-reduction algorithm.
Gear-shifting simulation
The gearbox of the electric driveline has six gears, so five shifts were simulated. Figure 18 shows motor torque when shifting from fifth gear to sixth gear with and without the vibration-reduction algorithm, and Figure 19 shows vehicle acceleration during shifting. During gear shifting, the acceleration pedal is released, and the clutch is disengaged. The gear is shifted from fifth to sixth. After gear shifting, the clutch re-engages and the accelerator pedal is pressed. The maximum torque adjusted by the vibration-reduction method is 50 N m when the clutch is engaged (Figure 21). The peak-to-peak vehicle acceleration without vibration control is 1.102 m/s2 when the clutch is engaged and that with vibration control is 0.607 m/s2. The maximum amplitude of vehicle acceleration is improved by 44.969% with the vibration-reduction method when shifting from fifth gear to sixth gear (Figure 22). Table 7 shows the improvement in vehicle acceleration fluctuation via the vibration-reduction method while shifting to different gears. The best improvement occurred while shifting from fifth gear to sixth gear.
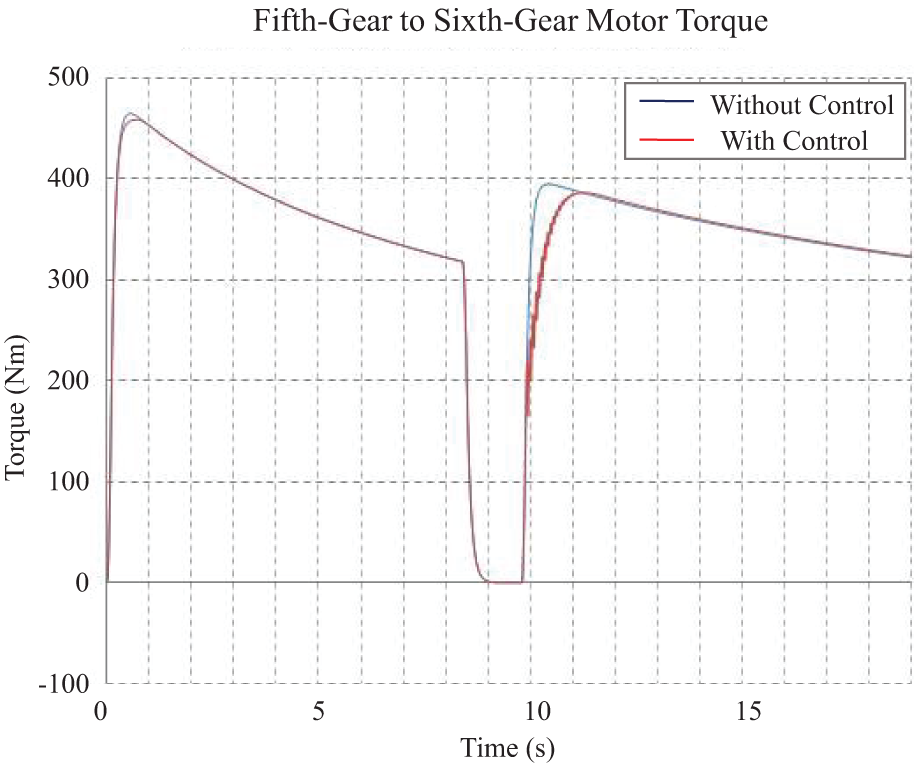
The electric motor torque with and without the vibration-reduction algorithm when shifting from fifth gear to sixth gear.

Vehicle acceleration with and without the vibration-control algorithm when shifting from fifth gear to sixth gear.
Reduction in vehicle acceleration amplitude via the vibration-control algorithm during gear shifting.

Vehicle structure analysis
To explore the vertical acceleration response of driver’s seat track, the FEM model of the vehicle uses the driving torque from the simulation of the AMESim driveline as the excitation source for vibration analysis. The driving torques of fixed-gear acceleration at sixth speed and shifting from fifth gear to sixth gear were subjected to FEM structure analysis to investigate vibration of the driver’s seat with and without the vibration-reduction control. Figure 23 shows the FEM analysis procedure.

Flowchart of FEM analysis of vibration of the driver’s seat track.
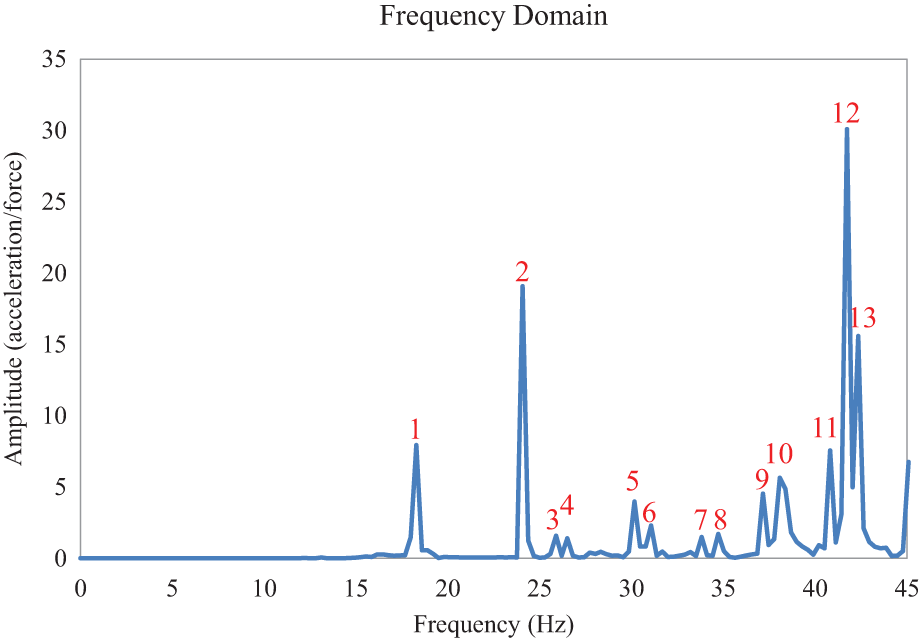
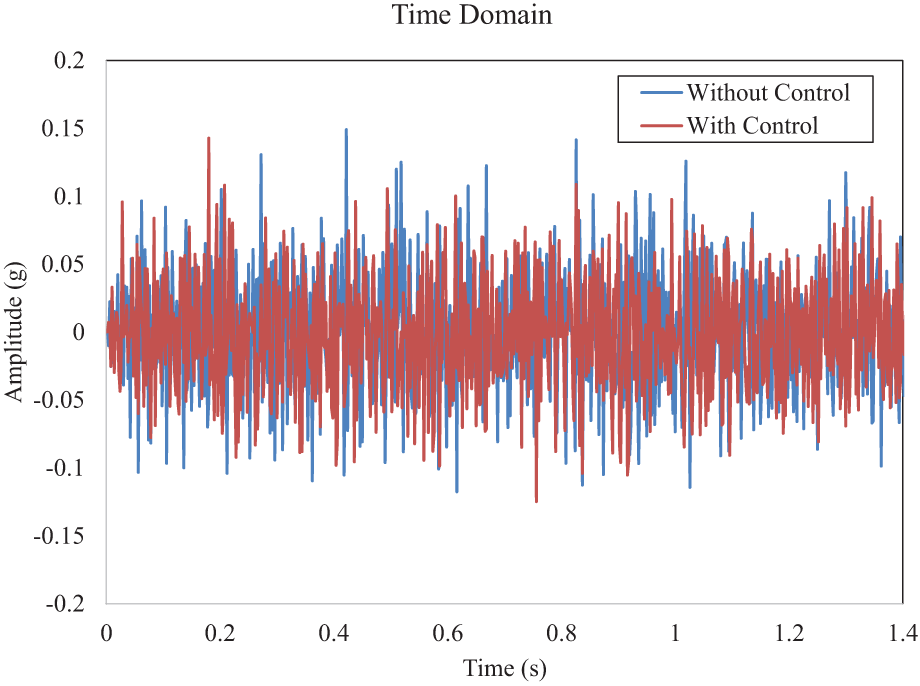
Figure 24 shows vertical acceleration of the driver’s seat track in the time domain during acceleration in sixth gear. Two curves represent the simulation results with and without vibration control. The maximum peak-to-peak value of seat-track acceleration is 1.97 m/s2 without vibration control, and that with vibration control is 1.07 m/s2, an improvement of 45.69% with the vibration-control algorithm. Figure 25 shows the vertical acceleration of the driver’s seat track in the frequency domain during acceleration in sixth gear. Two curves represent the simulation results with and without vibration control. Figure 25 shows that amplitudes of 16.15, 24.07, 26.50, 30.16, 40.82, and 65.42 Hz can be effectively suppressed by the proposed vibration-reduction method.
Vertical acceleration of the driver’s seat track in the time domain during acceleration in the sixth gear.

Vertical acceleration of the driver’s seat track in the frequency domain during acceleration in the sixth gear.
In the fixed-gear (sixth gear) simulation, when the accelerator pedal is released, motor torque quickly drops and causes fluctuation in driving torque. This driving torque is applied as the excitation source for FEM analysis. Figure 26 shows the vertical acceleration of the driver’s seat track in the time domain when the accelerator pedal is released. Two curves represent the simulation results with and without vibration control. The maximum peak-to-peak value of seat-track acceleration is 1.86 m/s2 without vibration control, and that with vibration control is 0.83 m/s2, an improvement of 55.38% with the vibration-control algorithm. Figure 27 shows the vertical acceleration of the driver’s seat track in the frequency domain when the accelerator pedal is released. Two curves represent the simulation results with and without vibration control. Figure 27 shows that amplitudes of 16.15, 30.16, 37.17, 40.82, 45.08, and 58.18 Hz can be effectively suppressed by the proposed vibration-reduction method.

Vertical acceleration of the driver’s seat track in the time domain during accelerator pedal released in the sixth gear.

Vertical acceleration of the driver’s seat track in the frequency domain during accelerator pedal released in the sixth gear.
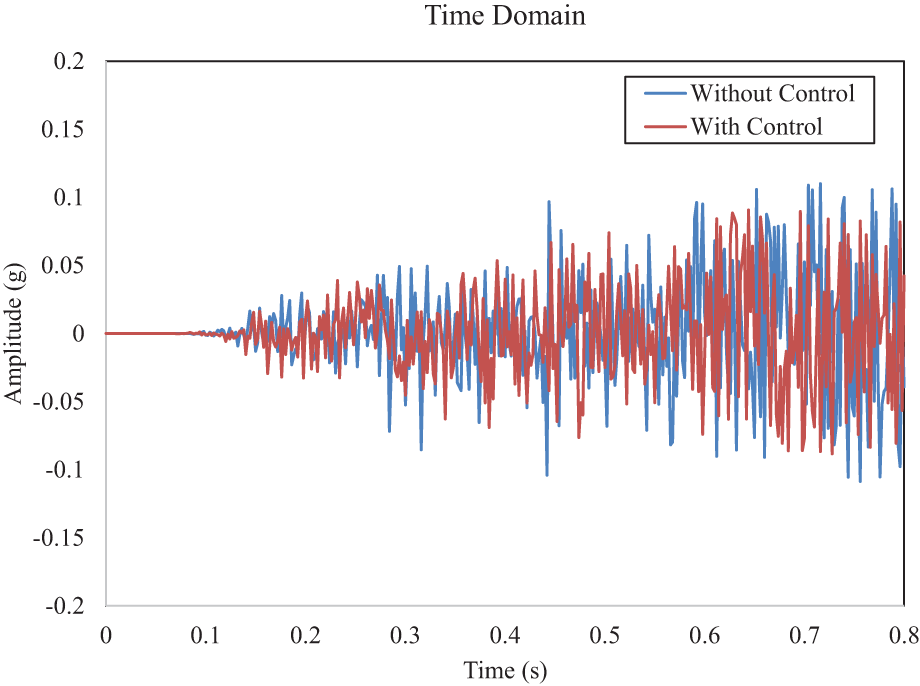
Figure 28 shows vertical acceleration of the driver’s seat track in the time domain when shifting from the fifth gear to the sixth gear. Two curves represent the simulation results with and without vibration control. The maximum peak-to-peak value of seat-track acceleration is 2.24 m/s2 without vibration control, and that with vibration control is 1.70 m/s2, an improvement of 24.11% with the vibration-control algorithm. Figure 29 shows the vertical acceleration of the driver’s seat track in the frequency domain when shifting from fifth gear to sixth gear. Two curves represent the simulation results with and without vibration control. Figure 29 shows that amplitudes of 30.16, 40.82, 58.18, 62.44, and 72.19 Hz can be effectively suppressed by the proposed vibration-reduction method.
Vertical acceleration of the driver’s seat track in the time domain when shifting from fifth gear to sixth gear.

Vertical acceleration of the driver’s seat track in the frequency domain when shifting from fifth gear to sixth gear.
The analytical results demonstrate that the proposed vibration-reduction algorithm effectively improves fluctuation of driveline torque and can further improve the acceleration of the driver’s seat and increase driving comfort during acceleration and gear shifting.
Conclusion
This work analyzed vibration of the driver’s seat under two conditions: fixed-gear acceleration and deceleration and gear shifting. The vibration-reduction method was applied to the driveline of an electric bus to improve riding comfort. The AMESim driveline dynamic simulation provides driving torques, and the torques were applied as load conditions for FEM structural analyses of the vehicle. These conclusions are based on the analytical results.
The motor feedback control method can effectively inhibit driveline vibration during vehicle acceleration/deceleration and gear shifting. Maximum inhibition of driveline torque fluctuation is 84.19% during vehicle acceleration and 44.96% during gear shifting. The reduction in driveline torque fluctuation is greatest in sixth gear. The proposed method can be applied to vehicles with electric motors as their power source, including hybrid electric vehicles. Using the electric motor as the sensor and actuator, vehicle body acceleration is predicted by motor speed. Thus, no additional hardware cost is needed to implement this control strategy.
The FEM simulation data for the vehicle body were compared with the measurement data. From the 12 experiments, errors are within an acceptable range. The experimental results show that the simulation model resembles closely a real electric bus.
For vibration transmitted through vehicle’s body, the driver’s seat-track acceleration was used to assess riding comfort. With the vibration-control method, the peak-to-peak seat-track acceleration was reduced by 45.69% when accelerating in sixth gear and by 55.38% when decelerating in sixth gear. When shifting from fifth gear to sixth gear, the amplitude of seat-track acceleration was suppressed by 24.11%. We conclude that the proposed vibration-control method effectively reduces structural vibrations, thereby enhancing driver comfort.
Footnotes
Academic Editor: Weidong Zhu
Declaration of conflicting interests
The author declares that there is no conflict of interest.
Funding
This research received no specific grant from any funding agency in the public, commercial, or not-for-profit sectors.