
Abstract
There have been many reports recently on unanticipated galloping and collapse accidents of tower-line systems due to downburst wind with rainfall. Although wet downburst is characterized by high-velocity wind with rainfall, very little research work is involved with galloping of high-voltage transmission line induced by the downburst wind with rainfall. Thus, this article proposes a preliminary theoretical study aiming to provide an analytical model of the high-voltage transmission line subjected to the downburst wind with rainfall to explain some phenomena observed from field measurements. Through wind or rain–wind tunnel experiments, we obtained aerodynamic characteristics of the high-voltage conductor with different yaw angles and rainfall rates. Considering the variations of several factors such as wind velocity, rainfall rate, yaw angle, and attack angle, the proposed analytical model was created by finite element method and central differences with the obtained aerodynamic coefficients of the high-voltage conductor. The theoretical results accord well with the experimental data. The analytical model enables better comprehension of the galloping of the high-voltage transmission line subjected to the downburst wind with rainfall.
Introduction
The planned high-voltage transmission tower-lines are present in the southwest region of China where thunderstorms occur frequently. The current trend is to design and construct much taller towers with longer spans than ever, which makes ensuring secure and stable operation of the high-voltage transmission tower-lines a challenge for electric power engineering.1,2 Failure records of high-voltage transmission tower-lines in America, Australia, South Africa, and several other regions show that more than 80% of weather-related failures are caused by the downbursts with the occurrence of rainfall. 3 Although there are a large number of the downbursts which typically consists of precipitation (called wet downburst), very little attention was paid to the effect of the downburst wind coupled with rainfall on galloping of high-voltage transmission line. Moreover, the conventional layer vertical profile of wind velocity is no longer valid for the downbursts, and normal design methods of the transmission tower-lines evidently are not adequate for this off-design condition.
In recent years, many researchers have studied the different aspects of this subject. Oliver et al. 4 described a probabilistic model for design transmission line systems against the downburst type winds and developed a practical model to estimate the risk of a strike of damaging downburst on a high-voltage transmission line with specified length and orientation in Australia. Savory et al. 5 carried out a preliminary study on the structural response of a typical lattice transmission tower subjected to a microburst. The results showed that the microburst did not cause failures due to its lower intensity and longer durations. Lin et al. 6 introduced an aeroelastic model of a single span of support lattice tower-lines with scale ratio of 1:100, which meets the need of the similarity theory for wind tunnel tests. Direct comparison of tower and line response to synoptic wind profile versus downdraft outflow wind profile indicated that transmission line failures from downdraft winds were most likely caused by peak tower loads that could exceed that of boundary layer winds by an order of magnitude, and peak upstream conductor loads that could reach several times more than the peak downstream conductor loads. Shehata et al.7,8 employed the finite element method to identify the critical microburst parameters that lead to maximum forces in various members of a transmission tower structure. The result showed that the peak values obviously exceed the transmission tower structure just encountered with normal wind loads, and the peak values were sensitive to the downburst location with respect to the tower. Zhang et al. 9 established finite element models for single tower and transmission tower-line system to simulate wind-induced progressive collapse. The simulation results demonstrated that the transmission tower-line system collapse mechanism depends on the number, position, and last deformation of damage elements, and the effects of the conductor and the ground could not be ignored. Mara and Hong 10 investigated the inelastic response of a self-supported lattice transmission tower under boundary layer wind and downburst wind and wind loading at different directions relative to the tower. And nonlinear static pushover analysis was used to obtain the capacity curve of the tower, defined by the force–deformation relationship at each considered wind direction. The result showed that the yield and maximum capacities vary with wind direction and would be useful for the evaluation of the adequacy of existing towers under downburst events. Kikuchi and colleagues11,12 singled out a blow-down-type wind tunnel to study the influence of heavy rainfall conditions on the aerodynamic drag coefficient of overhead power line. The drag coefficients were measured with different values of wind velocity, incident angle, surface roughness, and turbulence intensity. The experimental results obtained in the wind tunnels indicated that the newly electric power line, LP1810, was very effective to reduce the drag force in a practical use. Yang et al. 13 established a time-dependent failure probability model to evaluate short-term reliability of overhead lines under the impact of strong wind and rain loads, and took IEEE-79 system as an example to simulate the reliability of the overhead lines. The results showed that the impact of the strong wind and rain loads would seriously affect reliability indices of the transmission system, and rain loads have obvious effect on the reliability of transmission line. Choi 14 studied wind-driven rain and driving-rain coefficient during thunderstorm and nonthunderstorm events at a wind-driven rain-measuring station in Singapore. The observation of the driving-rain intensity coefficient indicated that the ideal coefficient calculated based on drop size distribution was not appropriate for low altitudes close to the ground. Li and Bai15,16 proposed a calculation approach of rain load with combination principle of overhead transmission lines and established a rain-wind-induced dynamic model of transmission tower system with finite element method. By means of numerical simulation, they found that the rainfall influences on the response of overhead transmission line were evident, which possesses the excitation feature of simultaneous action with wind turbulence. Zhou et al.17,18 established an analytical model of rain-wind-induced vibration of the high-voltage transmission line and investigated the effect of wind velocity, rivulet motion, raindrop velocity, and time-varying mass on the vibration amplitude. The results showed that the largest amplitude of the high-voltage conductor only occurred within a certain range of wind velocity and presented a velocity-restricted vibration response.
In the above literatures, studies about the dynamic characteristics of transmission tower-lines mainly focused on the dynamic characteristics of the tower subjected to dry downburst, but the dynamic characteristics of the transmission lines subjected to wet downburst (downburst wind with rainfall) were rarely investigated. For this reason, this article aims to validate an analytical model of the high-voltage transmission line subjected to the downburst wind with rainfall to clarify the galloping mechanism. By wind or rain–wind tunnel experiments, we obtained aerodynamic coefficients of the high-voltage conductor at different yaw angles and rainfall rates. Considering the variations of several factors, such as wind velocity, rainfall rate, yaw angle, and attack angle, the proposed analytical model is created by means of finite element method and central differences with the obtained aerodynamic characteristics of the high-voltage conductor.
General features of the downburst wind and rainfall during a thunderstorm
Wind velocity of the downburst
A downburst is a severe localized downdraft from a thunderstorm, such that its
structure, scale, intensity of wind, and rainfall cannot be measured in field
with conventional recording stations.19,20 For purposes of analysis,
the wind velocity occurring at any time

where
We assume that the mean wind velocity of any time at any height can be factorized as the product of a vertical profile and a time function as follows

where
As shown in Figure 1, the
downburst is assumed to move forward along its straight track with translational
velocity


Horizontal diagram of the downburst with transmission tower-line.
The fluctuating wind velocity

where
Raindrop spectra and rain loads
Wet downbursts are created by thunderstorms with moderate or heavy precipitation. 23 The raindrops have impact on the transmission tower-lines with great energy, which aggravates the vibration of the conductor. The energy of a raindrop effect on the conductor is related to its diameter, velocity, and rainfall intensity. 24 A large number of observations show that the raindrop size obeys a negative exponential distribution. The Marshall–Palmer exponential size distribution (referred to as M-P spectrum) is widely used 25 as follows

where
Intensity of rainfall (mm/h).

S: slight; M: moderate; L: large; H: heavy; Hu: huge rain.
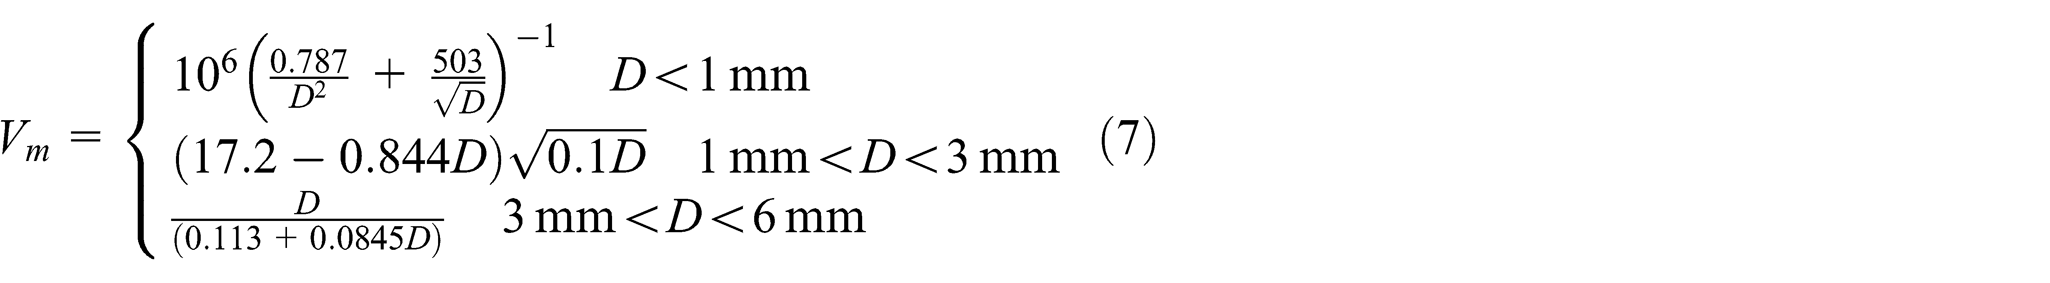
As the range of raindrop diameter in natural rainfall is 0.1–6 mm, 26 to simplify the analysis, we take six types of intermittent raindrop diameter to simulate continuous distribution of raindrop diameter of rainfall. Diameters of each type of raindrop and its represented range of diameter are shown in Table 2.
Represented range of diameter with each type of raindrop (mm).

D: diameter; R: represented range.
Correspondingly, the volume occupancy ratio of the different sizes of raindrops in wind field can be expressed as

And the terminal velocity of the raindrop,
Once a raindrop hits the conductor, the velocity of the raindrop becomes zero
within an extremely short time

where

where the action area of a raindrop is
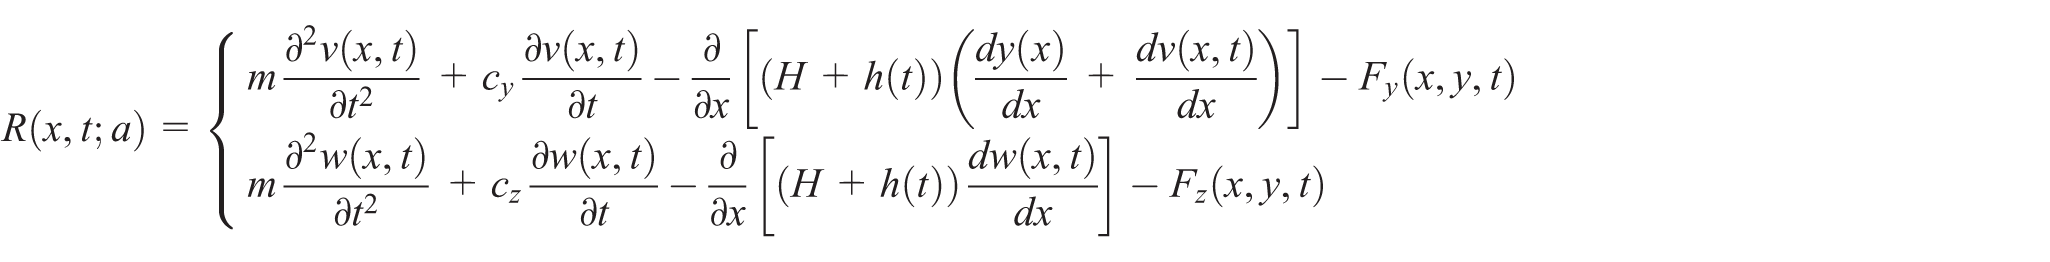
Analytical model of high-voltage conductor with finite element discretization
Analytical model of high-voltage conductor subjected to downburst wind with rainfall
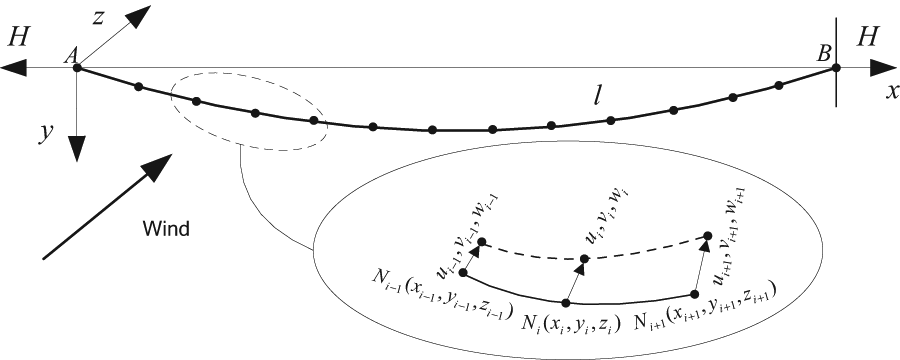
Let us use a rigid and uniform cable to represent a suspended high-voltage
conductor with small sag, and the two towers (A and B) at both ends of cable are
assumed to be fixed (see Figure
2). The coordinates of any points along the conductor are represented
by using Cartesian system, which defines that the motion in

Schematic representation of the conductor and its cross section subjected to the downburst with rainfall.
Considering the in-plane and out-of-plane motion velocities of the cable,

The attack angle between the relative velocity

Taking small displacements and large deformations as the basic assumption for the conductor, the analytical model of the conductor subjected to downburst wind with rainfall is built by partial differential equation as follows
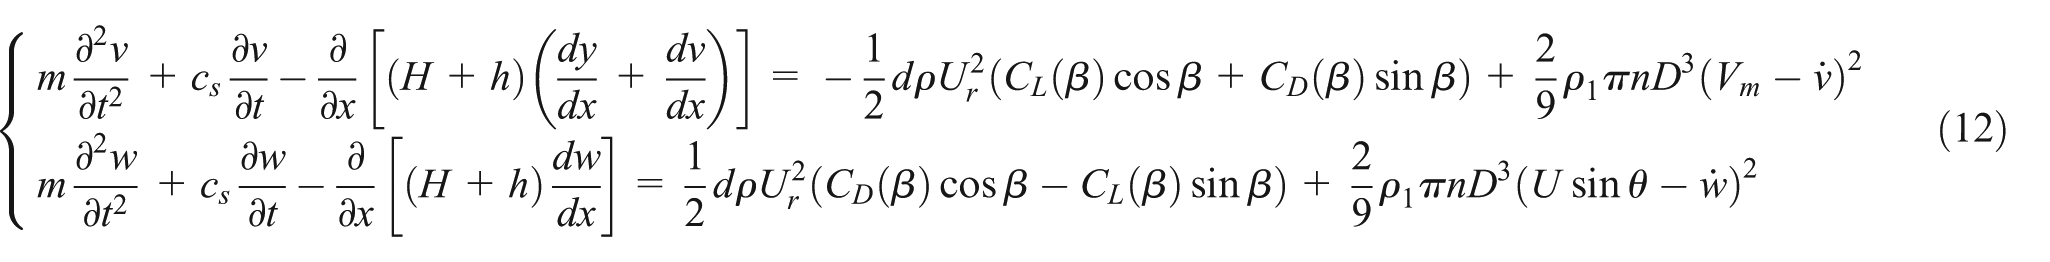
where
The forces in the right-hand side of equation (12) are the function
of the conductor velocity,

where
Finite element discretization
A conductor suspended between two towers is discretizated into a number of
three-node isoparametric elements. The cable element is referred to the
coordinates of

where
Discretizated model of the high-voltage conductor with finite element method.
Isoparametric representations of the coordinates of

The shape function,

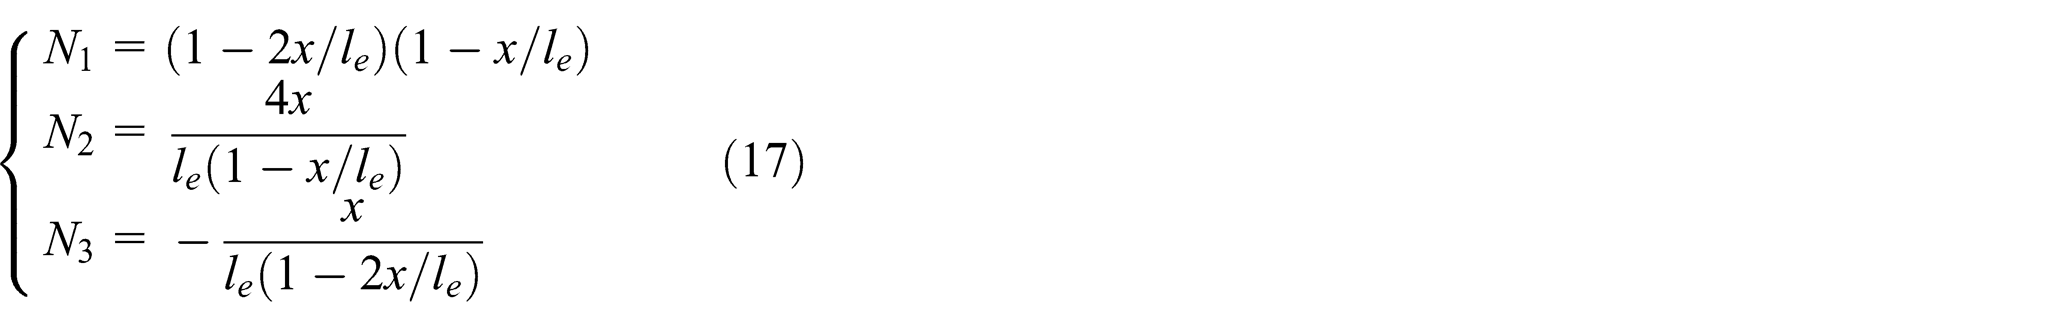
where
Thus, in-plane and out-of-plane movements of the high-voltage conductor of equation (13), subjected to a distributed wind–rain loading, can be represented by the following equations

Boundary condition:
Consequently, equation (18) is solved by Galerkin method leading to a decrease in the integration order. The typical element pondered residual equation can be written as follows

where
The integral part can be written as follows

Taking an approximate solution of the problem such that
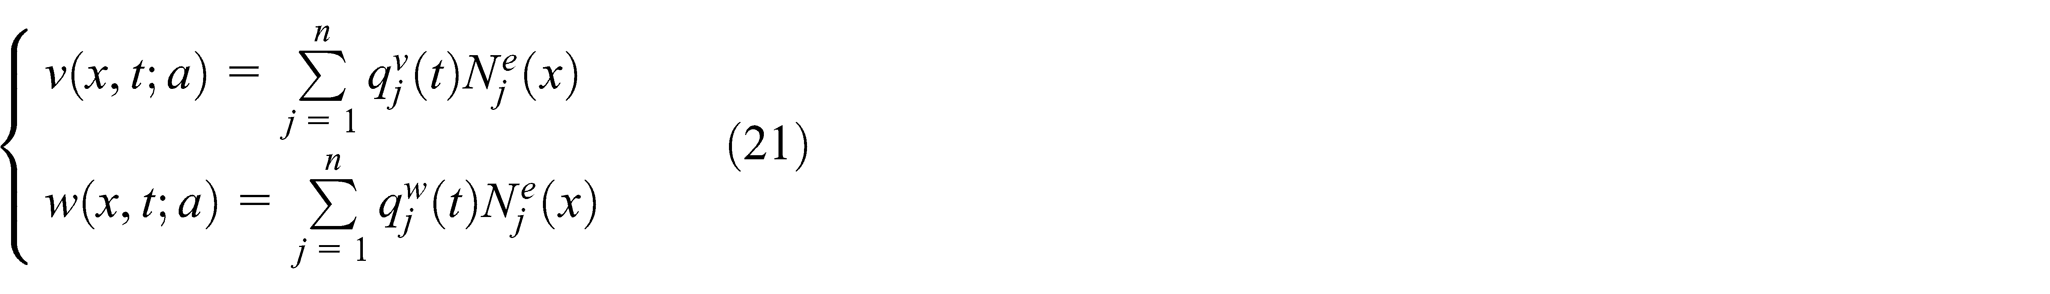
Substituting equation (21) into equation (20), the following can be written
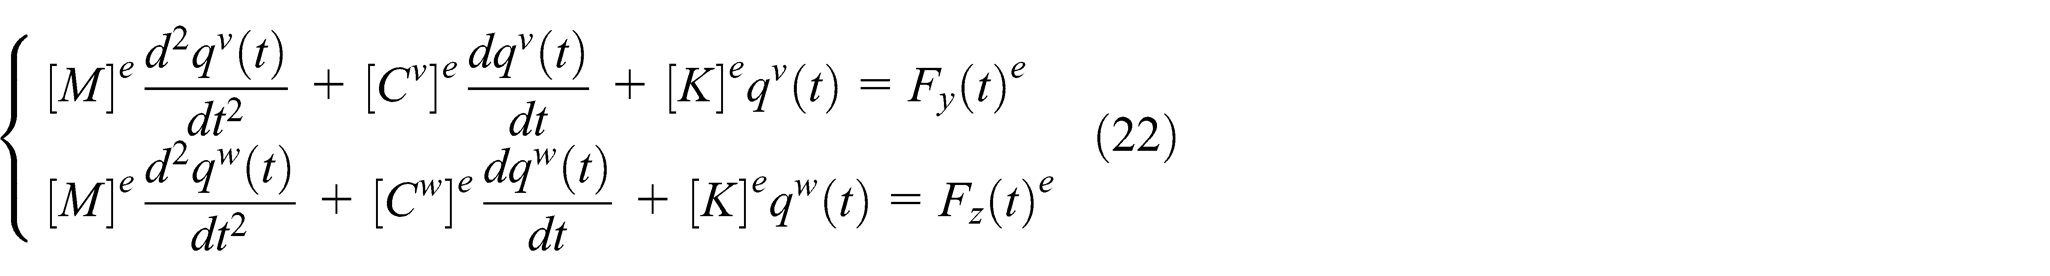
where


After assembling all elements

where

The two derivatives can be approximated by central differences


Substituting equations (25) and (26) into equation (24) yields

By solving equation (27), it is possible to find the displacements of each
node, and then each
Experimental test and numerical studies
In order to clarify the galloping mechanism of the high-voltage transmission line subjected to the downburst wind with rainfall, experimental tests should be carried out with two conditions, that is, one is the conductor encountered only with the downburst wind, and the other is the conductor encountered only with the downburst wind and rainfall. Correspondingly, the proposed analytical model is applied to simulate the motion of an actual conductor with the obtained aerodynamic coefficients from the experimental tests and is verified by the comparison with field measurements.
The high-voltage conductor encountered only with the downburst wind
To start with the simplest case, in this section, we investigate aerodynamic behaviors of the high-voltage conductor subjected to dry downburst wind. When rainfall is not considered, the raindrop load is set to zero, and the motion of the high-voltage conductor is no longer relative to the rainfall. The motion equation of the high-voltage conductor encountered only with the downburst becomes
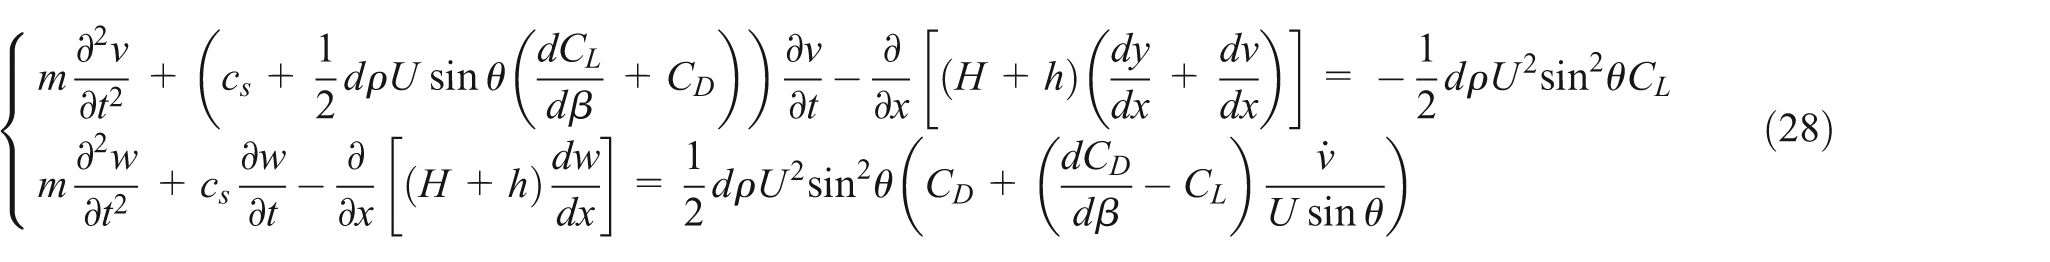
When rainfall is not considered, the total damping coefficients and the external
force may change with the yaw angle
As shown in Figure 4, for
the sake of relations between the yaw angle

Experimental setup of wind tunnel test: (a) photograph of wind tunnel test device with test model and (b) schematic representation of test model in wind tunnel test.
The test model is hanged up by two pairs of springs at both ends, and the springs
are rested on a vertical square-shaped frame. By sliding the square-shaped
frame, the yaw angle
The lift and drag coefficients of the test model versus attack angle

Aerodynamic coefficients versus attack angle
To investigate the capability of the analytical model for revealing the galloping
mechanism, the above finite element method is applied on a high-voltage
transmission line. As an example, the key parameters of the conductor are as
follows: diameter of 30 mm, mass per unit length of
1.65 kg/m, span of 255 m, elasticity coefficient of
73 kN/mm2, tension force of

where
Applying the functions of the drag coefficient and lift coefficient (equation
(29)) into equation (28) at different yaw
angles, we can obtain the response amplitude of the conductor. From Figure 6(a), it can be
found that the in-plane large response amplitude occurs once the wind velocity
reaches a certain level of about 26 m/s, but out of this range, the
conductor has very small vibration amplitude. This result is in good agreement
with field measurements of 500-kV flashover caused by windage yaw at the wind
velocity of 24–27 m/s.
30
This phenomenon can be
explained by the fact that at the critical velocity of 26 m/s, the
Reynolds number is close to the critical range, and the total damping
coefficient gets a negative value. The in-plane amplitude of vibration of the
conductor, at the critical velocity of 26 m/s, varies at different
yaw angles. This is because the values of lift coefficient are somewhat
different with the yaw angles of

(a) In-plane vibration amplitude versus wind velocity and (b) out-of-plane vibration amplitude versus wind velocity.
Figure 6(b) shows the out-of-plane vibration amplitude of the conductor versus wind velocity. The vibration amplitude of the conductor increases with the wind velocity, and the large response amplitude occurs once the wind velocity reaches a certain level of about 15 m/s. The large amplitude vibration remains constant with further increase in the wind velocity, while a sharp drop of the vibration amplitude occurs at the critical wind velocity of 26 m/s. This result is in good agreement with field measurements of accidents of 500-kV flashover caused by windage yaw at the wind velocity of 24–27 m/s. 30 Beyond the critical wind velocity, the amplitude vibration remains constant again with further increase in the wind velocity. This result can be explained by the fact that the values of the drag coefficient increase with the wind velocity (when U < 15 m/s), and almost remain constant within a certain range of wind velocity (15 < U < 26 m/s), and suddenly drop at the critical wind velocity of 26 m/s. They remain constant again as the wind velocity is beyond the critical values.
As shows in Figure 6(a)
and (b), the attack
angle
The high-voltage conductor encountered only with the downburst wind and rainfall
To investigate the capability of the analytical model for predicting the motion of the conductor subjected to the downburst wind with rainfall, a rainfall simulator is urgently needed to study the aerodynamic coefficients of the test model at varied wind velocity, with different rainfall intensities. As shown in Figure 7, the facility of rainfall similitude experiment is mounted on the above wind tunnel test and located windward in the test model. The upper water pipe is designed to consist of two vertical FullJet nozzles, and the nozzles are assembled by three different sizes of 1/8, 2/8, and 3/8.

Schematic representation of rain–wind tunnel test.
Figure 8 shows a photograph of simulated raindrops in wind tunnel, and the raindrops are released from the nozzles. By combination of four nozzles with different sizes, we achieve a rainfall intensity adjustable device from slight rain to heavy rain, which makes the rainfall simulator similar to natural rainfall. A session of an experiment begins with submersible pumps to pump water up from the sink to water pipes. Control valves installed at the lower water pipes are opened in a second and then simulated raindrops are driven by the pressure force and the gravitational force, flowing from the nozzles to wind test. The velocity of the simulated raindrops can be changed discretely by the control valves. As simulated raindrops fall into wind field and the test conductor model is placed in the middle of wind tunnel test, a rain–wind tunnel test is established.

Photograph of rain–wind experiment with nozzles.
The lift and drag coefficients of the test model versus wind angle of attack

Aerodynamic coefficients versus attack angle
For rainfall rates of 2.5, 8, and 16 mm/h, it can be found that as
attack angle
To study the capability of the analytical model for the high-voltage conductor
encountered only with the downburst wind and rainfall, the above derived finite
element method is applied. For comparison purpose, the key parameters of the
conductor are similar to the example shown in the above-mentioned section. Based
on the typical curves obtained from Figure 9, expand the drag and lift
coefficients in equation (13) as functions with
respect to

where
Applying the functions of the drag coefficient and lift coefficient (equation (30)) into equation (13) with different rainfall rates, we can obtain the response amplitude of the conductor. From Figure 10(a), it can be found that the in-plane largest amplitude occurs once the wind velocity reaches a certain level of about 10 m/s, but out of this range, the conductors obtain smaller vibration amplitude. This result is in good agreement with the experimental results. 17 The result can be explained by the fact that at the critical velocity of 10 m/s, the rivulets are formed on the surface of the conductors at the rainfall rates of 8 and 16 mm/h, whereas rainfall is not enough to form rivulet when rainfall rates are 0 and 2.5 mm/h. Furthermore, in-plane larger response amplitude occurs again once the wind velocity reaches a certain level of about 40 m/s, but out of this range, the conductor has very smaller vibration amplitude. This result is in good agreement with field measurements of accidents of tower collapses of 500-kV Renshang 5237 transmission line caused by downburst at wind velocity of 30–42 m/s. 31 The reason can be explained by the fact that at the critical velocity of 40 m/s, the Reynolds number is close to the critical range, and the total damping coefficient obtains a negative value. Furthermore, the in-plane amplitude of vibration of the conductor, at the critical velocity of 40 m/s, varies with different rainfall rates. This is because the values of lift coefficients are somewhat different with the rainfall rates of 2.5, 8, and 16 mm/h, and the critical rainfall rate possibly is in the vicinity of rainfall rate of 8 mm/h.

(a) In-plane vibration amplitude versus wind velocity and (b) out-of-plane vibration amplitude versus wind velocity.
Figure 10(b) shows the out-of-plane vibration amplitude of the conductor versus wind velocity. The vibration amplitude of the conductor increases with the wind velocity, and the large response amplitude of the rain-wind-induced vibration occurs once the wind velocity reaches a certain level of about 10 m/s, but out of this range, the conductor has lower vibration amplitude.
After the critical wind velocity of 10 m/s, the vibration amplitude of the conductor increases with the increase in the wind velocity of up to 15 m/s (rainfall rate of 0 mm/h) or 19 m/s (rainfall rates of 2.5, 8, and 16 mm/h). Beyond this threshold, the amplitude vibration nearly remains constant with further increase in the wind velocity, whereas a sharp drop of the vibration amplitude occurs at the critical wind velocity of 26 m/s (rainfall rate of 0 mm/h) or 40 m/s (rainfall rates of 2.5, 8, and 16 mm/h). This result can be explained by the fact that the values of the drag coefficient increase with the wind velocity (when U < 15 m/s, at the rainfall rate of 0 mm/h), and almost remain constant within a certain range of wind velocity (15 < U < 26 m/s), and suddenly drop at the critical wind velocity of 26 m/s. They remain constant again as the wind velocity is beyond the critical values. Meanwhile, the values of the drag coefficient increase with the wind velocity (when U < 19 m/s, for rainfall rates of 2.5, 8, and 16 mm/h), and almost remain constant within a certain range of wind velocity (19 < U < 40 m/s), and suddenly drop at the critical wind velocity of 40 m/s. They remain constant again as the wind velocity is beyond the critical values.
As shows in Figure 10(a)
and (b), the attack
angle
Conclusion
An analytical model for describing galloping of the high-voltage transmission line subjected to downburst wind with rainfall is proposed in this article. The analytical model is applied to simulate the motion of an actual conductor with the obtained aerodynamic coefficients from the experimental tests and is verified by the comparison with field measurements.
The analytical model is validated by comparing numerical results with the experimental data, which can capture main characteristics of galloping vibration of the high-voltage conductor encountered with the downburst wind with rainfall.
When high-voltage conductor encountered only with the downburst wind,
in-plane or out-of-plane large response amplitude occurs once the wind
velocity reaches a certain level of about 26 m/s, but out of
this range, the conductor has very small vibration amplitude. Furthermore,
the critical yaw angle possibly occurs in the vicinity of yaw angle of
While high-voltage conductor encountered only with the downburst wind with rainfall, in-plane or out-of-plane largest amplitude occurs once the wind velocity reaches a certain level of about 10 m/s, but out of this range, the conductor obtains smaller vibration amplitude. Furthermore, in-plane or out-of-plane larger response amplitude occurs again once the wind velocity reaches a certain level of about 40 m/s, but out of this range, the conductor has very smaller vibration amplitude.
It should be noted that the proposed analytical model is still a preliminary model. The fluctuating wind, towers, and span effects are neglected in this article. Some assumptions in the model need to be released in the further study. More realistic wind–rain tunnels or field measurements guided by the proposed analytical model need to be developed.
Footnotes
Academic Editor: Jia-Jang Wu
Declaration of conflicting interests
The authors declare that there is no conflict of interests regarding the publication of this article.
Funding
The research presented in this article was supported by the Natural Science Foundation of Youth Fund of China (no. 51205128), the Beijing Natural Science Foundation (no. 8152027), and the Fundamental Research Funds for the Central Universities (no. 2014ZD07).