
Abstract
As transit service performance should be considered from the transit passengers’ perspectives, it is essential to determine passengers’ perceptions of service performance and to understand the role of these perceptions in travel decisions. As the bus market share has steadily declined, the aim of this study is to explore the impact of perceptions of bus service performance on mode choice preference to increase bus ridership. To achieve this research objective, an intention survey is conducted to obtain bus passengers’ attitudes. Exploratory factor analysis and confirmatory factor analysis are used to measure passengers’ perceptions and to extract the main factors from the bus service attributes. Next, structural equation modeling is used to reveal how passengers’ perceptions vary by demographics and trip characteristics. Finally, multinomial logit modeling is used to explore the impact of perception factors on mode choice preference. The results of this study show that perceptions of the reliability and comfort of bus services have a more significant impact on passengers’ mode choice preference than perceptions of availability and safety do. The implications in terms of improving bus service reliability and comfort can increase bus ridership.
Introduction
Buses are the primary mode of public transit in most developing countries, including China. Due to rapid urbanization, the travel demand in metropolitan cities is high, and the travel market has become increasingly active. However, the market share of buses has steadily declined over recent years due to its less competitive service performance relative to other motorized modes. Numerous studies have been conducted to explore how to improve service quality to increase bus ridership in China.1,2 To date, most improvement measures have focused on technical aspects from an operator perspective. As it is widely recognized that the actual service performance of a transit system should be considered from the transit users’ perspective, 3 it is essential to investigate bus passengers’ perceptions of service performance and understand the role of these perceptions in their travel decision to develop market-oriented strategies that make buses more attractive to passengers.
Perception, which reflects people’s attitudes, is an abstract psychological concept and plays an important role in governing behavior. 4 Perceptions, of course, are in the eye of the beholder. The measurement of perceptions embodies the gap between passengers’ expectations and reality. The differences in perceptions are reflected in travel-related behaviors. 5 Accordingly, it is important to identify the impact of passengers’ perceptions of service performance on their mode choice preference, with a focus on finding effective ways to improve bus service.
Mode choice analysis is a critical aspect of the study of travel demand management. There are extensive studies on modeling and analyzing mode choice. Early research on mode choice mainly focused on observable travel time, cost, and trip-maker socioeconomic variables. Subsequently, individual attitudes toward travel modes were found to be important in the travel decision process. Attitudes, usually expressed by perceptions, were gradually introduced to models of mode choice as explanatory variables. However, in the bus-related studies, few researchers consider the impact of passengers’ perceptions of service performance when they conduct mode choice analysis.
The primary objective of this study is to identify whether bus passengers’ perceptions of service performance significantly influence mode choice preference, which could then be used to aid bus operators in improving their bus services. Specifically, this study comprises the following tasks: (1) measuring passengers’ perceptions of bus service performance and identifying the service attributes perceived as unsatisfactory, (2) analyzing how passengers’ perceptions of service performance vary by demographics and trip characteristics, and (3) identifying which perceived service attributes affect mode choice preference. The findings of this study may indicate which improvement measures would be most effective in increasing bus ridership.
The remainder of this article is organized as follows. The next section briefly summarizes the previous studies on this topic. Section “Research method” describes the research method, including the survey we conducted in Nanjing and the perception-based mode choice analysis. Section “Survey data analysis” presents the results of the analysis of the survey data. Section “Conclusion” discusses the findings and concludes with implications for improving bus services.
Literature review
As service performance is filtered through passengers’ perceptions, it is generally accepted that the perspective of transit users should be taken into account when evaluating transit service.6,7 The perception-based measure has been defined as a measure of how well the perceived quality matches the desired quality, 8 and it has become an essential tool for evaluating transit service quality.
Perception-based measures target users with experience using the service based on the hypothesis that users have a clear and accurate perception of current service performance. 9 Perception-based measures can be divided into two types: the importance of and satisfaction with listed service attributes. The importance of service attributes reflects users’ demands for service quality, and satisfaction reflects users’ evaluations of service quality.
Some studies have used the perception-based measures to evaluate service quality. The handbook published by Transportation Research Board provided detailed steps for measuring transit service based on users’ perceptions. 10 Iseki and Smart 11 introduced an examination of the perceptions of transit facilities using importance-satisfaction measures. Diana 12 measured multimodal travelers’ perceptions of transit services using satisfaction measures and adopted a one-score method to process the attitudinal data.
A close relationship between transit perceptions and mode choice preferences has been reported in several previous studies. Stopher13,14 first recognized that attitudinal data related to transit mode service performance should be analyzed in at travel mode choice study. Spear 15 determined that mode choice analysis with attitudinal service performance data as an input was a superior method. Kuppam et al. 16 found that attitudinal factors were more important than demographic variables in explaining mode choice behavior. Datz 17 investigated perceptions toward transit and found that teenage students with positive perceptions toward transit preferred transit use. Popuri et al. 18 found that travelers’ needs for a reliable, stress-free, and productive commute influenced their mode choice behavior significantly.
Passengers’ perceptions have also been found to be important in several bus-related studies. Hensher et al. 6 identified the important dimensions of bus service quality perceived by passengers. Ehab and Ahmed 19 evaluated the impact of implementing a combination of bus service improvement strategies on passengers’ perceptions. Moataz 20 measured the perception gap between current and potential users of bus services, identifying the important indicators of bus service quality.
These previous studies conclude by noting that although numerous applications exist for studying perception, too few concentrate on the relationship between perception and mode choice in the bus market. More studies need to be conducted in this field to increase bus ridership, which contributes strongly to reducing traffic congestion and environment pollution.
Based on these existing studies, this article explores the impact of perceptions of service performance on mode choice for the bus market. We conducted a survey in Nanjing to investigate bus passengers’ attitude toward existing service quality. With the survey data set, a perception-based mode choice analysis is used to examine the weaknesses of existing bus service performance and reveal the relationship between perceptions of service performance and mode choice preference.
Research method
Drawing on the literature, a comprehensive approach to explore the relationship between bus passengers’ perceptions of service performance and mode choice preference is presented in this section. The questionnaire design and data collection are introduced, followed by a brief description of the overall modeling framework, including structural equation modeling (SEM) and multinomial logit modeling (MNL).
Questionnaire design
To obtain passengers’ attitudinal information in terms of bus service perceptions and behavioral intentions, we designed a 32-question pilot questionnaire to collect data on passenger demographics, trip characteristics, passenger perceptions of bus service attributes, and passenger mode choice intentions in Stated Preference (SP) experiments.
The first section, the respondents were asked to complete nine questions, inquired about passenger demographics, such as gender, age, employment status, monthly income, and educational level, and trip characteristics, including trip purpose, reported frequency of bus use, the distance between the respondents’ homes and bus stops, and the availability of transit modes other than buses. The options of these questions are shown in Table 1.
Descriptive statistics of the survey data.

The second section, containing 20 questions, investigated passengers’ perceptions of bus service attributes. Passengers’ perceptions were measured by asking passengers to rate their level of satisfaction with a series of attributes of bus service quality on a 5-point Likert-type scale ranging from “very dissatisfied” to “very satisfied.” Based on previous research in the area of public transit quality management, a variety of attributes were introduced to estimate service quality. The Handbook for Measuring Customer Satisfaction and Service Quality 10 listed 23 attributes to evaluate transit service, and The Demand for Public Transport: A Practical Guide 21 showed that some attributes involving time had a direct influence, while other attributes (e.g. information provision, interchanges between modes) had an indirect influence. Based on the results of prior studies in terms of access to facility, service intervals, waiting environment, boarding and disembarking, in-vehicle travel, and vehicle characteristics, 20 attributes were chosen in this survey. The evaluation attributes were listed in an order corresponding to the process of taking a bus for consistency with the ordering of passenger perceptions.
The third section consisted of three SP questions to investigate passengers’ mode choice intentions. The SP technique was used to collect passenger intention data instead of travel diary data of mode choice based on the theory of planned behavior. Considering that an individual travel diary would involve a very large data volume and many scenarios, it would be difficult to extract the target data appropriate for the survey. Thus, it was more appropriate to collect intention data by asking passengers to compromise between some variables in specific situations. These data were used to explore the probability of passengers choosing to travel by bus rather than the subway or private car.
Trip length was identified as a crucial influential variable in mode choice analysis. Moreover, each transit mode has a different range of service distances. To explore the competition among buses, the subway, and private cars, three scenarios were designed with trip lengths of 5, 10, and 15 km, representing relatively short, moderate, and long distances, respectively, for general bus services in the survey city. 22 Passengers’ mode choice intentions were measured by asking passengers to choose their most preferred mode in each designed scenario.
Data collection
The survey was conducted in Nanjing, China, in April and May 2013. As an important economy and transportation center in southeastern China, Nanjing covers an area of 598 km2 and has a population of more than 8.1 million as of the end of 2012. The survey was conducted by intercept interviews in bus stations/stops and public recreation places near bus stations/stops, such as parks, open-air restaurants, and plazas in the metropolitan area. The respondents were selected by confirming they had bus experience.
A pilot survey was carried out to test the reliability of data collection due to the complexity of the questionnaire. This pilot survey revealed that respondents were willing to express their attitudes about bus service performance and their mode choice intentions in given scenarios, and most of them finished the questionnaire without seeming to lose patience or focus. However, for the demographics questions inquiring about employment status and educational level, most respondents were reluctant to answer, most likely because of privacy concerns. Based on this feedback, these two questions were deleted.
Next, the final survey was conducted using the refined questionnaire. To gain representative samples and reflect the enormously wide variety of bus facilities, we selected 36 bus stations/stops and the surroundings in four districts of the metropolitan area using multi-criteria selection conditions to minimize multicollinearity between station attributes. Ultimately, we collected 1225 surveys. After excluding the samples missing key information, 958 surveys (78.2%) were valid.
Perception-based mode choice analysis
In addition to individual demographics and trip characteristics, this article introduces perception factors into mode choice analysis. This analysis approach is based on SEM and MNL, and the detailed steps are as follows:
Step 1. Exploratory factor analysis (EFA) and confirmatory factor analysis (CFA) are used to construct the measure structure of passengers’ perceptions of bus service performance and extract major factors from 20 service attributes. To explain all service attributes of bus performance, EFA determined the number of latent factors and CFA verified the structural relationship among service attributes.
Step 2. SEM is used to reveal the influence of individual demographics and trip characteristics on passengers’ perceptions of bus service performance. The final set of latent factors are used as perception variables in mode choice analysis, and the values of those variables are calculated by measuring the service attributes and coefficients between the latent factors and service attributes.
Step 3. MNL is established to identify the influence of various factors on mode choice among bus, subway, and private car. Three categories of factors are estimated in MNL: individual demographics, trip characteristics, and perceptions of bus service performance. MNL helps identify the important factors and their degree of influence on mode choice preference.
The framework of perception-based mode choice analysis is presented in Figure 1.

Perception-based mode choice analysis framework.
SEM
As a measurement tool, SEM can handle several dependent variables simultaneously and estimate the structure of factors and relationships among them. 22 Furthermore, endogenous and exogenous variables as well as latent variables specified as linear combinations of explanatory variables are convenient for quantitative analysis. 23 Considering passengers’ attitudes reflected by perceptions of a series of service attributes, the objective of applying SEM in this article is to extract latent factors from 20 service attributes and understand how passengers’ perceptions vary by individual demographics and trip characteristics.
The measurement model and the structural model are estimated simultaneously in SEM. Based on EFA, the measurement model is applied to detect the coefficients between latent factors and service attributes with a factor-loading matrix. The structural model is used to identify the factors affecting passengers’ perceptions of bus service performance and their relative degree of influence.
The final latent factors represent passengers’ perceptions of all service attributes, and their values are determined by attribute measurements and the corresponding coefficients. The final latent factors can be written as follows

where Fi indicates the passengers’ perceptions of latent factor i, N indicates the total number of attributes corresponding to latent factor i, xn indicates the measurements of attribute n, and cni indicates the coefficients between latent factor i and attribute n.
MNL
Disaggregate models based on random utility theory 24 are commonly used in mode choice analysis. MNL is adopted in this article because of its ability to estimate mode shares among more than two choices.
The use of MNL to estimate individual mode choice preference is based on two assumptions: (1) the responder is the fundamental unit for determining mode choice preferences and (2) the responder chooses the option with the maximum utility. 25
To explore the role of passengers’ perceptions in the mode choice decision process, in addition to individual demographics and trip characteristics, perceptions of bus service performance are introduced into the utility functions of choices. Each deterministic component in the function utility of mode choice contains three sets of variables, as follows

where Vin are the deterministic components of the function utility of responder n choosing mode i; α is the alternative-specific bias constant; Ai are the individual demographic characteristics of mode i, including gender, age, and income; Ti are the individual trip characteristics of mode i, including trip purpose, reported frequency of bus use, distance between bus stops and home, and availability of alternative transit modes; θ, θ′, and θ″ are the column vectors of the parameters corresponding to each constituent variable Ai, Ti, and Fi, respectively.
Survey data analysis
Descriptive statistics
Table 1 presents the survey passengers’ demographics and trip characteristics in the final data set. Every variable was assigned with an integer greater than zero, preparing data for the model analysis. All passengers in the survey were over 15 years old (by design), with all the major age cohorts represented in the sample. Passengers with different levels of income were included. Nearly half of the passengers mainly rode the bus to go to work/school. The survey contained some occasional bus riders (18.5% rode less than 1 day/week), moderate bus riders (26.1% rode 1–2 days/week), and heavy bus riders (45.4% rode more than 3 days/week). Most passengers felt that it was convenient to find bus stops near home, with 44.3% feeling that bus stops were located close to their homes and 39.5% finding the distance acceptable. Moreover, approximately 37.9% of passengers felt that it was difficult to find alternative modes of transportation, with only 13.1% finding it easy to use alternative modes.
Table 2 shows the bus service attributes and their descriptive statistics. It can be seen that passengers are least satisfied with the waiting times (Q5). In addition, service frequency (Q7), smoothness of ride (Q14), bus stop conditions (Q9, Q10), and in-vehicle conditions (Q19) were also perceived as unsatisfactory. When referring to some service attributes of operational inherent features (Q3, Q4, Q12), the level of passenger satisfaction was relatively high. Thus, there are significant gaps between the actual out-of-vehicle perceptions of bus services (including waiting time and waiting environment) and passengers’ expectations. Importantly, passengers generally perceive bus service performance to be moderately satisfactory.
Descriptive statistics of bus service attributes.

SD: standard deviation.
Identifying the measure structure of perceptions using EFA and CFA
EFA is used to extract the proper latent factors from a series of service attributes. Using the VARIMAX rotation technique, principal component analysis is performed to explore the latent factor dimensionalities of bus service attributes. In this study, using the criterion of eigenvalues being greater than 1.0, four latent factors were extracted from 20 bus service attributes, explaining 60.9% of the total variance. The attributes under every latent factor are retained only if they have factor loadings greater than 0.5, indicating a strong correlation. 26
CFA is used to verify the structural relationships between the latent factors and bus service attributes. Based on the EFA results, CFA is conducted in LISREL 8.7. The resulting root mean square error of approximation (RMSEA) is 0.07, indicating a good fit of the confirmatory model. 27 The final set of latent factors is shown in Table 3.
Identifying latent factors.

As shown in Table 3, all service attributes are significant at the 0.01 level, with t-values greater than 2.64. Each latent factor is a linear combination of five bus service attributes and appropriately explains all related attributes: factor 1 includes service attributes (Q1–Q4, Q12) related to bus service availability, factor 2 reflects the reliability of bus operation (Q5–Q8, Q13), factor 3 involves the safety of taking the bus (Q11, Q14–16, Q20), and factor 4 is related to the comfort of the facilities supplied in bus operation (Q9, Q10, Q17–19). Overall, passengers’ perceptions of bus service performance are measured in terms of satisfaction with four aspects of bus service: availability, reliability, safety, and comfort.
Estimating the influential factors of passengers’ perceptions using SEM
The SEM was created in LISERL 8.7 to reveal how passengers’ perceptions vary by demographics and trip characteristics. The measurement model and structural model are estimated simultaneously. The model structure is shown in Figure 2.

Structural equation model.
The SEM is estimated using the normal theory maximum likelihood (ML) method. Five common measures are used to estimate the model fit: the ratio of the chi-square value to degrees of freedom (χ2/df), goodness-of-fit index (GFI), comparative fit index (CFI), incremental fit index (normed fit index (NFI)) and RMSEA. Values of GFI, CFI, and NFI above 0.9 indicate a close fit of the model to the data, 26 as does an RMSEA of less than 0.1. 27 The SEM in this study has a χ2/df of 4.8 (1346.93/276), corresponding to a probability of 0.99. The values of GFI (0.90), CFI (0.97), NFI (0.97), and RMSEA (0.07) are all acceptable, indicating that the SEM is acceptable for the survey data.
As shown in Figure 2, in the measurement model, the coefficients between the latent factors and bus service attributes are generally consistent with the results of CFA (presented in Table 3). The score of latent factors is calculated by the corresponding service attribute measurements and coefficients and further used as the input of the perception variables for mode choice analysis. In the structural model, three individual demographic characteristics and four trip characteristics are identified as exogenous variables, and four latent perception factors of bus service attributes are identified as endogenous variables. The coefficients between the exogenous and endogenous variables reflect the degree of influence of the exogenous variables on the endogenous variables.
Table 4 shows the total effect of the individual demographics and trip characteristics on passengers’ perceptions. It can be seen from the total effect that there are apparent relationships between individual demographics and trip characteristics and passengers’ perceptions. This result explains the different perceptions of each socio-demographic sub-group of bus service performance.
Effect of individual demographics and trip characteristics.

Significance at the level of 0.01; **significance at the level of 0.05; *significance at the level of 0.1.
On one hand, perception factors are affected by individual demographic characteristics to some extent. For the perception factor of availability, gender and age are significantly important, with total effects of 0.08 and 0.15, respectively. A similar interpretation of the results can be attributed to every perception factor and significant variable. The lack of significance of some demographic variables is also important. For instance, the perception of comfort is only slightly influenced by income (total effect of 0.01), implying that similar attitudes toward comfort can be found across passengers in different income cohorts.
On the other hand, the value of the total effect of trip characteristics is greater, especially “availability of alternative modes.” All latent factors are negatively related to availability of alternative modes for bus trips, with values of −0.26, −0.13, −0.13, and −0.09, respectively, indicating that passengers with more opportunities to use alternative modes are less satisfied with bus service performance. Importantly, “trip purpose” is not an important influential factor, as its influence on the perception of reliability is small (with total effect of 0.02), implying similar attitudes shared by passengers with different travel purposes. Reliability, safety, and comfort are positively related to the reported frequency of taking the bus (with total effects of 0.04, 0.06, and 0.06, respectively), indicating that people with more bus trip experience have higher satisfaction levels. Similarly, availability, safety, and comfort are positively related to distance between bus stops and home (with total effects of 0.15, 0.06, and 0.03, respectively), revealing that passengers who find bus stops easily near their home have a better impression of the availability, safety, and comfort of bus services.
It can be concluded from the results that passengers’ perceptions of bus services are mainly based on their general bus experience. It is notable that passengers who can readily use alternative modes are less satisfied with the availability of bus services. Improving the service attributes of availability may encourage these passengers to increase their bus ridership. Meanwhile, various demographic groups of passengers share attitudes toward bus service performance; for instance, older women are most satisfied with the availability of bus service. These findings help understand the respective influence factors for passengers’ perceptions in terms of the four latent factors of bus service and are useful for developing improvements to encourage increased bus ridership among specific groups.
Determining the impact of passengers’ perceptions on mode choice preferences using MNL
Passengers’ mode choice preference was analyzed using MNL regression to identify the influential factors in mode choice decision when comparing buses with the subway and private cars. Previous studies have proved the heterogeneity of travel behavior for different trip distances.28–31 Given the three scenarios with trip lengths of 5, 10, and 15 km, passengers report different mode choices, as shown in Figure 3. It can be observed that the bus mode is preferred for short trip distances. With increasing trip distance, the market share of buses decreases sharply. For moderate and long trip lengths, the subway mode is the most preferred. More passengers choose private car than bus for long trips, which suggests that buses have a slight advantage in the short-distance trip market, while the subway has an absolute advantage in the moderate- and long-distance trip markets.

Mode choice distribution for different trip lengths.
For the mode choice modeling, bus, subway, and private car modes are chosen as the dependent variables. The independent variables are classified into three categories: demographics, trip characteristics, and perception factors of bus service performance. The demographics and trip characteristics are obtained from the survey data, as presented in Table 1, and the values of perception factors are obtained from the factor scores of SEM analysis.
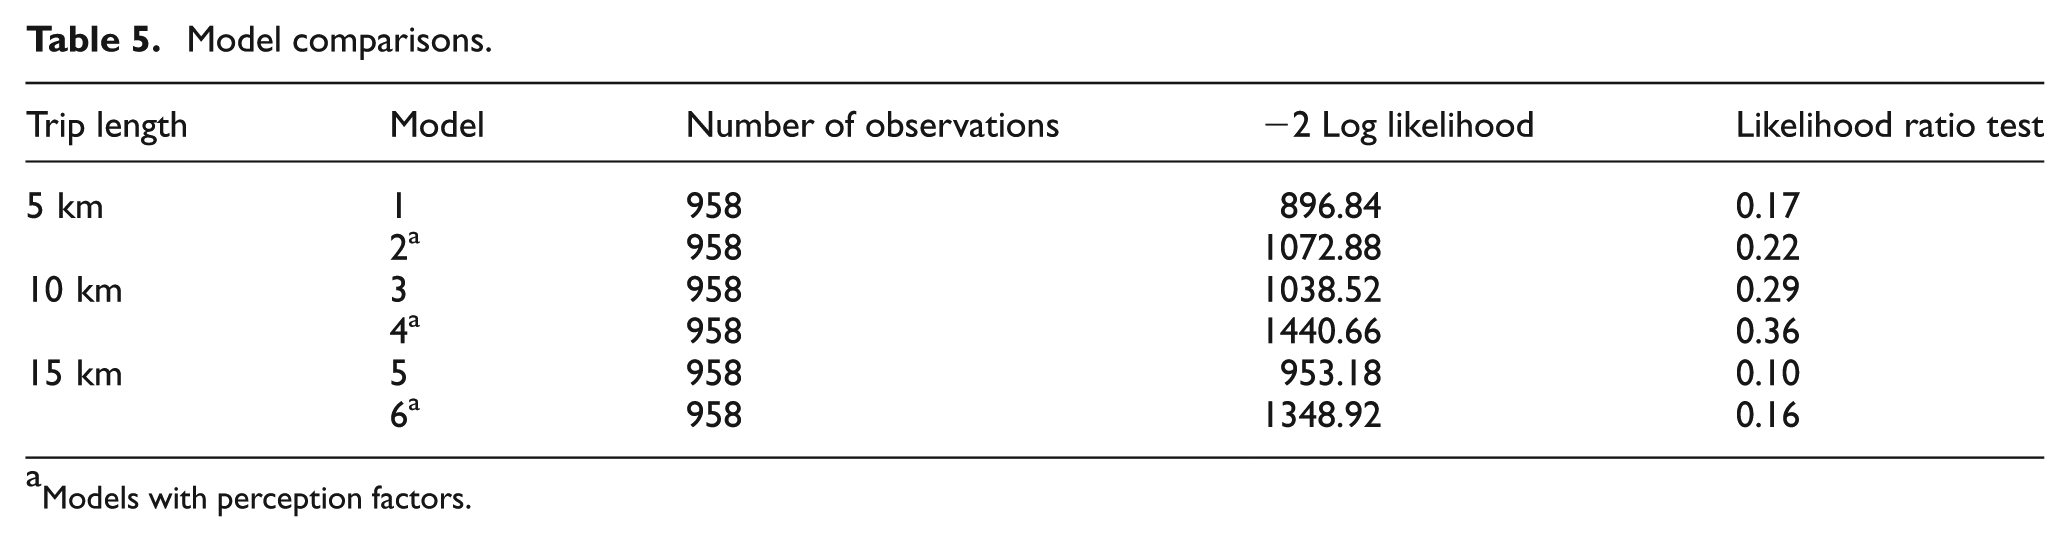
Models of mode choice for each scenario were developed using a stepwise process of adding variables of a common type to the model. Six models for 5, 10, and 15 km were developed in two steps. Step 1 only includes demographics and trip characteristics as independent variables, while Step 2 includes the variables of Step 1 as well as four perception factors. The results of these hierarchically specified models are compared using the chi-square statistics of the likelihood ratio, as presented in Table 5. With the addition of the perception factors, the values of the −2 Log likelihood and likelihood ratio test of models are greater, indicating that the models including the perception factors explain a larger percentage of the variation. In other words, the models including perception factors have a better goodness of fit.
Model comparisons.
Models with perception factors.
The coefficients of the independent variables are estimated using an iterative ML method in BIOGEME 1.8. Table 6 provides the coefficients of the perception factors in choice models 2, 4, and 6, reflecting the impact of passengers’ perceptions on mode choice preference.
Results of MNL regression analysis.

MNL: multinomial logit modeling.
Significance at the level of 0.01; **significance at the level of 0.05; *significance at the level of 0.1.
As reported, each model includes the significant perception factors of bus service and significance level. For short-distance trips, the mode choice of bus is positively affected by perceptions of availability and safety, while subway use is negatively related to reliability, and private car is negatively related to availability and comfort. That is, passengers who are highly satisfied with the reliability and safety of the bus service have a high probability of choosing buses for short-distance trips, whereas those with low satisfaction with bus reliability prefer the subway. Additionally, passengers choose private cars instead of buses for short trip distances as a result of negative perceptions of the availability and comfort of bus services.
For moderate-distance trips, passengers’ perceptions of bus reliability also play a significant role in their choice between the subway and bus. A similar effect of reliability perception occurs for mode choice between the subway and a private car. As many bus passengers prefer the subway for moderate-distance trips (shown in Figure 2), it can be inferred based on the MNL model results that this passenger mode choice preference is derived from a lack of confidence in bus service reliability and comfort.
Finally, for long-distance trips, passengers who prefer the subway in this scenario are not satisfied with the reliability or comfort of buses. In contrast, passengers who opt for buses for long-distance trips are highly satisfied with the comfort of bus services. It is notable that the impact of perceptions of the reliability of bus service is reduced for long-distance trips. One possible reason is that passengers are more concerned about comfort than operation reliability, as any delays are likely to be small relative to the long travel time.
In conclusion, passengers’ perceptions of the reliability and comfort of bus service have a more significant impact than those of availability and safety on their mode choice preferences. In general, buses are the most frequently chosen mode for short-distance trips, while the subway dominates the moderate- and long-distance trip markets. In the three scenarios, all passengers preferring the subway to the bus had negative perceptions of the reliability of the bus service, and those choosing buses for moderate and long trips were highly satisfied with bus comfort.
Conclusion
This study explored the impact of bus passengers’ perceptions of service performance on mode choice preference. The perception-based mode choice analysis presented here showed how perceptions of service performance can be measured, the level of heterogeneity of perceptions among different passenger groups, and how perceptions can be incorporated in mode choice modeling.
The data used in this study are state survey data with 958 observations collected in Nanjing, China. Three kinds of information are obtained from the survey based on the totally 32 questions: characteristics of the travelers, perceptions of bus service level, and travelers’ mode choice intentions.
According to the 20 questions in the survey, 20 bus service attributes are extracted for further analysis. At first, EFA and CFA are applied to extract the proper latent factors from a series of service attributes and verify the structural relationships between the latent factors and bus service attributes, respectively. The 20 service attributes were divided into four classes, which respond to four perception factors, namely, availability, reliability, safety, and comfort. Out-of-vehicle perceptions, especially waiting time and waiting environment, were found to be most negatively perceived by passengers, in agreement with previous analyses.
Then, a SEM with four latent variables was developed to reveal passengers’ perceptions varied significantly by demographics and trip characteristics. The measurement equations in this SEM are defined based on the findings from EFA and CFA. The SEM was estimated using the survey data. Several findings were obtained from the estimation results: (1) According to the significance tests, the seven attributes associated with travelers and trips have different levels of effects on different perception factors. For instance, Trip purpose only significantly affects travelers’ perceptions on Reliability, while Reported frequency of taking bus has significant effects on all of the four perception factors; (2) according to the signs of estimated parameters, passengers with more opportunities to use alternative modes were less satisfied with bus service performance, while passengers who found bus stops easily near their home had a better impression of the availability, safety, and comfort of bus services and who with more bus trip experience had higher satisfaction levels. For demographics variables, the female held better perception of availability than the male, and the older perceived the availability better than the young.
Finally, three MNL-based mode choice models for three scenarios of trip lengths were developed, which explicitly considered the perception factors. The independent variables are classified into three categories: demographics, trip characteristics, and perception factors of bus service performance in MNL. The results showed that the perception factors of reliability and comfort of a bus service had a more significant impact on passengers’ mode choice preferences than do perceptions of availability and safety. In the situation of short-distance trips, passengers who were highly satisfied with the reliability and safety of the bus service had a high probability of choosing buses, whereas those with low satisfaction with bus reliability preferred the subway. Additionally, passengers chose private cars instead of buses as a result of negative perceptions of the availability and comfort of bus services. In the situation of moderate-distance trips, many bus passengers preferred the subway as a result of a lack of confidence in bus service reliability and comfort. In the situation of long-distance trips, passengers who preferred the subway were not satisfied with the reliability or comfort of buses. In contrast, passengers who chose buses were highly satisfied with the comfort of bus services. The impact of perceptions of the reliability of bus service was weakened, maybe owing to that passengers were more concerned about comfort than operation reliability, as any delays were likely to be small relative to the long travel time. And none of the performance perception variables were significant for choosing private cars, which may be because that other factors such as travel time played more important roles than bus service perceptions in their choice preferences.
According to the behavioral findings, we can also get several implications for transportation planning. Bus service has few advantages in the competition with subway and private cars; in particular, the poor reliability of the bus service pushed passengers to other modes. However, a high perception of bus service comfort can lead passengers to choose bus travel. Improvements related to bus service reliability and comfort;, such as measures of increasing service frequency, ensuring on-time performance, and enhancing travel comfort, can effectively increase bus ridership and bolster the bus market.
This study provided findings from 36 bus stations/stops and the surrounding areas in four different districts in Nanjing and identified the impact of passengers’ perceptions of bus service performance on their mode choice preference. Due to differences in the environmental and facility conditions of the bus services in China and those in other countries, the impact of passengers’ perceptions of service performance identified in this study may not be directly transferrable to other countries. However, the perception-based mode choice analytical approach presented in this article can be applied to bus systems elsewhere. This analysis shows that intentional questions can be used to measure passengers’ perceptions. Furthermore, this analysis identifies the significant impact of perceptions on mode choice. It provides useful information for bus operators for improving bus services to expand the targeted market.
Footnotes
Acknowledgements
The authors would like to thank Beijing Key Laboratory for Cooperative Vehicle Infrastructure Systems and Safety Control and the senior students from the Transportation School of Southeast University for research assistance.
Declaration of conflicting interests
The authors declare that there is no conflict of interest.
Funding
This research is supported by the National High Technology Research and Development Program of China (Grant No. 2014AA110303) and the National Natural Science Foundation of China (No. 51478112, No. 51108080).