
Abstract
Reinforced concrete structures exposed to marine environment often sustain high levels of chloride-induced reinforcement corrosion, which causes reinforcement corrosion and resulting in degraded performance under cyclic service loading. This article studied the dynamic bond performance between corroded reinforcing and concrete under force controlled loading. Tests were carried out to evaluate the cyclic bond-slip degradation with different reinforcement corrosion levels. A series of 30 specimens with various corrosion levels of rebar and stirrup were made. The specimen was cast as concrete cube with the dimension of 200 mm, and a steel rebar was centrally embedded with two stirrups around. The embedded steel rebar and stirrups were corroded using an electrochemical accelerated corrosion technique. The corrosion crack opening width and length were recorded after completion of artificial corrosion. Then, cyclic loading test was carried out; three different force levels of 24, 36, and 48 kN were adopted. The effects of reinforcement corrosion rate on crack opening, maximum slip, energy dissipation, and unloading stiffness were discussed in detail. It was found that both reinforcement corrosion rate and crack opening would have significant effects on cyclic bond performance. Further studies are urgently needed to quantify these effects to the cyclic bond performance.
Introduction
Corrosion of steel reinforcement embedded in concrete is an electrochemistry process; it is a major problem faced by civil engineers and surveyors today as they maintain an aging infrastructure. Studies confirm that corrosion affected significantly the structural elements. The dynamic and static mechanical performances of corroded members have been investigated,1–3 and it was confirmed that their performance was diminished significantly. Now, it has been understood by engineering professions that the deterioration of performance was mainly due to the following three factors: loss of rebar area, spalling of concrete cover, and bond degradation due to steel reinforcement corrosion. Earlier studies found that there existed a limit corrosion rate (mostly smaller than 5% reduction in bar cross section), and corrosion might have a beneficial effect on bond in deformed bars under this limit.4–7 At corrosion levels above this limit, the bond capacity dropped off significantly.5,8
Bond performance is primarily dependent on three factors: concrete compressive strength, confinement, and surface of the rebar (deformed or round).9,10 Recent research about the cyclic bond performance for corroded round and deformed rebar with and without confinement 11 showed different performances as stirrup confinement changed. It should be noted that stirrup is more vulnerable to marine environment corrosion than rebar as the concrete cover is thinner for stirrup. 12 However, little information is available for the effects of stirrup corrosion on the cyclic bond performance. Furthermore, most of the reported literatures are mainly focused on the ultimate bond strength by displacement controlled loading,11,13 and little information is known about dynamic bond performance under force controlled loading. The cyclic controlled force loading corresponds to cyclic service loading, such as fluctuation wind load, repeated running vehicle load, and so on. In this article, the effects of corrosion on cyclic bond behavior were explored by cyclic loading tests of 30 accelerated corroded specimens with special attention to the effects of stirrup corrosion. The effects of reinforcement corrosion on cyclic bond performance with the correlation of crack opening were discussed.
Test setup and procedure
Test specimen
Specimens consisted of deformed steel rebar set in a concrete prism with two stirrups to provide confinement. Polyvinyl chloride (PVC) pipe was used to limit the bonded length of 80 mm (five times of rebar diameter, Figure 1). The bonded length is much less than the development length of the rebar, so that the bond stress along the rebar is relatively uniform. Stirrups at close spacing provide confinement along the bonded length and help to limit any end effects.

Test specimen: (a) front cross-sectional view and (b) side cross-sectional view (all dimensions in millimeter).
Concrete mix design
The concrete was designed to have at least a 30 MPa compressive strength with a water-cement ratio of 0.41 which conforms to the requirements of Chinese concrete mix proportion design code. 14 The concrete mix content per cubic meter is 187.21 kg water, 456.96 kg ordinary Portland cement, 497.96 kg sand, and 1161.90 kg stone (20 mm). Concrete cubes with dimensions of 100 × 100 × 100 mm3 were also cast for the compressive strength. This mix was found to have a 28-day average compressive strength of 43.2 MPa.
Construction
The rebar was dried thoroughly to remove any machining fluid that may come in contact with the surface prior to pouring of the specimens. PVC piping was also used to keep the submerged end of the reinforcing dry during the corrosion bath. The reinforced rebar was horizontal as concrete was casted in the mold. The position of stirrups was fixed by spacers.
Accelerated corrosion
The specimens were corroded using an electrochemical accelerated corrosion technique that involved impressing a current through the specimens to accelerate the oxidation process in a 5% NaCl solution. Similar setup has been adopted by several researchers.4,8,11,13 To establish different corrosion levels for rebar and stirrups, rough predictions of the level of corrosion was estimated according to the weight loss of the rebar and stirrup. The theoretically calculated amount of corrosion products, in terms of the duration of electrolytic time, can be expressed by the following Faraday’s law

where T is corrosion duration time,
In this study, the current density was set as
Specimens were soaked for 5 days prior to application of the current. The accelerated corrosion was actually carried out by two steps: the rebar was corroded first by 10 specimens in series (Figure 2(a)). After the rebar has reached the corrosion time that corresponds to theoretical corrosion level, the direct-current (DC) power was switched to connect the stirrups for the second step corrosion by two specimens in series (Figure 2(b)).Figure 2(c) shows the photograph of the accelerated corrosion. The maximum required artificial corrosion process took approximately 150 days for no. 29 and no. 30 specimens.
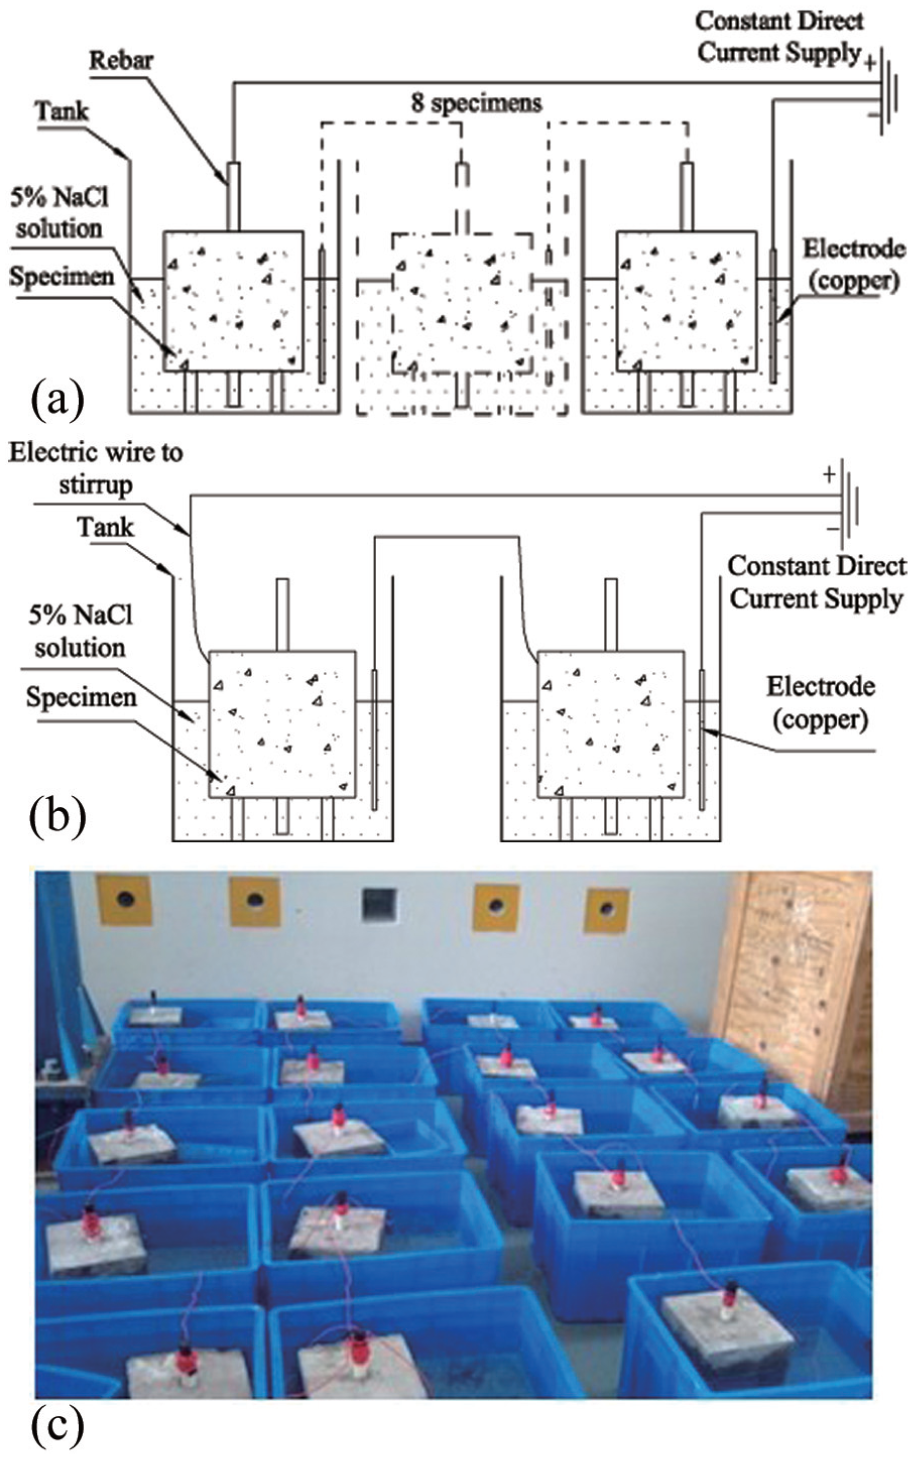
Electrochemical corrosion system: (a) schematic drawing for rebar corrosion, (b) schematic drawing for stirrup corrosion, and (c) photograph of corrosion setup.
The reinforcement was cleaned using a 12% hydrochloric acid solution to remove scale and rust products and weighed before casting the specimens. After the corrosion process and loading test, the corroded rebar and stirrup were derived by opening the specimens. Then, they were cleaned and weighed again. The real reduction in cross section was measured as the loss in weight of stirrup and rebar along the bond length before corrosion, thereby the loss in weight representing an average corrosion level for rebar along the bond length and stirrup. The weight loss of reinforcement could then be derived by the following equation


where
Table 1 lists the tested specimens; the weight loss of reinforcement ranged from 0% to 15%. It is found that the measured weight loss of reinforcement is not the same as the theoretical predicted one; however, this has no effects on the results of this study as only the measured weight loss of reinforcement was used in the following studies.
Weight loss ratio of reinforcement, maximum crack width, and total length of tested specimens.

Crack opening after artificial corrosion
During accelerated corrosion process, some corrosion products appeared from the corrosion cracks. The color of corrosion products was black green at early stage and turned brown at last. This was due to the incomplete oxidation of corrosion product for lack of oxygen at the early stage and entirely reacted lately. After the accelerated corrosion, the test specimens were dried and the length and width of cracks were measured as recent studies showed the potential effects of crack opening to bond performance. 16 The crack length was measured by ruler, and the width was measured by width gauge (3–5 cm reading once and then calculate the maximum width). It is found that there were mainly two different kinds of cracks (Figure 3). One was due to the corrosion of stirrups, and it is in the horizontal direction and parallel to stirrup location. The other was in the vertical direction, which was due to the incompatibility of spacers and concrete, and it was much shorter than the horizontal one and only near to the location of spacers. The vertical crack has no relation with corrosion, so they were not included in the data of total crack length and maximum crack width (Table 1) in the following analysis.

Cracks after corrosion (
Figure 4 shows the stirrup corrosion rate versus total crack length and maximum crack width. It clearly shows increasing of both maximum crack width and total crack length as stirrup corrosion rate increases. It was confirmed that the crack opening is strongly related to stirrup corrosion. 17 This correlation of concrete cracking with stirrup corrosion rate has significant influence on the bond performance as discussed in the following. Studies also showed that the rebar corrosion rate had no such relation with maximum crack width and total crack length for the cover depth of rebar is much larger than that of stirrup for this specially designed specimen.
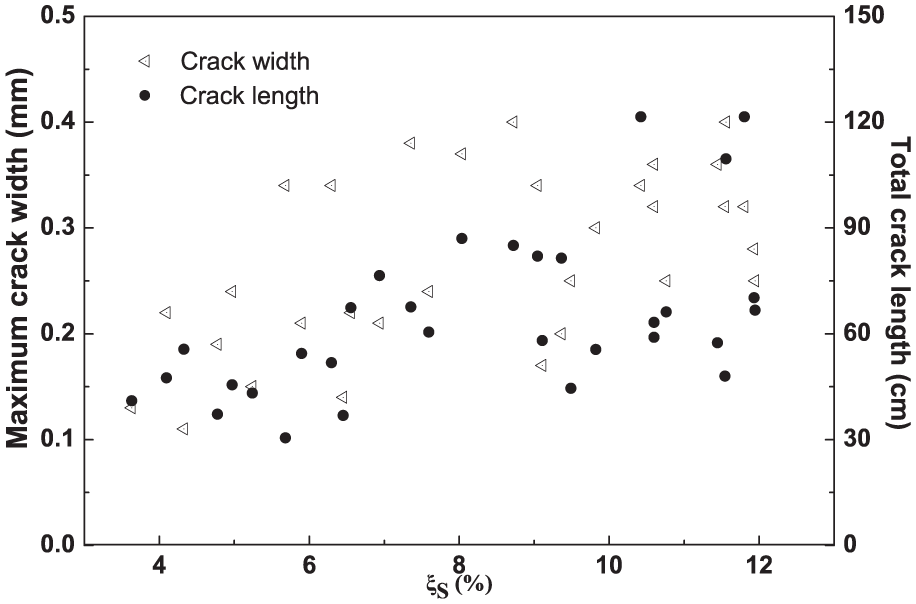
Stirrup corrosion rate versus total crack length and maximum crack width.
Loading and measuring instruction
The corroded specimens were tested in a loading machine with a specially designed and fabricated loading frame. Figure 5(a) shows the schematic drawing of the loading and measuring system, and Figure 5(c) shows the system photograph. Load force was measured through the load cell, and the free-end slip was measured using an extensometer with precision of ±0.001 mm. The extensometer was attached between the rebar and the bottom surface of concrete as shown in Figure 5(b) and (d). The cyclic loading was incrementally increased or decreased to the maximum or minimum force of ±24, ±36, ±48, and ±24 kN, with three complete cycles performed for the first three force levels, and two cycles for the end ±24 kN. The last ±24 kN-level cycles were to compare the performance of bond-slip behavior after large force amplitude cyclic loading. All the loads were applied through the computer using displacement–control. The loading speed was set as 0.4 mm/min during cyclic loading.

Loading and measuring system: (a) schematic drawing, (b) detail of extensometer installation, (c) photograph of system, and (d) photograph of extensometer.
Test results
General observations
Figure 6 shows typical cyclic bond stress–slip curves of no. 2, no. 7, and no. 10 specimens. The bond stress could be derived from the measured load force by the following formulation

where l is the bond length, d is the diameter of rebar, and P is the measured load force. It should be noted that the rebar corrosion rate of the above three specimens is only increased from 1.1% to 2.79%, but stirrup corrosion rate is increased from 4.97% to 11.93%. Here, rebar slip in the direction of pulling out is defined as positive, while that in the opposite direction is defined as negative. The three bond-slip loops show the similar “S” shaped curves. The observed loops have asymmetrical shapes, especially when the loading force becomes large; this may be due to the mixed nature of concrete. The bond stress–slip curve starts at a slip value of 0 and ascends toward a peak value of the bond stress. For the first three cycles corresponding to load force level of ±24 kN, the maximum slip value of second and third cycles is close to that of the first cycle, which means that the degradation of bond is trivial for the force level of ±24 kN. However, the maximum slip value increases rapidly after the fourth cycle for the loading force level of ±36 kN, and it increases further rapidly for the force level of ±48 kN. The maximum slip value for the last two circles of ±24 kN is much larger than that of the first three circles of ±24 kN. The unloading stiffness seems degraded significantly for the first loading cycle and the last loading cycle, and this will be discussed later.

Typical bond stress–slip loops: (a) specimen no. 2, (b) specimen no. 7, and (c) specimen no. 10.
These above observations illustrated degradation of bond between reinforcing steel bar and concrete under cyclic loading. It could be confirmed that the corrosion damaged bond degradation is strongly related to the maximum loading force level. The maximum bond-slip values of the same force level are far different from each other for different loading histories. This indicates that the bond performance depended on the load history. 9 And most importantly, Figure 6 also indicates that different reinforcement corrosion levels have significant influence on hysteretic loops as discussed in the following.
Maximum slip value
Effects of rebar corrosion
As the loading force is determined in each cycle, it is interesting to evaluate the corresponding maximum slip value. Certainly, the larger the maximum slip value, the severe the degradation of bonding performance for the tested specimens. Figure 7(a) shows the maximum slip versus rebar corrosion levels under different loading cycles for all the tested specimens. Here, the maximum slip value is the average of the maximum and the absolute minimum slip value of the last loading cycle for each applied force level. A tendency of decreasing slip value as rebar corrosion level increases could be observed for rebar corrosion level smaller than 6%; this well accords with other reported results that a slight rebar corrosion will enhance the bond behaviors. However, it is a pity that most specimens have rebar corrosion level smaller than 6%, and the results of higher rebar corrosion level could not be confirmed from this test. It should be noted that the points in Figure 7(a) are a bit scattered, especially when the load force and stirrup corrosion rate are higher; which may suggest that other factors may also have effects on the maximum slip value.
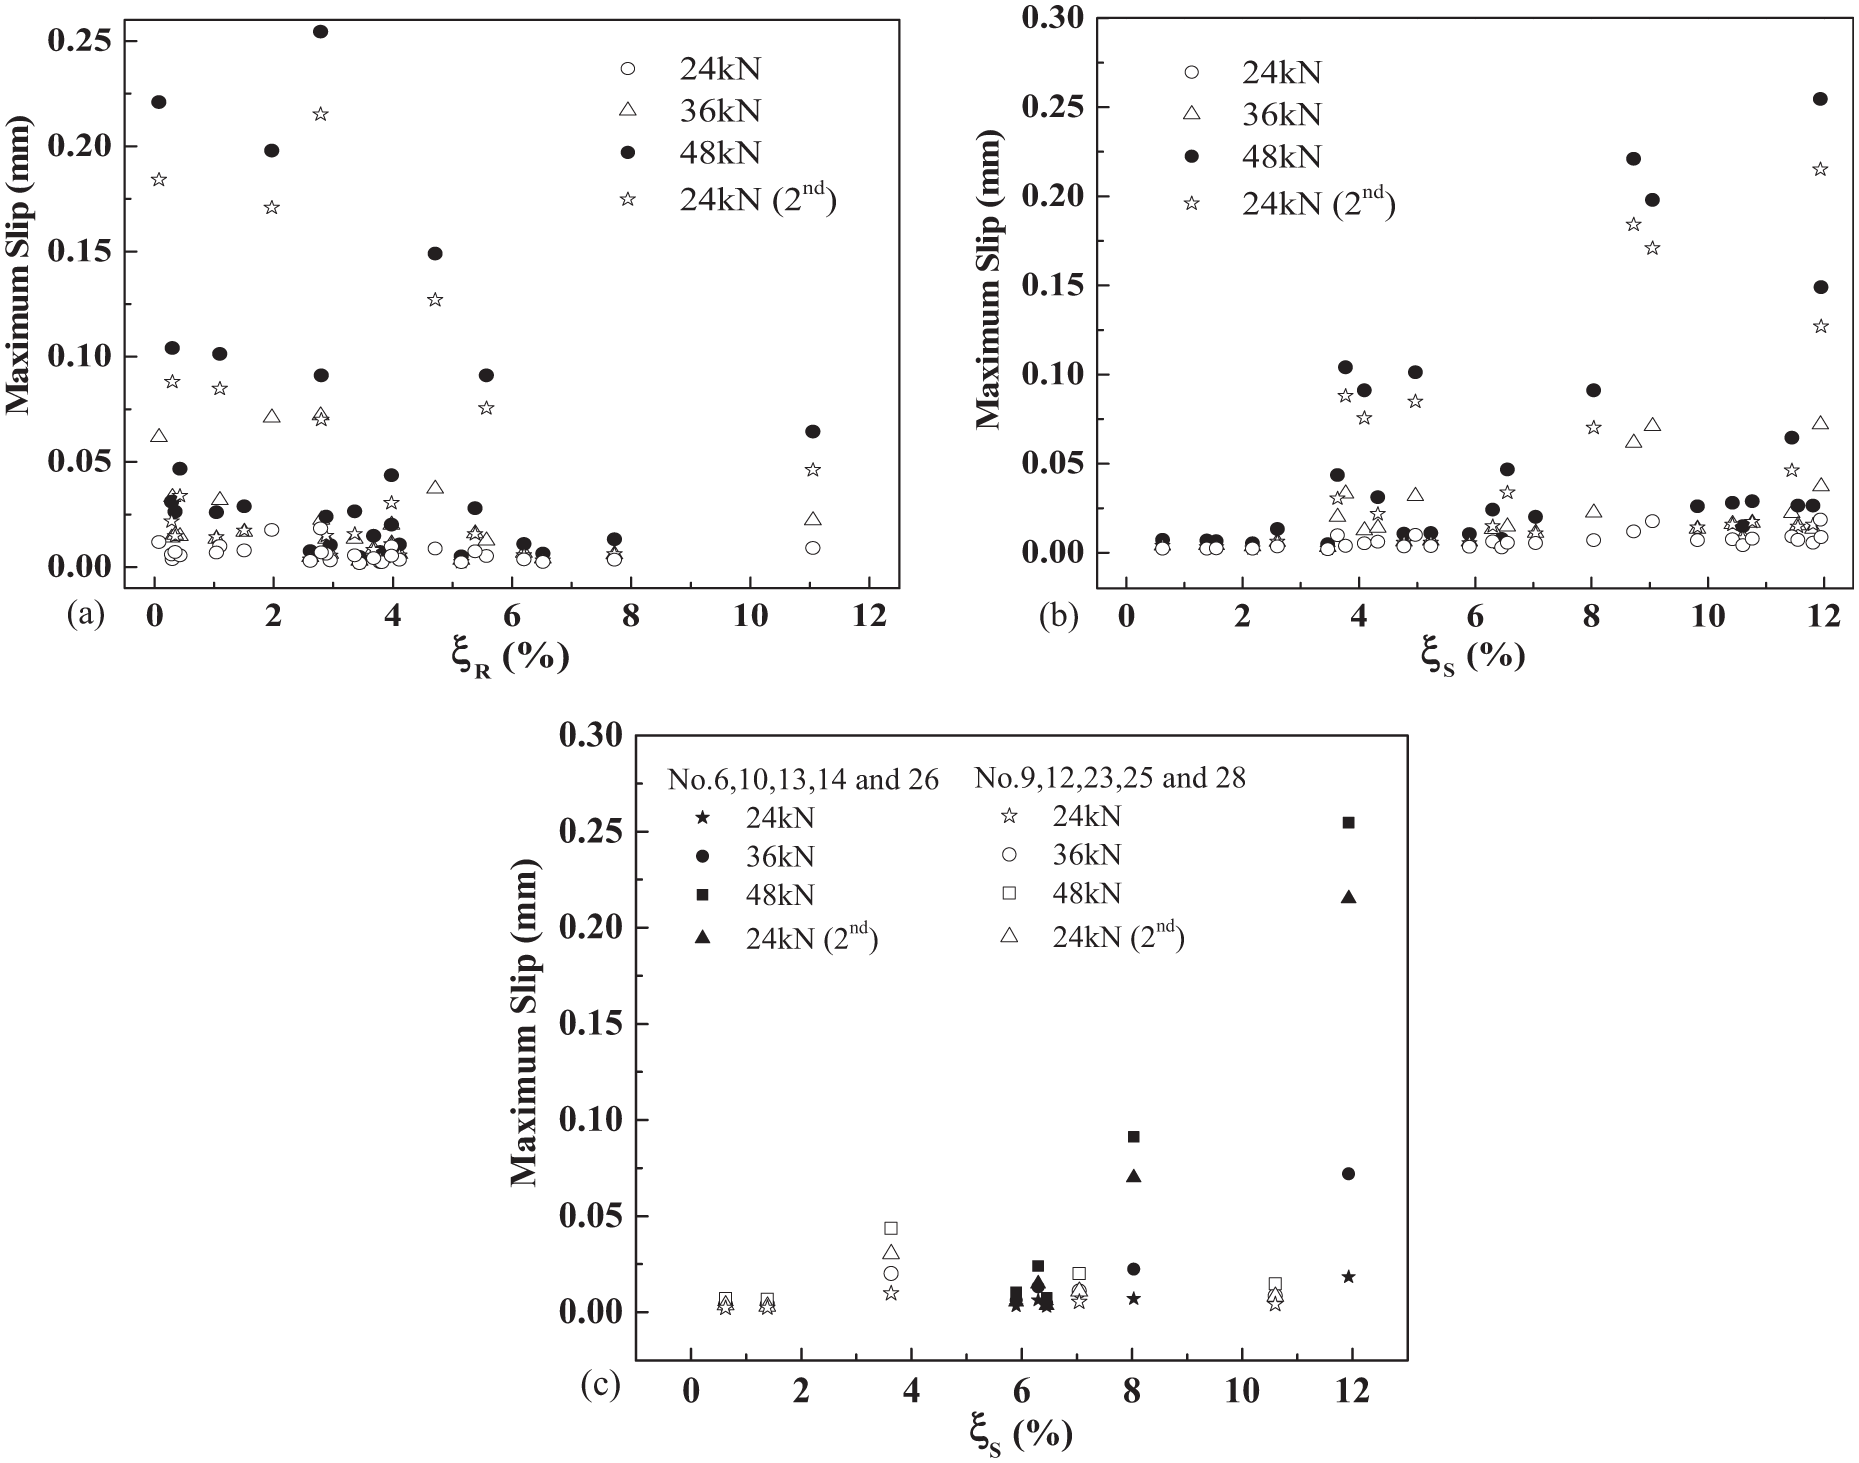
Maximum slip versus reinforcement corrosion ratio at different force levels: (a) rebar, (b) stirrup (all specimens), and (c) stirrup (two groups of specimens).
Effects of stirrup corrosion
Figure 7(b) shows the maximum slip value versus stirrup corrosion level under different loading force cycles for all the tested specimens. It clearly shows that the maximum slip values increase slightly as the stirrup corrosion levels increase for the first three ±24 kN loading force cycles. However, as the cyclic loading force increases, the maximum slip value increases rapidly as the stirrup corrosion levels increase. And this tendency also exists for the last two loading cycles of ±24 kN force level. It is confirmed that the stirrup corrosion level has great effects on bond performance, and it seems that the bond performance will be greatly degraded after combined corrosion and large force loading cycles.
To further assess the combined effects of both rebar and stirrup corrosion, Figure 7(c) gives the maximum slip versus stirrup corrosion level by two groups of specimens with rebar corrosion levels of (2.62%–2.95%, no. 6, 10, 13, 14, and 26) and (3.68%–3.98%, no. 9, 12, 23, 25, and 28). It clearly shows a linear increasing maximum slip value with stirrup corrosion rate for the first groups of specimens, and the slope also increases rapidly with load force levels. For the second group, there is also an increasing tendency for the maximum slip value with stirrup corrosion rate; however, the maximum slip is much smaller and more scattered than that of the first group. The reason might be due to the fact that the second group has higher rebar corrosion rate and thus gives higher restriction to bond-slip as stated above. Another reason might be due to the fact that the stirrup corrosion rate of the second group is more scattered than that of the first group. It could be confirmed that both rebar and stirrup corrosion had significant influence on the maximum slip. The above finding is interesting as slight rebar corrosion could increase the cyclic bond performance; on the contrary, stirrup corrosion would decrease the cyclic bond performance; this seems to be contradiction evidence. However, it is found that most of the corroded specimens have corrosion crack opening due to stirrup corrosion (Table 1), and actually, the maximum slip was the smallest for the specimens without crack opening as shown in Figure 7(b) and (c). The following addresses this point from the view of crack opening.
Effects of crack opening
Figure 8 shows the maximum slip versus maximum crack width for different cyclic loading force. It can be found that the maximum slips are only slightly changed as stirrup corrosion level increases for the first ±24 kN loading force level. As loading force and cycle number increases, although the points are more scattered than those of Figure 7(a), it still can be found that there is an increasing tendency of maximum slip value as crack width increases for each loading cycle forces. It should be noted that wider corrosion crack means that the crack penetrates deeper into concrete, which would inevitably reduce the confinement and thus reduce bonding performance. Similar results of maximum slip versus total crack length could also be derived and were not further shown in this article.

Maximum slip versus maximum crack width for different cyclic loading forces.
It should be noted that the crack opening is related to stirrup corrosion level (Figure 4). The above phenomena shows the complexity of relationship between reinforcement corrosion and corrosion crack opening on bond performance, and the detailed mechanism of the degradation of bond performance by rebar corrosion, stirrup corrosion, and crack opening still needs further investigation.
Energy dissipation
The energy dissipation in one cycle of loading could be derived by calculating the area of hysteresis loop of force–slip curve. Figure 9(a) shows energy dissipation for the first and ninth loops (corresponding to the first ±24 kN and the last ±48 kN loading force cycles) with different rebar corrosion levels. For the first cycle, the energy dissipation of different rebar corrosion levels is almost the same. For the ninth cycle (Figure 9(b)), the difference in energy dissipation between rebar corrosion levels is not so obvious, and the points are scattered. However, more points corresponding to rebar corrosion between 3% and 5% are observed with energy dissipation lower than others.

Energy dissipation versus reinforcement corrosion level: (a) rebar, (b) stirrup (all specimens), and (c) stirrup (two groups of specimens).
Figure 9(b) shows energy dissipation for the first and ninth loops (corresponding to the first ±24 kN and the last ±48 kN loading force cycles) with different stirrup corrosion levels. It clearly shows that the energy dissipation of different stirrup corrosion levels is almost the same for ±24 kN force level. However, the energy dissipation shows an increasing tendency as the stirrup corrosion level increases for the ±48 kN force level. To further assess the combined effects of both rebar and stirrup corrosion, Figure 9(c) gives the energy dissipation versus stirrup corrosion level by the above two groups of specimens. It clearly shows a similar phenomenon observed in Figure 7(c) and confirmed that both rebar and stirrup corrosion had significant influence on the energy dissipation.
It should be noted that the energy dissipation in one cycle is related to the damping capacity of structures. The above-observed phenomena may verify the observed test results that the corroded reinforced concrete members have higher damping than that of un-corroded when loading force increases as stirrup is more vulnerable to corrosion. 18
Unloading stiffness
The unloading stiffness is defined as

where
Figure 10(a) shows the corresponding unloading stiffness of each cycle for no. 2, no. 7, and no. 10 specimens. Figure 10(a) shows that there are only slight differences of the forward and reversed unloading stiffness for a specimen. It also clearly shows a decreasing tendency of unloading stiffness as the loading cycles increase. However, the unloading stiffness does not decrease monotonously, especially when the loading force level changes (cycle no. 7 and no. 4). The unloading stiffness of specimen no. 2 is obviously larger than that of specimen no. 7 and no. 10. It should be noted that the stirrup corrosion rate of specimen no. 2 (4.97%) is the smallest among the three specimens, and the stirrup corrosion rate of specimen no. 7 (9.05%) is obviously smaller than that of no. 10 (11.93%). However, there is only slight difference between the unloading stiffness of specimen no. 7 and no. 10. Further study shows that the maximum crack width and total crack length of specimen no. 7 and no. 10 are nearly the same, and this will be discussed in the following.

Unloading stiffness versus cycle number: (a) specimen no. 2, no. 7, and no. 10; and (b) specimen no. 1, no. 2, and no. 8.
Figure 10(b) shows the forward unloading stiffness of specimen no. 1, no. 2, and no. 8. The three specimens have the rebar corrosion rate from 0.30% to 5.57% and nearly the same stirrup corrosion level (Table 1). The reversed unloading stiffness is very close to forward unloading stiffness and is not shown here. It clearly shows that the unloading stiffness of specimen no. 1 is obviously larger than that of specimen no. 2, no. 8, no. 7, and no. 10. Here, the specimen no. 1 is one of the specimens that has no crack opening; and the stirrup corrosion rate of specimen no. 1 (3.77%) is the smallest among the five specimens. The rebar corrosion rate of specimen no. 2 (1.1%) is obviously smaller than that of no. 8 (5.57%). However, there is only slight difference between the unloading stiffness of specimen no. 2 and no 8. It should be noted that although the rebar corrosion rate of specimen no. 2 is smaller than that of specimen no. 8, the maximum crack width and total crack length of specimen no 2 are a bit larger than that of specimen no. 8. The above analysis also shows a complex relation of the bond performance between the reinforcement corrosion rate and crack opening as discussed above.
Conclusion
This article reported a preliminary study of reinforcement corrosion effects on bond performance under force controlled cyclic loading. It is found that
Stirrup corrosion will reduce the confinement on the concrete and thus degrade bond performance; however, slight rebar corrosion seems to increase the bond performance;
Maximum crack width and total crack length are strongly related to stirrup corrosion level for this test. It is also confirmed that there are also strong relevance of crack opening to degradation of bond performance;
Bond performance degraded more severely when cyclic loading amplitude becomes large for members with highly corroded stirrups;
When the cyclic loading force is relatively small, the energy dissipation shows little difference for the specimens with different reinforcement corrosion rate. However, the energy dissipation increases rapidly when stirrup corrosion increases as cyclic loading force becomes large;
Unloading stiffness degraded more severely for specimens with crack opening.
This preliminary study suggested the importance and complexity of reinforcement corrosion to bond performance under cyclic loading. Both stirrup and rebar corrosion would have significant effects on bond performance, and crack opening, which is related to the reinforcement corrosion in nature, also has effects on bond performance. And further investigation to quantify these effects will be carried out in the near future.
Footnotes
Declaration of conflicting interests
The authors declare that there is no conflict of interest.
Funding
The work described in this article was financially supported by the Ministry of Science and Technology for the 973-project (no. 2011CB013604), the National Natural Science Foundation of China (grant nos 51378313, 51378314), the Education Department of Guangdong Province (grant no. 2013KJCX0157), and the Science and Creativity Committee of Shenzhen (grant no. JCYJ20120614085454232), to which the writers are grateful.