
Abstract
To enhance ride comfort and safety in autonomous vehicles, a suspension control strategy based on multi-sensor information fusion is proposed. A multi-sensor processing system integrates light detection and ranging (LiDAR) and cameras, utilizing point cloud clustering, segmentation techniques, and the You Only Look Once version 7 (YOLOv7)-tiny algorithm to analyze the geometric characteristics and spatial positions of road obstacles. The chain code method is applied to calculate obstacle areas. A vibration model is established to describe the relationship between road roughness and vehicle vibrations, followed by the development of an optimal damping ratio model for intelligent suspension control. A fuzzy neural network algorithm is employed to pre-adjust suspension damping based on obstacle characteristics and vehicle speed, enabling proactive adaptation to road irregularities. If an obstacle exceeds a predefined threshold, the system automatically reduces vehicle speed to further enhance safety and ride comfort. Experimental validation demonstrated that for potholes of 0.5 m2 with depths of 0.06, 0.08, and 0.10 m, vertical vibration acceleration was reduced by 11.4%, 12.8%, and 15.9%, respectively. These results confirm the effectiveness of the proposed approach in improving ride quality and vehicle stability.
Introduction
The current safety models for autonomous vehicles are primarily focused on active collision avoidance and path trajectory planning in structured road environments based on driving risk identification.1–3 In these studies, target detection and dynamic tracking mainly concentrate on medium- and large-sized obstacles such as vehicles, pedestrians, bicycles, and buildings.4–8 Subsequently, emergency braking or steering maneuvers are implemented based on obstacle distance and vehicle speed to mitigate driving risks. However, there is a lack of attention to small obstacles such as gravel, vehicle debris, and other minor road hazards. When driverless vehicles travel at high speed on roads that are damaged or feature small obstacles (such as gravel, potholes, or speed bumps), the damping of their suspension is affected. Moreover, even if a vehicle has no driver or does not have a system that can adjust its speed, the wheel jump it undergoes on such roads substantially decreases its safety and ride comfort.
To improve the ride smoothness and safety of autonomous vehicles, scholars have conducted extensive research. The development of intelligent suspension systems for autonomous vehicles (AVs) is progressing towards a new stage characterized by the deep integration of “perception-decision-actuation-learning” closed-loop control. Deep reinforcement learning (DRL)-based active suspension algorithms have emerged as a significant research focus. Wang et al. 9 proposed a deterministic experience tracing–TD3 architecture, which reuses deterministic experiences while preserving policy exploration capability, achieving an 18% reduction in vertical acceleration. Qian et al. 10 incorporated road preview information into the twin-delayed DDPG algorithm, resulting in a 22% decrease in impact energy when traversing speed bumps at 30 km/h. Deng et al. 11 explicitly embedded physical safety constraints within the TD3–PSC framework, guaranteeing that the spring mass travel remains within mechanical hard limits, thereby addressing critical safety concerns for real-world deployment. Semi-active solutions utilizing magnetorheological (MR) dampers continue to enhance trajectory tracking performance. Feng et al. 12 demonstrated through hardware-in-the-loop (HIL) testing that MR suspension reduces lateral tracking error by 14% during high-speed double lane change maneuvers. The same research group 13 further employed an MPC–MR coupled control strategy, successfully suppressing yaw rate overshoot to within 1.2°/s during slalom tests at 80 km/h. Li et al. 14 combined explicit model predictive control (e-MPC) with MR suspension, utilizing road elevation maps generated from forward-looking LiDAR point clouds for 0.8-s preview control. This approach achieved a 29% reduction in the RMS value of vertical acceleration for off-road vehicles traversing random rock-covered terrain. Posture stabilization control for complex terrains has seen notable progress. Zhang et al. 15 proposed a “body posture-wheel load distribution-active suspension” co-optimization strategy for multi-axle unmanned vehicles. Utilizing terrain geometry as input, the strategy dynamically plans target vertical forces for each wheel, tracked in real-time by active hydro-pneumatic suspensions. This method effectively limited the roll angle to 2.8° under 30% grade cross-axle conditions. Besir et al. 16 designed a real-time leveling algorithm for active hydro-pneumatic suspension on a 6 × 6 electric unmanned ground vehicle (UGV), capable of compensating roll angles up to 3° within 0.4 s. Novel paradigms for road information acquisition and utilization are emerging. Inoue et al. 17 developed an RGB image-point cloud interpolation network capable of generating high-precision 20-m road profiles within 10 ms, providing a low-cost perception alternative for preview suspension systems. Surana and Delmage 18 mapped real-time perceived road quality directly to optimal suspension damping coefficients while simultaneously optimizing global routing paths, achieving a dual-objective trade-off between energy consumption and ride comfort. Chen et al. 19 employed a multi-head attention model to predict ride comfort levels 3 s in advance using only road grade and curvature information, achieving a prediction accuracy of 92%. Design for long-term reliability is receiving increased attention. Lv et al. 20 pioneered the integration of suspension aging models into vehicle stability controllers. By employing unscented Kalman filter (UKF) for real-time estimation of damping attenuation coefficients, the system’s ability to suppress lateral wind disturbances decreased by only 5% after 100,000 km of operation. Shaqarin and Noack 21 embedded control Lyapunov functions (CLF) and control barrier functions (CBF) within a quadratic programming (QP) framework, ensuring the mechanical safety of nonlinear suspension systems under parameter perturbations. Breakthroughs in energy harvesting and novel actuators have also been achieved. Mastouri et al. 22 proposed a hybrid piezoelectric–magnetoelectric energy-harvesting suspension system capable of continuously outputting 42 W of power on class C roads, offering a potential self-powered solution for suspension electronic control units (ECUs). de Hoyos Fernández de Córdova et al. 23 implemented a non-invasive identification method for key suspension parameters using synthetic data and Bayesian inference, achieving an error rate below 3%. This approach provides a robust data foundation for large-scale vehicle health monitoring.
Innovative suspension approaches demonstrate significant advances beyond conventional methods. Farah et al.’s CRONE framework24–26 combines fractional calculus with skyhook/ground hook strategies, achieving 40% better vibration attenuation (0–20 Hz) and 32% reduced tire dynamic load on gravel. Hybrid controllers include Mac et al.’s hedge–algebra system 27 (40% fewer fuzzy rules, 26% lower body acceleration) and Xie et al.’s fuzzy–CNN solution (35% resonance suppression). Li et al. 28 optimized sliding mode control via African Vultures algorithm (2.3× faster convergence, 61% less chattering). Structurally, Singh et al.’s DRL-controlled five-bar suspension 29 increased wheel travel by 15% and roll stiffness by 50%, while Schmitz’s steerable five-link design 30 achieved 45° steering angle (22% agility gain). Llontop et al.’s Rocker–Bogie system 31 boosted off-road traversability by 37%. System-level innovations feature Bai et al.’s SOTIF safety model 32 (32 failure scenarios quantified), Šabanovič et al.’s virtual sensors 33 (5% force estimation error, 40% cost reduction), and Chiu et al.’s energy harvester 34 (18 J/km recovered from speed bumps). These collectively advance suspension technology across domains.
The above-described methods effectively alleviate vibration and impact forces in automobiles and thereby improve ride comfort. However, current vibration control systems predominantly rely on accelerometer-based feedback mechanisms, where suspension damping is adjusted reactively based on vibration data from acceleration sensors combined with other vehicle parameters. These conventional approaches operate in a “vibration-first, then-adjustment” mode, inevitably resulting in significant initial vibration transients and impact forces whose peak magnitudes are highly dependent on road conditions.
This reactive control paradigm presents critical operational challenges: When vehicles equipped with such systems encounter occasional road irregularities (bumps/potholes) or traverse unstructured road surfaces, the inherent system latency often leads to wheel hop phenomena and substantial degradation in ride comfort. The situation becomes particularly dangerous for autonomous vehicles operating without driver intervention—at high speeds on uneven roads, these systems may fail to prevent excessive impacts and vibrations, potentially leading to hazardous conditions including severe deviation, tail spin, and other uncontrollable dynamic instabilities that could trigger serious accidents. To fundamentally address these limitations, our proposed multi-sensor-based predictive vibration control framework for autonomous vehicle suspensions bridges three critical research gaps in current technologies: (1) The absence of proactive vibration mitigation capabilities in conventional reactive control systems. (2) The lack of road preview functionality in existing accelerometer-dependent approaches. (3) Inadequate adaptation to extreme or rapidly changing road conditions in current architectures.
This study presents a comprehensive vibration control framework for autonomous vehicles through three key innovations: First, we developed a novel vibration model that quantitatively correlates road obstacle characteristics with induced vibration levels, establishing the theoretical foundation for proactive control. Second, we designed a multi-sensor fusion system combining LiDAR point cloud analysis with YOLOv7-tiny based visual detection and chain code algorithms, enabling precise real-time mapping of road irregularities (achieving 2 cm resolution for obstacles as small as 0.5 m2). Third, we proposed a fuzzy neural network-based control architecture that dynamically optimizes suspension parameters based on obstacle dimensions and vehicle speed. The integrated solution features a unique safety mechanism that automatically reduces vehicle speed when encountering obstacles exceeding predefined thresholds, combining proactive damping adjustment with speed regulation. Experimental validation under standard test conditions confirmed the system’s superior performance over conventional suspensions, demonstrating a 27.7% reduction in RMS acceleration on washboard roads and a 15.9% decrease in peak vibration acceleration under road-damage scenarios.
Suspension model
In order to theoretically judge the feasibility of this method and provide control parameters for the computer adjusted damping of the suspension module, it is necessary to establish a quarter suspension model based on multi-sensor information fusion to reveal the relationship between road roughness and vehicle pre vibration momentum. The vehicle suspension vibration model under multi-sensor information fusion is shown in Figure 1.
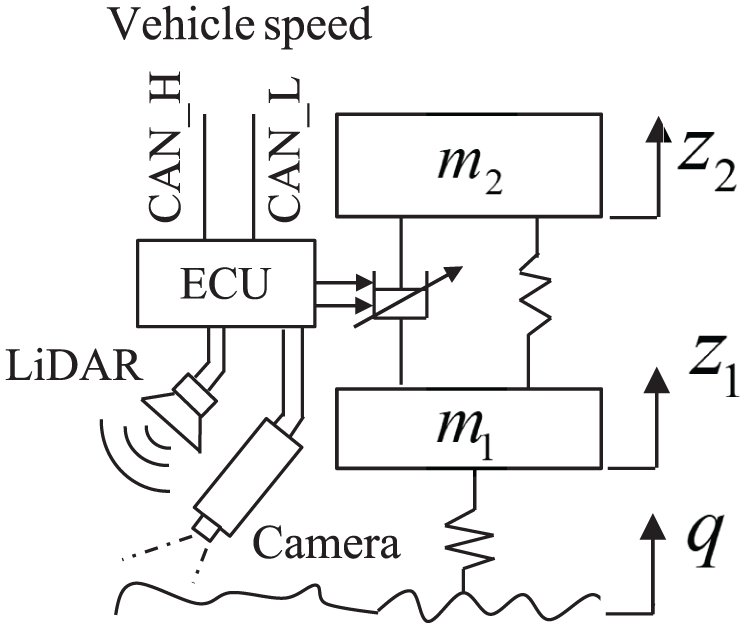
Vibration model of automotive intelligent suspension.
In Figure 1, m1 is the suspension unsupported mass (unsprung mass); m2 is the suspension support mass (sprung mass); K is the spring stiffness of shock absorber; C, the variable damping coefficient of the shock absorber, is dynamically adjusted by modulating hydraulic resistance through a motor-actuated bypass valve; K1 is the stiffness of the tire; q is the input road roughness function; z1 is the vertical displacement of tire; z2 is the vertical displacement of the vehicle body. According to Newton’s second law and the force relationship of the suspension model in Figure 1, the differential vibration equation of the suspension with two degrees of freedom is established:

Substitute the complex amplitude into equation (1) or perform Fourier transform on it to obtain equation (2):
In order to facilitate the solution, equation (2) is further treated, assuming that:


Substituting equations (3) to (5) into equation (2), we can get:


Calculate the frequency response function of according to equations (6) and (7):

Calculate the modulus of equation (8) to obtain the amplitude frequency characteristic of:

In equation (9), η is the stiffness ratio,
Similarly, the frequency response function of


It can be seen from equations (8) to (11) that the vibration of the corresponding vehicle body and wheel can be calculated when the input of road roughness is known. If the road roughness input value is detected in advance, the vehicle body vibration can be predicted. According to the multi-sensor information fusion technology in Figure 1, the road conditions in front of the vehicle can be accurately detected in advance, and the data can be input into the suspension computer to calculate the body pre vibration momentum. The semi-active suspension damping is controlled in advance according to the pre vibration momentum, so that the vehicle suspension damping can adapt to the road vibration input in advance. Therefore, the perception and input of road condition is the foundation and one of the key links of the system.
Multi-sensor fusion detection technology
Accurate detection of obstacles is fundamental to the intelligent suspension control of autonomous vehicles, as well as a critical guarantee for their safe operation. By adopting multi-sensor fusion technology, combining LiDAR and cameras, the accuracy and reliability of the data can be enhanced. Local road surface damages, such as potholes and bumps (including gravel and abandoned objects), are common types of road defects that significantly affect vehicle safety and comfort. The multi-sensor fusion approach is used to extract key features of road depressions and protrusions, including contour and area calculations of damaged road surfaces based on visual images, and depth calculation of potholes based on single-point distance measurements from LiDAR.
LiDAR detection
When LiDAR acquires a single-frame scene, obstacles, or depressions are typically regarded as objects moving at a constant speed. Therefore, the point cloud contour features obtained through LiDAR scanning are more precise. 35 The data acquired by LiDAR essentially consists of a set of isolated scan points, forming a point cloud. To effectively analyze and extract the contour features of the target, clustering and segmentation of these 3D point cloud data are required. The flow of the point cloud clustering and segmentation algorithm is illustrated in Figure 2(b).

Point cloud clustering and segmentation algorithm: (a) grid map and center point P and (b) point cloud clustering and segmentation algorithm process.
In raster diagram (Figure 2(a)), starting with point P (x, y) as the initial clustering center, a row-wise or column-wise scanning process is performed within the predefined clustering range. The distance between the adjacent raster point Pi and the clustering center is calculated. If this distance is less than the specified clustering threshold, point Pi is considered to belong to the same cluster as point P. Pi is then designated as the new clustering center, and the search for neighboring raster points continues. If the distance exceeds the clustering threshold, Pi is regarded as part of a new cluster boundary, and the clustering process is restarted around that point. This iterative process continues until all points in the raster diagram are traversed, and the clustering analysis is complete. The clustering results are subsequently refined based on the actual characteristics of the regions. Specifically, for small-scale cluster boundaries, clusters containing fewer points or an insufficient number of points in any specific row or column (below a predefined minimum threshold) are deemed insignificant and excluded. Additionally, the difference in distance between the farthest two points within each cluster boundary in the horizontal or vertical direction is computed to determine whether the cluster meets the size criteria of the region of interest. Finally, the geometric center of each cluster is identified.

where, Pctr and Nall represent the center position of each cluster and all points within the cluster, respectively, i, j ∈ {1,2,…,N}. n
ij
refers to adjacent raster points encountered during row-wise or column-wise scanning.
After clustering and segmenting point cloud data on the raster map, different obstacles form unique contours. By analyzing the features of the clustered contours, such as size and height differences, the detection of road surface potholes or protruding obstacles can be achieved. The corresponding mathematical description can be expressed using the following equations (14) to (17).


By analyzing the relevant attributes of the clustered contours, such as the size of the contour (N k ), the lateral offset distance of the cluster center relative to the vehicle (D), the aspect ratio of the contour (R), and the height difference (ΔZ), clusters that meet specific criteria can be identified. Maximum/minimum height (Zmax/Zmin). This enables the recognition of the geometric features of obstacle regions. Xmax and Xmin denote the maximum and minimum values along the x-axis, while Ymax and Ymin correspond to the y-axis.
Taking the model of a LiDAR measuring road surface potholes as an example, the method for detecting obstacle protrusion heights and pothole depths is illustrated, as shown in Figure 3.

LiDAR measurement geometric model of potholes.
The LiDAR is installed at point Q on the front of the vehicle with a pitch angle of γ. Let Q1 and Q2 represent the same position point passed by the vehicle at different times. Then, Q1Q2 is a horizontal line segment, and Q1Q2JM forms a parallelogram. 36 Consequently, Q1M = Q2J.
When the vehicle travels on a flat road, the distance from the LiDAR’s single-point laser to the road surface remains constant. However, when a pothole appears on the road surface, the distance between the laser point and the bottom of the pothole suddenly increases. The measured distance within the pothole is l1, and the values of l1 and l0 can be directly obtained through LiDAR data acquisition. In the right triangle △JGW, JG = Q2G − Q1M = l1 − l0. Thus, the depth H2 of the road surface pothole can be expressed by the following formula.

Image processing detection
To enhance the accuracy of target detection by the camera while reducing the computational load and memory usage of the model, thereby accelerating detection speed to meet the requirements of high-speed vehicle operation, the YOLOv7-tiny algorithm is adopted for fast target recognition and localization. 37 The YOLOv7-tiny architecture consists of an input layer, a backbone for feature extraction, a neck for feature fusion, and a head for output, as illustrated in Figure 4.
YOLOv7-tiny architecture diagram.
In the input layer, YOLOv7-tiny inherits the preprocessing techniques of YOLOv5, using adaptive image cropping to preprocess images and standardize their dimensions to 640 × 640 pixels to meet the requirements of the feature extraction layer. The feature extraction layer consists of multiple convolutional block with batch normalization and leaky rectified linear unit (CBL) convolutional layers, a simplified efficient layer aggregation network (ELAN) structure, and max pooling (MP) layers. The CBL convolutional layer includes 2D convolutional layer, batch normalization (BN), and leaky rectified linear unit (LeakyReLU), aiming to extract features from the raw data.
The simplified ELAN structure is a streamlined version of the ELAN structure in the original YOLOv7, reducing the number of CBL layers from 7 to 5. As an efficient aggregation network, the ELAN structure establishes multiple short connections between input and output, effectively preventing information loss or distortion during multi-layer propagation and enhancing the network’s depth and accuracy. By adjusting the shortest and longest gradient paths, the simplified ELAN enables the network to learn richer features, improving the model’s robustness. 38
In the MP layer, YOLOv7-tiny abandons convolution operations and utilizes pooling down-sampling for feature concatenation to integrate features from different levels. In the feature fusion layer, YOLOv7-tiny continues to use the PAFPN structure from YOLOv5, comprising multiple CBL convolutional layers, a simplified SPPCSPC, and the simplified ELAN. The three feature extraction layers are positioned at the middle, lower-middle, and bottom sections of the backbone to extract features at different scales.
SPPCSPC is a specialized spatial pyramid pooling (SPP) structure containing a cross stage partial (CSP) module that optimizes feature extraction through a large residual connection, effectively expanding the receptive field. The simplified SPPCSPC reduces the number of CBL layers compared to the original structure.
In the output layer, YOLOv7-tiny employs the re-parameterizable visual geometry group (RepVGG) network and incorporates model re-parameterization techniques in parts of its architecture. This approach reduces the number of parameters without compromising model performance, enhancing the computational speed of the network. 39
After extracting the contour features of the damaged road surface area from the image, the area of the damaged region is calculated using the chain code method. The chain code is a technique used to describe a curve or boundary by encoding the direction of boundary points starting from a reference point. 40 Figure 5(a) illustrates the eight-direction chain code method. Initially, a starting point is selected, and the encoding is performed in a counterclockwise direction. The numerical values in the eight-direction chain code represent the directions of the boundary line, as shown in Figure 5(b). The chain code of the curve is 57670013234.

Chain code representation of damaged area diagram: (a) eight-directional chain code and (b) chain code curve expresses damaged area.
In the analysis of edge tracking and area calculation for road surface potholes, the chain code method is commonly employed to convert the edge features of binary images into an ordered sequence of points. This method begins by labeling the edge pixels in a counterclockwise direction until returning to the starting point, thereby determining the total number of boundary pixels, denoted as A1. Next, the forward vector (fv) and the backward vector (bv) are defined to transform the pothole boundary points into vector form. The forward vector represents the vector path from the previous boundary point to the current point, while the backward vector indicates the vector path from the current point to the next boundary point. The direction of these vectors is determined based on the eight-direction chain code, with the current boundary point serving as the central pixel. The pothole boundary points are then reordered in a top-to-bottom and left-to-right manner.
Subsequently, the area of the pothole is calculated by counting the total number of pixels, denoted as A2, within the boundary. This area calculation involves summing the number of pixels between adjacent boundary points, which can be expressed as Ni + 1 − N i − 1, where N i is the column value of the current boundary point, and Ni + 1 is the column value of the next boundary point, provided that equation (19) holds.

The current boundary point is defined as an interior boundary point, and the final area of the road surface protrusion or pothole is obtained as:

In equation (20), S0 represents the area, and u denotes the pixel equivalent. Thus, the area of the damaged (or protruding) road surface is determined.
Intelligent suspension vibration control strategy
When a road obstacle (or pothole) is located under the wheels and is deemed passable, it is necessary to consider the ride comfort and vibration characteristics of the autonomous vehicle. Yu 41 has provided an intelligent suspension control method for autonomous vehicles. If the vehicle is capable of overcoming the target obstacle, a damper damping control strategy is established based on information such as vehicle speed and road roughness. This strategy presets and regulates the damping in advance, allowing the damping to adapt to different road conditions beforehand. Unlike traditional active suspension systems, which operate on a “vibrate first, then adjust damping” principle, the intelligent suspension control strategy of this system follows a “adjust damping first, then vibrate” approach. By pre-adjusting the damping according to road conditions, the suspension’s vibrations can be effectively reduced.
However, in designing an autonomous suspension automatic control strategy, it is essential to balance both the ride comfort index of suspension vibrations and the impact of sudden obstacles on suspension and vehicle safety performance (as encountering obstacles without human intervention may cause significant vibrations).
By establishing an optimal damping ratio mathematical model, the control methods for semi-active suspension comfort and safety in autonomous vehicles are analyzed. According to suspension vibration theory and relevant studies,37,38 the optimal damping ratio for both comfort and safety can be determined.

Where

Where,
According to equations (21) and (22), it can be known that the optimum damping ratio for suspension comfort and safety affect and restrict each other. Therefore, in order to give consideration to the requirements of vehicle safety and comfort, it is necessary to balance and match the two. The damping ratio after matching is called the comprehensive optimal damping ratio, which is represented by ζoptimum. The value taking method is:
When ζoptimum≤ζcomfortable, then ζoptimum = ζcomfortable 42 ;
When ζoptimum≥ζsecurity, then ζoptimum = ζsecurity;
When ζcomfortable < ζoptimum < ζsecurity, use the following fuzzy neural network method to determine (Figures 6 and 7).

Neural network diagram.

Optimal damping ratio control surface diagram.
Based on the research in Šabanovič et al., 33 the intelligent suspension control strategy is optimized. A fuzzy neural network control algorithm based on radial basis function (RBF) network is used to control the damper damping. Let the damper’s damping be the control target parameter CC, and the controlled object is the motor control signal of the electro-hydraulic continuous damping control damper (continuous damping control (CDC)). A fuzzy control system based on target temperature is established, and its fuzzy control rules are determined. The equation characterizing C is established as follows:

In this case,
Figure 6 is a three-layer neural network diagram, where the neurons in different layers are interconnected by weight coefficients. The input variables x1, x2, and x3 correspond to the area of the road obstacles or potholes, sprung mass, and speed, respectively. The hidden layer is set with four neurons, and the output parameter is CF. Then, the backpropagation (BP) method is used to adjust the connection weights of the network.
In the fuzzy controller design, the fuzzy domain values for CF are taken as (0, 1.2), the fuzzy domain values for road elevation are (−0.6, 0.6), and the fuzzy domain values for the control objective are (0, 1.2). The fuzzy subsets for all three variables are: (PB (positive large), PS (positive small), Z (zero), NS (negative small), NB (negative large)). A fuzzy rule table is formulated to determine the control surface. Figure 7 shows the control surface plot of the optimal damping ratio. In the plot, the inputs are CF and road elevation, where positive values represent the height of road protrusions, and negative values represent the depth of road potholes. As the positive and negative road values increase, the optimal damping ratio also gradually increases, until it reaches the maximum safety optimal damping ratio. This is due to the vehicle safety considerations to prevent the vehicle from bouncing. Vehicle speed and load also affect the optimal damping ratio to some extent.
The system generates a fundamental vibration control signal based on obstacle dimension data and vehicle load information, then adjusts this baseline control signal according to vehicle speed. The CF is the damper’s baseline damping adjustment parameter, calculated via the Neural Network Diagram method using inputs such as obstacle/pothole area, sprung mass, and vehicle speed. Subsequently, a fuzzy control algorithm determines the optimal damping ratio by synthesizing the geometric characteristics of road obstacles/potholes with the CF value, ultimately controlling the damper motor. The process is illustrated in Figure 8.

Block diagram of the system control principle.
Intelligent suspension adopts continuous damping control, in which a motor control rod is rotated by a certain angle to change the flow area of the inner- and outer-chamber throttle holes, thereby achieving stepless changes in damping magnitude. The controller calculates the optimal suspension damping ratio using the CF and obstacle geometry, then outputs it as a base control voltage signal. The basic voltage is compared with (i.e. subtracted from) the input voltage of the feedback controller to obtain a deviation voltage signal. This deviation voltage signal is amplified to control the motor angle and drive the reduction gear pair to rotate, which causes the control rod to rotate, thereby adjusting the flow area of the damper orifice. A block diagram of the system control principle is shown in Figure 8.
In Figure 8,
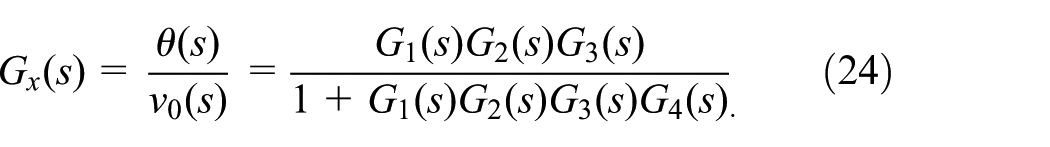
where θ is the rotation angle of the motor shaft.
The overall control flow is illustrated in Figure 9. Road potholes and obstacles are first detected via multi-sensor information fusion technology. Subsequently, based on pothole/obstacle area, vehicle speed, and sprung mass, a core parameter characterizing vibration state—the comfort factor (CF)—is generated using a neural network control algorithm. Following this, the target damping coefficient

Control logic flowchart for the intelligent suspension system.
Test results and discussion
Road tests are to be conducted on autonomous vehicles equipped with smart suspension under typical vertical operating conditions. The sample vehicle is a self-made driverless electric vehicle. Parameters of the sample vehicle: the unsupported mass m1 of the suspension is 42 kg; The suspension support mass m2 is 254 kg; The spring stiffness K1 of the suspension is 18 kN/m; The stiffness K of tire is 2261 kN/m. The test sample vehicle is shown in Figure 9.
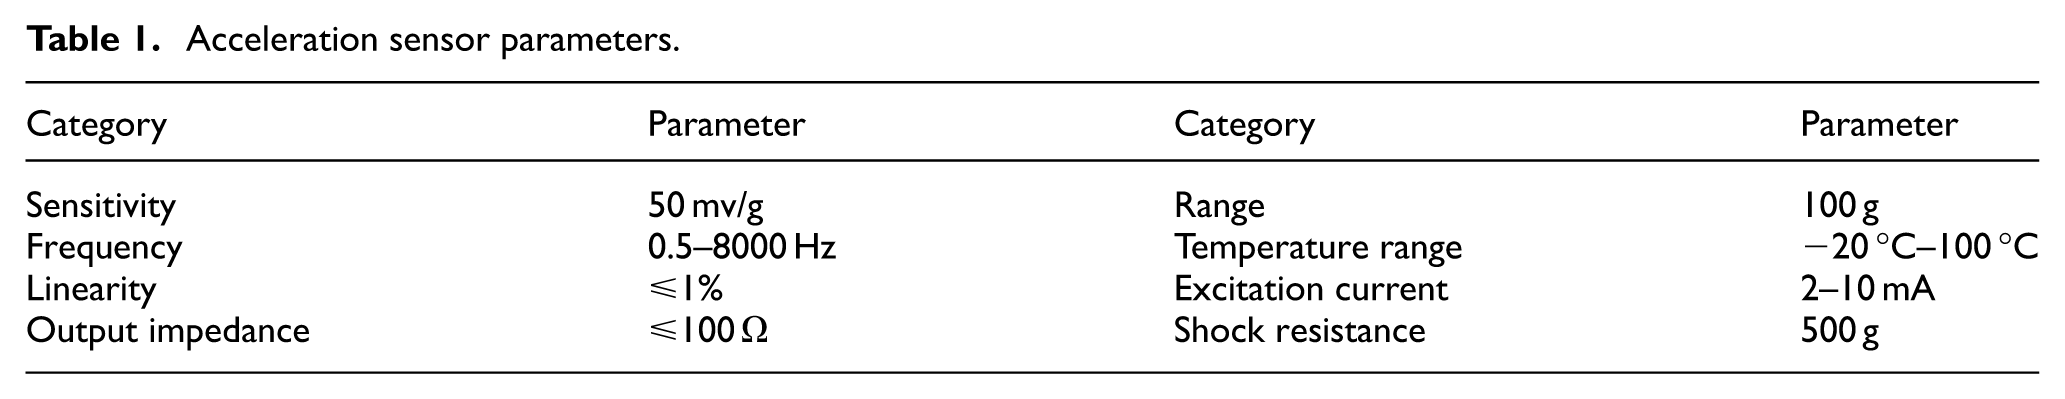
Figure 10 shows the suspension test sample vehicle equipped with multi-sensor control. The millimeter wave radar and marking camera are used for the control of the semi-active suspension of the vehicle. Laser radar and other cameras are used to identify pedestrians, vehicles, and road markings, which will not be repeated here. The CT1005LC acceleration sensor is used to collect the vertical movement of the vehicle body. The equipment parameters are shown in Table 1.

Test vehicle with multi-sensor intelligent suspension.
Acceleration sensor parameters.
The vibration control performance of the Intelligent Suspension (IS) was further evaluated through time-frequency vibration tests under stochastic road excitations, with comparative analysis against three benchmark controllers:
Rule-based controllers (represented by skyhook control (SC), alongside on–off/ground hook/hybrid variants).
Model-based controllers (exemplified by linear quadratic regulator (LQR), extending to LQG and MPC methodologies).
Passive suspension (PS) as the market-dominant baseline.
The vehicle travels on a B-class road at a constant speed of 30 km/h, and its body vibration acceleration, tire dynamic formation, and suspension dynamic formation with each type suspension are recorded and compared. The test results are shown in Figures 11 to 14. Finally, the vibration performance of the vehicle was tested. ACC denotes vertical vibration acceleration. DTS denotes dynamic travel of suspension. DDT denotes dynamic deflection of tire.

Comparison of vehicle body vertical vibration acceleration on B-class road.

Comparison of suspension deformation on B-class road.

Comparison of tire dynamic deformation on B-class road.

Power spectral density plot of acceleration on B-class road.
Four sets of data were measured, including:
Comparison of time domain response of vehicle body vertical vibration acceleration on B-level road surface.
Comparison of suspension dynamic deformation on B-class road surface.
Comparison of tire dynamic deformation on B-class road surface.
Power spectral density (PSD) comparison of vehicle body acceleration on B-class road surface.
As shown in Figure 11, on a class B road surface, the vibration peak of the intelligent suspension in autonomous vehicles is reduced by 5.9%, 6.3%, and 8.3% compared to the LQR, skyhook control, and passive suspensions, respectively. In Figure 12, the peak value of suspension dynamic deformation is reduced by 6.1%, 7.8%, and 9.2% for the intelligent suspension compared to the LQR, skyhook control, and passive suspensions, respectively. Regarding tire dynamic deformation (Figure 13), the intelligent suspension reduces the peak value by 6.3%, 7.3%, and 9.4% compared to the LQR, skyhook control, and passive suspensions, respectively. This indicates that the intelligent suspension can detect road conditions in advance and adjust to the optimal damping setting, effectively reducing vibrations.
Figure 14 shows the power spectral density (PSD) plot of acceleration. Classical vibration theory indicates that frequencies between 4.0 and 12.5 Hz have the most significant impact on human vibration perception. Comparative analysis of this critical frequency range in Figure 14 demonstrates that the smart suspension system exhibits substantially lower power spectrum gain values than the LQR, skyhook control, and passive suspensions systems, confirming its remarkable vibration mitigation performance.
To further analyze the vibration characteristics of each suspension system, key metrics—including root mean square (RMS) acceleration, integral squared error (ISE), and integral absolute error (IAE)—were rigorously benchmarked. The comparative results are comprehensively presented in Figure 15.

Comparative analysis of suspension performance metrics: RMS acceleration versus IAE versus ISE.
The intelligent suspension demonstrates superior vibration suppression performance, exhibiting the lowest RMS value of sprung mass acceleration. Compared to the LQR suspension, skyhook control suspension, and passive suspension, it achieves significant relative reductions of 23.4%, 24.0%, and 29.6%, respectively, validating the efficacy of its multi-sensor fusion control strategy under complex road excitations. The intelligent suspension IS exhibits an ISE of 16.25, significantly lower than the LQR suspension (25.74), SC suspension (26.36), and PS suspension (34.32). This demonstrates that its advanced control algorithm and sensor feedback—which dynamically adjust damping force in real-time—deliver superior vibration control effectiveness, substantially reducing vehicle oscillations and enhancing ride comfort. The intelligent suspension’s IAE (14.02) shows reductions of 25.7% against LQR suspension, 26.8% against SC suspension, and 31.6% against PS suspension, confirming its optimal vibration suppression performance. With the smallest accumulated error among all compared suspensions, it demonstrates superior technical capability in sustained vibration control and ride comfort enhancement.
The test vehicle traveled at a speed of 30 km/h over damaged road surfaces with the same area but different depths, recording the vertical vibration acceleration with considering the damaged road surface. Additionally, tests were conducted on vibration acceleration when driving over damaged road surfaces with the same depth but different areas. The results are depicted in Figures 16 to 19.

Acceleration on a 0.06 m deep surface (area 0.5 m2).

Acceleration on a 0.08 m deep surface (area 0.5 m2).

Acceleration on a 0.1 m deep surface (area 0.5 m2).

Comparison of acceleration through pits of different areas (with the same depth).
The test data (Figure 16) shows the intelligent suspension achieves the lowest peak vertical acceleration (1.45 m/s2) when traversing potholes (depth: 0.06 m, area: 0.5 m2), significantly outperforming the other three systems. Specifically, it demonstrates an ∼11.4% reduction compared to the LQR suspension, a 14.2% reduction compared to the SC suspension, and a substantial 18.1% reduction versus the passive suspension, proving the clear advantage of intelligent control algorithms in dampening impact vibrations and improving ride comfort.
Based on Figure 17 test results, the intelligent suspension achieves the lowest peak vertical acceleration (1.71 m/s2) when traversing potholes (depth: 0.06 m, area: 0.5 m2), significantly outperforming the other suspensions. Specifically, its acceleration is 12.8% lower than the LQR suspension (1.96 m/s2), 15.3% lower than the SC suspension (2.02 m/s2), and 19.5% lower than the passive suspension (2.12 m/s2), demonstrating its superior vibration isolation capability.
Figure 18 shows the comparison when the vehicle crosses a pothole with an area of 0.05 m2 and a depth of 0.10 m. The intelligent suspension demonstrates superior vibration control, achieving the lowest peak vertical acceleration (2.08 m/s2) when traversing potholes. Compared to other systems, it reduces acceleration by 15.9% versus the LQR suspension, 18.1% versus the SC suspension, and 22.3% versus the passive suspension, consistently proving its effectiveness in minimizing impact vibrations.
The analysis results indicate that the intelligent suspension system can detect road conditions in real-time and pre-adjust the damper damping based on the pothole’s geometric information, allowing the vehicle to adapt to road irregularities in advance. This significantly reduces peak acceleration values.
As pothole depth increases, the improvement rate also increases, while the number of aftershock peaks decreases, effectively enhancing the vehicle’s ride comfort and safety.
Figure 19 compares the peak vibration acceleration (PVA) when passing through potholes of different areas (0.2, 0.4, and 0.8 m2) while maintaining a fixed depth of 0.06 m. The yellow bars represent the maximum acceleration with the intelligent suspension considering road damage, while the blue bars represent the maximum acceleration with the passive suspension, which does not account for road damage. Therefore, in the Figure 19, we use DPAIS represents damaged pothole area passed by intelligent suspension. DPAPS represents damaged pothole area passed by passive suspension. VIRIS represents vibration improvement rate of intelligent suspension compared to passive suspension:
For a pothole area of 0.2 m2, the maximum acceleration considering road damage is 1.44 m/s2, while ignoring road damage, it is 1.47 m/s2, resulting in a 2.1% improvement.
For a pothole area of 0.4 m2, the maximum acceleration reduction when considering road damage is 5.38% compared to not considering it.
For a pothole area of 0.8 m2, the maximum acceleration reduction is 8.72% when considering road damage.
The analysis results indicate that the vibration acceleration improves as the vehicle passes over potholes of different areas. However, when the pothole area is relatively small, the improvement effect is limited.
Conclusion
Based on the establishment of a vehicle suspension vibration model, an intelligent suspension automatic control method for autonomous vehicles using multi-sensor information fusion in complex environments was studied. Full-vehicle road tests were conducted under typical vertical operating conditions, leading to the following conclusions:
The multi-sensor information fusion technology utilizes LiDAR point cloud clustering segmentation and the YOLOv7-tiny algorithm to analyze the geometric features and spatial positions of target obstacles. The chain code method is employed to calculate obstacle areas, enabling a reliable interpretation of road surface information.
The autonomous vehicle adjusts the suspension damping in advance based on pre-detected road surface information, vehicle speed, and other factors using a neural-fuzzy control algorithm. This approach balances ride comfort and driving safety.
Vibration tests on different suspension systems under typical operating conditions were analyzed. Under specific conditions, the peak vibration of the intelligent suspension was reduced by more than 15.9% compared to the traditional suspension, validating the accuracy of the mathematical model. This research provides a theoretical foundation and innovative methods for analyzing autonomous vehicle suspension control, offering engineering value for the development and design of autonomous vehicles.
While the current study demonstrates significant effectiveness in specific scenarios, its reliance on the perception accuracy of LiDAR and cameras may lead to sensor failure or degraded performance under extreme weather conditions (e.g. heavy rain, snow) or complex lighting. Additionally, the computational demands of YOLOv7-tiny and point cloud processing could impact the real-time responsiveness of the control system, particularly in high-speed scenarios. Therefore, future research should prioritize the development of deep learning-based sensor data compensation algorithms and computational optimization techniques (e.g. edge computing deployment, model quantization) to overcome these bottlenecks. Further improvements in system adaptability may also be achieved through vehicle-to-everything (V2X) collaboration and end-to-end learning approaches.
Footnotes
Handling Editor: Aarthy Esakkiappan
Funding
The authors disclosed receipt of the following financial support for the research, authorship, and/or publication of this article: This work was supported by Jiangsu Provincial Higher Education “Qinglan Project” Funding (grant no. 2023); Innovation and Entrepreneurship Project (grant no. CX2024G302); and Wuxi Institute of Technology Natural Science General Project (grant no. ZK202412).
Declaration of conflicting interests
The authors declared no potential conflicts of interest with respect to the research, authorship, and/or publication of this article.