
Abstract
Natural fiber-reinforced polymer composites are gaining attention in engineering industries due to their high strength-to-weight ratio and the wide availability of fibers. In this study, sisal fiber was selected for reinforcement in a polyester resin matrix. Fiber incorporation enhances mechanical properties, particularly tensile strength, but polymers exhibit viscoelastic behavior that can lead to failure under compression. Therefore, evaluating compressive strength is essential before practical application. The composite was fabricated using the hand lay-up method, with sisal fibers treated in sodium hydroxide to remove non-cellulosic materials. This treatment improved fiber–matrix adhesion and interfacial shear strength. Specimens were prepared and tested for compressive strength according to ASTM standards to assess their suitability for engineering use. To evaluate the compressive strength, three approaches were employed: analytical evaluation using classical lamination theory, simulation analysis using ANSYS software, and experimental testing. The fiber orientation was varied during testing to examine its effect on compressive behavior. The maximum ultimate compressive strength, breaking force, failure strain, and deflection were found to be 60.5 MPa, 20.17 kN, 7.2%, and 3.25%, respectively, for fiber orientations of (0°, 45°, 45°)3 and (45°, 90°, 90°)3.
Introduction
The increasing urgency to address environmental and ecological concerns has accelerated the search for sustainable and eco-friendly materials in engineering. Natural fiber-reinforced polymer composites have emerged as promising alternatives to traditional synthetic fiber composites such as those reinforced with glass or carbon fibers due to their renewability, biodegradability, affordability, and recyclability.1,2 Historically, the fabrication of natural fiber composites has primarily relied on simple methods like the hand lay-up technique. In such processes, the orientation of fibers during lamination significantly influences mechanical properties, including compressive strength. For example, studies have shown that varying fiber orientation angles within polyester resin matrices can optimize composite performance.3,4 Among various natural fibers, sisal has gained considerable attention owing to its advantageous properties. Sisal is easily cultivated, has a short renewal cycle, and is abundant particularly in countries like Tanzania and Brazil, which collectively produce over 4.5 million tons annually.5,6 Its fibers are extracted manually, sun-dried, and processed into reinforcement materials that are lightweight, flexible, and possess high strength-to-weight ratios. Traditionally used in ropes and mats, sisal fibers are now being explored for diverse advanced applications due to their environmental benefits and mechanical robustness.7,8 A composite material results from the combination of a matrix such as polymers, metals, or ceramics and a reinforcement phase, which confers enhanced strength, stiffness, and other mechanical properties.7,8 The effectiveness of reinforcement depends on multiple factors, including fiber type, size, distribution, orientation, and the quality of the fiber–matrix interface.9–11 The reinforcement in composites enhances strength and mechanical properties, with their effectiveness influenced by material properties, distribution, shape, size, concentration, and orientation within the matrix.12,13 The size and distribution of reinforcement materials affect the composite’s texture, while the volume fraction determines the interfacial area, which is vital for interactions between the reinforcement and matrix, ultimately impacting the composite’s overall properties. 14 Engineering materials utilize both synthetic and natural fibers. Synthetic fibers are produced through controlled manufacturing processes, resulting in consistent mechanical and thermal properties globally. Conversely, natural fibers are influenced by environmental factors like sunlight, soil, water, and air, which cause greater variability in their properties.15,16 Natural fiber properties vary with environmental conditions. The strength of natural fiber-reinforced composites depends on fiber and matrix types, fiber length and orientation, fiber content, and the quality of the fiber–matrix bond.17–19 Polyester and epoxy thermosets are frequently used with natural fibers in composites, with sisal fiber being notably advantageous due to its flexibility, insulation, noise absorption, and impact resistance. This study focuses on evaluating and restoring the compressive properties of sisal fiber-reinforced polyester resin composites.20,21 Sisal fiber is one of the most commonly used natural fibers because of its easy cultivation, short renewal cycle, and natural growth along field hedges and railway tracks, making it a sustainable and easily accessible reinforcement material.22,23 The volume fraction of fibers influences the interfacial area, stress transfer, and overall composite performance. While synthetic fibers offer consistency due to controlled manufacturing processes, natural fibers exhibit inherent variability influenced by environmental conditions such as sunlight, soil, water, and air exposure.17,24,25
The variability in natural fiber properties influences the mechanical behavior of composites, especially under different loads. Polyester and epoxy matrices are common in sisal fiber composites, which offer benefits like insulation and impact resistance. While traditionally used in non-structural roles, their potential for structural applications requires a deeper understanding of their mechanical performance, particularly under compression. However, the compressive behavior of sisal–polyester composites remains underexplored, making it essential to study their performance considering the viscoelastic nature of polymers and fiber–matrix interactions. This study aims to assess their compressive strength using experimental, analytical, and finite element methods to inform the development of reliable, sustainable composites for various engineering uses. The findings were contributed valuable insights into their mechanical behavior, supporting the development of reliable, sustainable composite materials suitable for a range of engineering applications.
Ethiopia has a surplus of sisal plants, which have great potential for use as reinforcement materials. For many years, researchers have focused mainly on synthetic composites reinforced with glass, carbon, and ceramic fibers. However, less attention has been given to natural fibers such as sisal, bamboo, and kenaf. Despite the abundance of sisal, its contribution to the agro-economic sector of the country remains negligible compared to other nations.
The main objective of this study is to investigate locally available sisal fiber. We aim to examine its compressive strength and assess its potential to reduce material costs by comparing its properties with those of glass and carbon fibers. Commonly used fiber composite materials such as carbon and glass fibers face several challenges, including high costs, non-renewable sources, and environmental pollution resulting from industrial processes.
From various literature sources, it has been observed that studies on sisal fiber mainly focus on its tensile, flexural, and impact properties, while limited research has been conducted on its compressive properties, particularly with respect to fiber orientation angles. Most of the existing studies use epoxy matrices with different weight ratios. Based on this, we are motivated to study the mechanical properties of local sisal fiber reinforced with a polyester matrix at different fiber orientations.
In this work, we investigate the compressive properties of sisal fiber–polyester composites at different fiber angles while keeping the fiber weight constant. To analyze the compressive strength of the composite, both analytical evaluation using classical lamination theory and simulation analysis using ANSYS software are carried out.
Materials and methodology
Materials
In this study, sisal fibers and polyester resin with hardener are directly used to prepare composites. The preparation process includes NaOH solution treatment, water washing, and drying, with NaOH-to-water ratios of 6:100 and 10:100, to enhance fiber–matrix bonding. The composites are fabricated using the hand lay-up method, aiming to evaluate how fiber treatment and resin incorporation influence the compressive strength and overall performance of the resulting materials. Figure 1 shown below indicated the extraction process of the sisal fiber.

Extraction process of sisal fiber. (a) Sisal plant leaf, (b) peeling, (c) removing the cellulose, and (d) washing and drying.
Figure 1 above shows a sequence of steps in traditional sisal fiber extraction from sisal plant leaves. Each sub-image (a–d) depicts a different stage of the process:
Freshly harvested sisal plant leaves – long, thick, and fibrous. These are the raw materials from which fibers will be extracted.
Scraping or decorticating the leaves – a manually removing the fleshy part of the leaves to expose the fibers inside, often using a blunt tool over a wooden surface.
Further cleaning and separating the fibers – washing and pulling apart the fibers to remove residual leaf material and improve fiber quality.
Drying the fibers – the cleaned fibers are hung in the sun to dry, making them ready for spinning or weaving into ropes, mats, or textiles.
Methods
An experimental study was conducted using 36 specimens prepared for compressive strength testing, with the selection of samples based on parameters such as weight concentration. The objective was to investigate the mechanical properties specifically, the compressive strength of seven different composite materials, all utilizing natural fibers, particularly sisal fiber combined with polyester resin. Due to the advantageous properties of sisal fiber, these composites were chosen for their potential applications. The sisal fiber samples were transported to our laboratory for testing, and the specimens were fabricated in accordance with ASTM standards to ensure accuracy and reliability of the results. A critical aspect of specimen preparation was proper design; typically, for compressive testing, specimens should be sufficiently thick with a short test section to prevent buckling prior to failure, thereby ensuring valid measurement of the material’s true compressive strength.

Where:
h = critical thickness
lg = given gauge length
Ex = modulus in the x-direction
σcu = ultimate compressive stress?
Gxz = shear modulus in the x–z plane
This formula estimates the minimum specimen thickness to prevent buckling; it is recommended to increase the specimen thickness an additional 10%–20% above the calculated value (i.e. up to 12.276–13.392 mm).
Fiber treatment
In this study, chemical treatment was applied to enhance the properties of the sisal fibers. The process involved soaking the fibers in sodium hydroxide (NaOH) solutions with ratios of 6:100 and 10:100 (NaOH–water), followed by thorough water washing and drying. The natural fibers were extracted from their parent plant prior to treatment. The NaOH treatment served to remove the waxy surface layer and increase fiber roughness, thereby promoting better adhesion with the matrix. During the process, the fibers were immersed in the NaOH solution and rammed to ensure uniform exposure. After treatment, the fibers were sun-dried for 3 days and then cured for ∼20 days before use.26,27
Figure 2 clearly illustrates the fiber treatment process using NaOH, divided into four sequential stages labeled (a–d):
Measuring NaOH: shows a digital weighing of NaOH pellets placed on a white sheet.
Measuring water: digital weighing of a plastic bottle of water.
Preparation and soaking: bundles of greenish sisal fibers tied at one end, ready to be immersed in the NaOH solution.
Washing and drying: shows cleaned, light-colored (beige/yellowish) sisal fibers after alkali treatment and drying, indicating successful removal of surface impurities and lignin.

Fiber treatment process by NaOH: (a) Measuring of NaOH, (b) measuring of water, (c) compounding sisal fiber into pieces and adding to water in the container, and (d) water washing and drying.
Mold preparation
In mold preparation, the resin was mixed with the hardener, which was added to the plastic composite to promote and control the curing process. The mixture was prepared in a ratio of 1:0.0346 (resin to hardener; Figure 3). The components were stirred continuously with a stirrer for several minutes to ensure thorough mixing.28,29
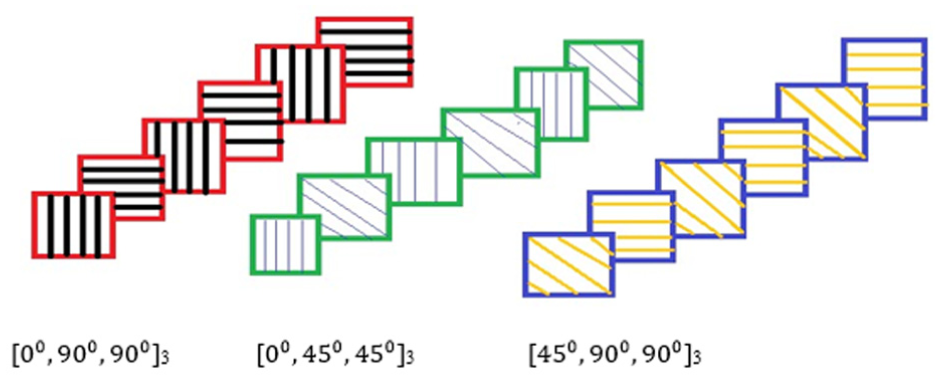
Angle arrangement of laminated composite.
Considering direction and angle ply of fiber, referring to the applied force
Under this process, I have used three conditions of fiber to polyester ratio (concentration of fiber and polyester resin) as follows,
20% sisal fiber + 80% polyester
30% sisal fiber + 70% polyester
40% sisal fiber + 60% polyester (angle)
Bidirectional continuous fibers {
Unidirectional discontinuous fibers
Random discontinuous fiber
The above Figure 4 illustrates:
I. Painting the mold with wax to avoid the sticking problem: The mold surface is coated with wax or a releasing agent to prevent the sample from sticking during removal. This ensures smooth demolding and a clean finish.
II. Mixing polyester with hardener: Polyester resin is mixed with a catalyst or hardener (usually MEKP) to initiate the curing process. Proper mixing ensures uniform hardening of the composite material.
III. Measuring its weight: The mixed resin is weighed accurately to maintain the correct resin-to-fiber ratio, which affects the mechanical properties and consistency of the sample.
IV. Process of making a sample on a prepared mold: The fibers (reinforcement material) and resin mixture are laid into the prepared mold in layers. This step forms the base structure of the composite sample.
V. Prepared process: The layered fibers and resin are properly arranged and made ready for compression. This ensures even distribution of material within the mold.
VI. Compressing the sample with its plate: The mold is closed with a top plate, and pressure is applied to remove air bubbles and ensure good bonding between fibers and resin.
VII. Compressed samples for an easy bonding process: The compressed samples are left to cure under pressure, improving adhesion and ensuring strong interfacial bonding between matrix and reinforcement.
VIII. Prepared samples: After curing, the mold is opened, and the final composite samples are removed, trimmed, and prepared for further testing or use.

Sample fabrication and preparation process.
Mathematical model of sisal fiber in composite materials
Volume fraction of fiber
The volume fraction of fiber was calculated by a method that enables the rule of mixtures to be applied and the measured composite properties to be analyzed. The method involves measuring the density of the composite (ρc) of mass (Mc) at a given mass fraction of the resin (Mr). Volume fraction of resin (Vr) was calculated using the formula 30 ;

Where

Volume fractions can be written as:
Fiber volume fractions,
Matrix volume fractions
Sum of volume fractions

Where,
The volume of a 1-gram composite can be v =
Mass fractions
Mass fractions (weight fraction) of fiber
Mass fractions (weight fraction) of matrix

Mass fractions and volume fractions related as:

The density of composite in terms of mass fractions can be:

In Figure 5 estimating overall effective modulus of composite compatibility of strains for the parallel model leads to:


Parallel and series arrangements model. 26
And equilibrium of stresses for each phase in the series model leads to:

Young’s modulus:


Shear modulus:

Poisson’s ratio:

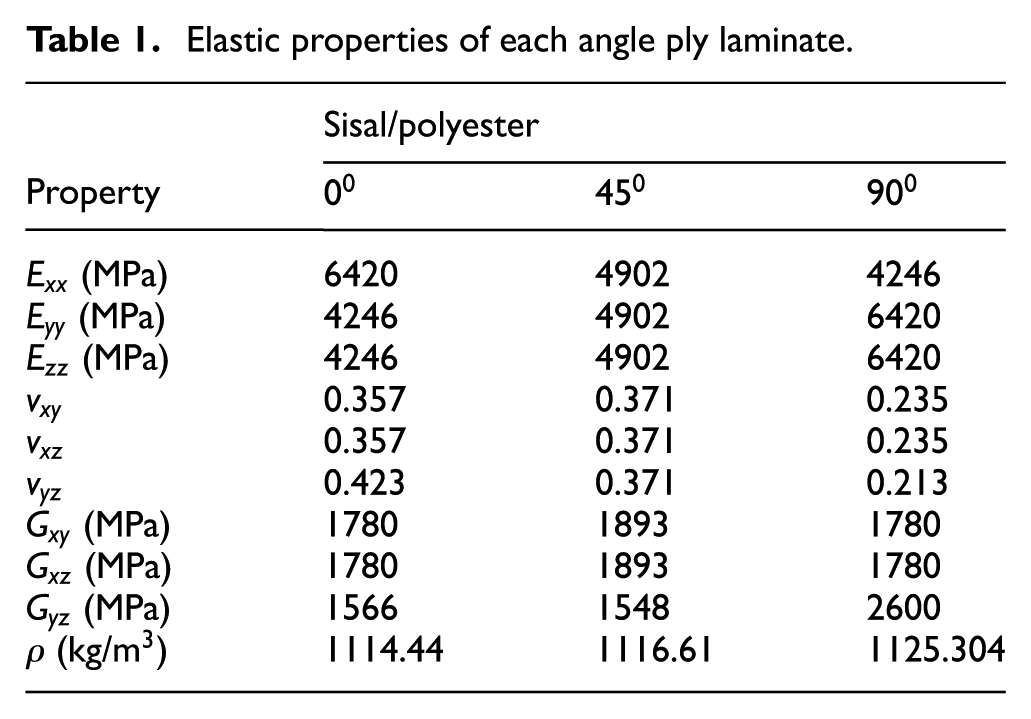
The Table 1 above sisal/polyester composite samples exhibit varying mechanical properties depending on the fiber orientation. The Young’s modulus (Exx), which represents stiffness in the fiber direction, is highest at 0° orientation with a value of 6420 MPa, indicating that fibers aligned with the loading direction provide maximum stiffness. At 45°, the modulus decreases to 4902 MPa, reflecting a balance between axial and shear loading effects, while at 90°, it further reduces to 4246 MPa due to fibers being oriented perpendicular to the load. The transverse moduli (Eyy and Ezz) show a reverse trend, with the 90° orientation exhibiting the highest values, indicating better stiffness perpendicular to the fiber direction. Poisson’s ratios also vary with orientation, with the 45° samples showing slightly higher values, suggesting greater lateral strain coupling. The shear moduli (Gxy, Gxz, and Gyz) remain relatively consistent across orientations, except for Gyz, which is significantly higher at 90°, demonstrating improved shear resistance in that plane. The density of the composites is fairly uniform, ranging from ∼1114 to 1125 kg/m3 across all orientations, consistent with the use of natural fiber reinforcement. These properties collectively influence the overall mechanical performance of the composite samples, affecting their stiffness, strength, and deformation behavior under different loading conditions.
Elastic properties of each angle ply laminate.
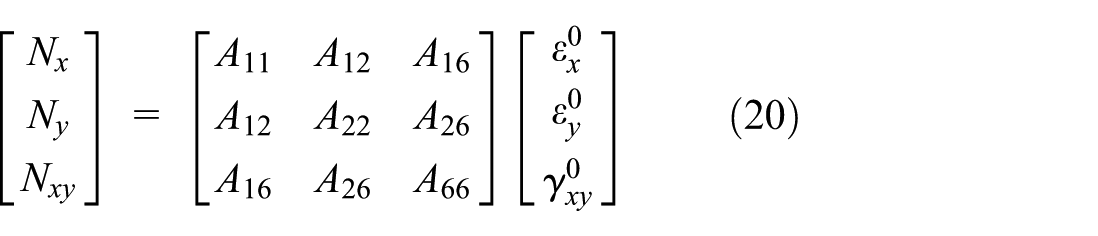
ABD matrix
The ABD matrix is a 6 × 6 matrix that serves as a connection between the applied loads and the associated strains in the laminate. It essentially defines the elastic properties of the entire laminate. To assemble the ABD matrix, follow these steps 30 :


Calculate the transformed reduced stiffness matrix for each ply based on the reduced stiffness matrix and fiber angle (for the first and six layers or
(Ǭ11) = Q11 cos4Ө + 2(Q12 + 2 Q66) sin2Ө cos2Ө + Q22 sin4Ө,
(Ǭ12) = Q12 (sin4Ө + cos4Ө) + (Q11 + Q12 − 4 Q66)sin2Ө cos2Ө,
(Ǭ22) = Q11 sin4Ө + 2(Q12 + 2 Q66) sin2Ө cos2Ө + Q22 cos4Ө,
(Ǭ16) = (Q11 − Q12 − 2 Q66) sin Ө cos3Ө + (Q12 − Q22 + 2 Q66) sin3Ө cos Ө,
(Ǭ26) = (Q11 − Q12 − 2 Q66) sin3Ө cos Ө + (Q12 − Q22 + 2 Q66) sin Ө cos3Ө,
(Ǭ66) = (Q11 + Q22 − 2 Q12 − 2 Q66) sin2Ө cos2Ө + Q66 (sin4Ө + cos4Ө)
Calculate the
The Figure 6 above shows a composite laminate consisting of multiple plies (laminae) stacked together. The vertical position of each ply is measured from the midplane of the laminate, denoted as

Description of vertical position in the ply from the midplane:
The reference plane located at the middle of the total laminate thickness
The total thickness of the laminate is
Each ply
The vertical position for the top ply (first lamina) is denoted by
The vertical position for the
Heights
typically represents the distance from the midplane to the top surface of the first lamina.
could be the vertical distance from the midplane to the bottom of the first lamina.
Similarly,
is the total half-thickness of the laminate, that is, the distance from the midplane to the bottom surface of the last lamina.
Assemble ABD matrix


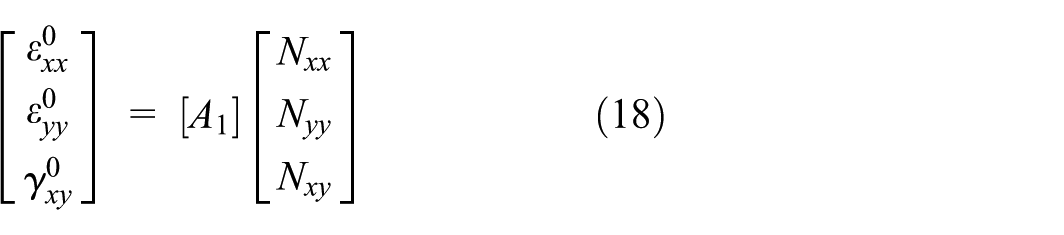
Mid plane strains and curvatures if the normal force and moment resultant s acting on a laminate are known, its mid plane strains and curvatures can be calculated by:

Where
Note that for a symmetric laminate,
Recall that for symmetric laminates, the

where h is the thickness of the laminate. Since the
Experimental set-up
Experimental procedures
For this research, a universal testing machine (UTM) operated in compression mode was used to evaluate the compressive strength of the sisal fiber-reinforced polyester resin specimens. The UTM setup is depicted in the Figure 7. Following standard procedures, the test specimen was securely positioned between the upper and lower jaws of the machine to ensure accurate measurement. Prior to testing, essential data including specimen length, width, gauge length, and shape (flat or rectangular) were entered into the machine’s control panel. Once all parameters were set, the machine applied gradually increasing pressure to the specimen until failure, allowing for precise assessment of its compressive strength.30,33
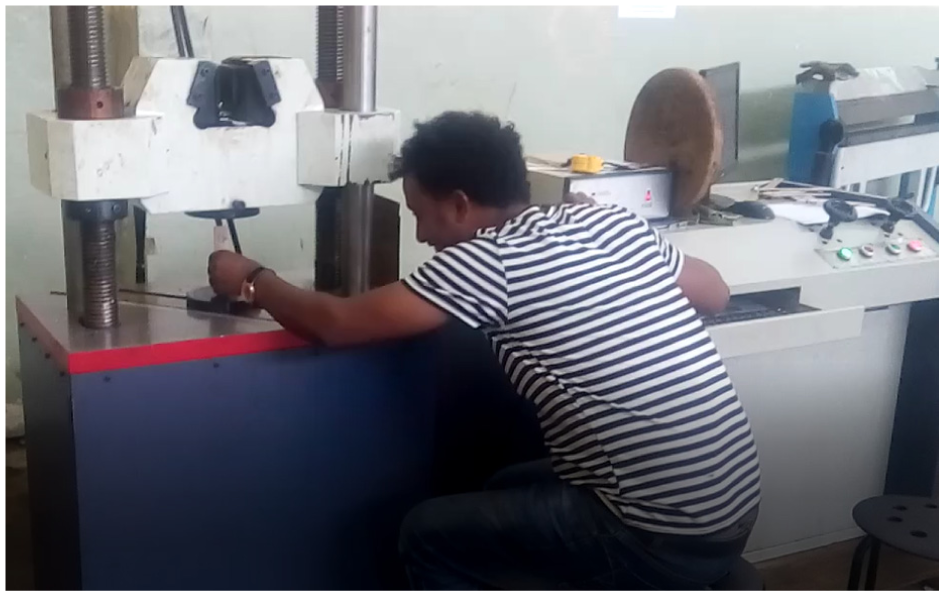
Experimental setup of UTM and compressive testing procedures.
Materials used and samples
The materials under the tests are sisal fiber and polyester resin as a matrix under different condition. By using those materials preparing samples for considering Angle arrangement of fiber with referring to load direction.
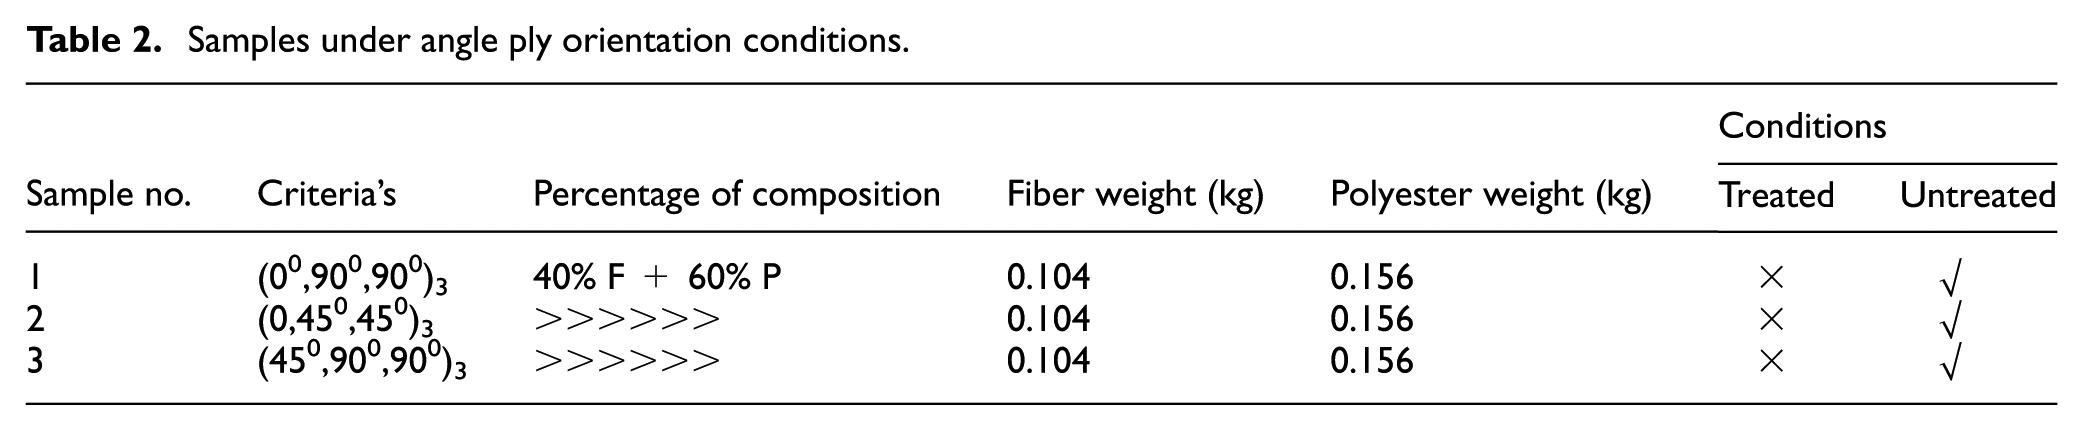
Table 2 presents the details of the composite samples fabricated under different angle ply orientation conditions. Three samples were prepared with fiber orientations of (0°, 90°, 90°)3, (0°, 45°, 45°)3, and (45°, 90°, 90°)3, respectively. Each sample consists of a fixed fiber-to-polyester weight ratio of 40% fiber and 60% polyester, with the fiber weight maintained at 0.104 kg and the polyester weight at 0.156 kg. Notably, all samples were produced using untreated fibers, as indicated by the untreated condition, while no samples were fabricated using treated fibers. This controlled setup allows for a focused comparison of the effects of ply orientation on the mechanical properties of the sisal/polyester composite laminates.
Samples under angle ply orientation conditions.
Result and discussion
Experimental results
Compressive test specimens were prepared different conditions such as random orientation of fiber and using different angle orientations. Seven samples with six laminae were prepared using sisal fiber with polyester resin ratio of untreated angle arrangements of (00,900), (00,450), and (450,900). The following graph shows the stress versus strain under different angle arrangement.
Table 3 illustrates the compressive test results for the three sisal/polyester composite laminates with different ply orientations reveal variations in strength, force, modulus, and elongation behavior. For the (0°, 90°, 90°)3 laminate, the maximum strength (Rmax), proportional limit (Rp), and tensile strength (Rt) are all consistent at an average of 59.5 MPa, with an average breaking force around 18.67 kN. The elastic modulus remains steady at 1 GPa, and elongation is −2%, indicating slight compression. The (0°, 45°, 45°)3 laminate shows a wider range in strength values with an average maximum strength of 60.5 MPa but lower proportional and tensile strengths, indicating more variability in failure modes. The average breaking force is about 18.73 kN, with elongation around −2.25%. The (45°, 90°, 90°)3 laminate exhibits similar strength values to the first sample, with mean strengths close to 59.5 MPa and slightly higher breaking forces averaging 20.17 kN. Its elongation reaches −2.75%, showing a bit more compressive strain before failure. Across all samples, the elastic modulus remains constant at 1 GPa. These results highlight how fiber orientation influences the mechanical response, with the (45°, 90°, 90°)3 laminate offering the highest breaking force, while the (0°, 45°, 45°)3 orientation shows more variation in tensile properties.
Mean experimental values.

Table 4 presents the experimental results for compressive strength and failure strain of sisal/polyester composite laminates with different fiber orientations. The (0°, 90°, 90°)3 laminate shows a maximum compressive strength of 59.5 MPa, a proportional limit of 59.5 MPa, and a tensile strength of 57.5 MPa, accompanied by a failure strain of 6.14%. The (0°, 45°, 45°)3 laminate exhibits a slightly higher maximum strength of 60.5 MPa but lower proportional and tensile strengths of 50 and 31 MPa, respectively, with a failure strain of 5.45%. The (45°, 90°, 90°)3 laminate has strength values comparable to the first sample, with a maximum strength of 59.5 MPa, proportional limit of 58 MPa, tensile strength of 59 MPa, and the highest failure strain at 7.2%, indicating superior ductility under compressive loading. These results highlight how fiber orientation influences both the strength and deformation capacity of the composite laminates, with the (45°, 90°, 90°)3 configuration offering a balance of strength and enhanced failure strain.
Experimental results for compressive strength and failure strain.

Stress versus strain analysis for angle orientation samples
The compressive strength increased until the point of ultimate stress under compressive loading. Up to the ultimate compressive stress region the graph shows linear relationship between stress and strain. Beyond this point, the stress–strain curve showed non-linear segments. This graph shown that the increment value is non-linear, in which the responsible for this response is jerky/stick-slip behavior. During fracture, compressive stress of SFRPC rapidly decreased with buckling of specimens.
Inference from the graph:
When see Figure 8 of the three system of angle arrangement, the result was almost similar and difficult to point out the effect of fiber orientation angle on the compressive strength of SFRPC. In the three conditions, (00,900,900,)3, (00,450,450,)3, and (450,900,900,)3 with the corresponding compressive strength were 59.5, 60.5, and 59.5 MPa, respectively.
The result getting from (00,450,450,)3 test is better with small amount and it satisfy Tsai–Hill criteria,18,34 the compressive properties of composites continuously decrease as the angle of orientation of the fibers increases from 0.

Compressive strength comparison of sisal/polyester composite under different angle orientations.
Force versus displacement for angle orientation lamina
Inference from the graph:
Referring Figure 9 the required maximum force that the material resist to break were found 20.17 kN on the (450,900,900,)3 angle ply lamina with the corresponding displacement in compression were 2.75 mm.
The minimum breaking force found for this case were 18.67 kN at (00,900,900,)33 indicates the small different comparing to all arrangements.

Mean force versus mean displacement for angle orientation laminate.
Simulation analysis by ANSYS
Simulation results
From the simulation result of sisal fiber with polyester resin with the fiber length of 140 mm, width 25 mm with recommended thickness of 12 mm six layers. Applying the same pressure on different conditions to analyze the compressive stress, equivalent strain and deformation due to the applied pressure of 42.435 MPa and comparing the result with that of experimental and analytical results. model shown below were a rectangular model having six laminas with 2 mm thick for each. 34
The default element size is determined based on a number of factors including the overall model size, proximity of other topologies, body curvature and the complexity of future as having number of elements used are 4896, and number of nodes used are 36,690.
Figure 10 illustrates a three-dimensional solid model of the sample, which features a layered structure representing the different plies or laminae within the composite material. The model is discretized using a mesh composed of small cubic or hexahedral elements that divide the composite’s volume into finite segments for analysis. The mesh density appears to be moderate, with elements distributed uniformly across both the thickness and length of the sample, ensuring consistent resolution throughout the model. A scale bar at the bottom indicates dimensions in meters, showing that the overall sample length is ∼0.04 m (40 mm). Additionally, the coordinate system located at the bottom right corner defines the X, Y, and Z directions, providing spatial orientation for the analysis. This meshing configuration enables finite element method (FEM) simulations to assess the mechanical behavior of the composite, including stress distribution, strain response, and deformation under various applied loading conditions.
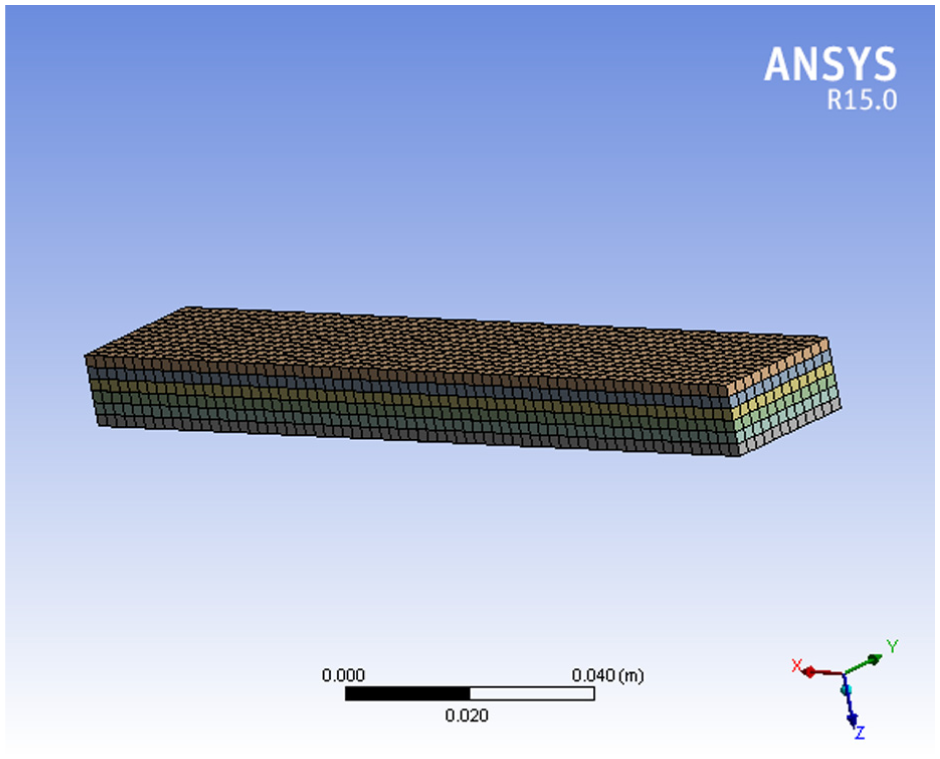
Meshed model of rectangular plate specimen.
Figure 11 shows the von-Mises stress distribution in a sisal-polyester composite under static loading, with stress values ranging from about 19.45 to 51.78 MPa. The highest stress is concentrated near one end of the sample, indicating potential areas of failure. This analysis helps evaluate the composite’s strength and optimize its design for better performance.

Equivalent stress for (0°, 90°, 90°) lamina at 18.67 kN.
Figure 12 indicates a compressive test on a (0°, 45°, 45°) sisal-polyester composite is performed to evaluate the material’s behavior under axial compressive loads. This test measures properties such as compressive strength, modulus, and typical failure modes, which are essential for understanding how the material performs in structural applications where crushing or buckling may occur. During the test, the specimen is compressed between two plates until failure, and data such as load, displacement, and strain are recorded. Due to the natural fiber content, the composite may exhibit failure modes like fiber buckling, matrix cracking, or delamination. The 0° fibers primarily contribute to compressive stiffness, while the ±45° layers enhance shear resistance. Overall, the compressive test helps determine the suitability of the sisal-polyester laminate for load-bearing and sustainable engineering applications.

Total deformation for (0°, 45°, 45°) lamina 18.73 kN.
Figure 13 illustrates the (45°, 45°, 90°) laminate subjected to a 20.17 kN load, the equivalent elastic strain is expected to be higher compared to laminates with fibers aligned closer to the loading direction, such as (0°, 45°, 45°). This is because the 90° layer is oriented perpendicular to the primary load and provides less axial stiffness, resulting in greater deformation under compression. The 45° layers help distribute the load by resisting shear stresses, but the overall laminate will experience increased strain, especially near the interfaces between layers. Strain concentrations are likely to appear around the 90° fibers, which are less effective at carrying axial loads. Therefore, the (45°, 45°, 90°) laminate under 20.17 kN load will demonstrate a higher equivalent elastic strain, reflecting its reduced stiffness in the loading direction and a more complex strain distribution across the composite layers.

Equivalent strain for (45°, 45°, 90°) lamina at 20.17 kN.
Table 5 shows that the fabricated composite laminate models show a close correlation between analytical, simulated, and experimental results for stress, strain, and breaking force. For the (0°, 90°, 90°)3 laminate, the analytical stress is 62.23 MPa with a 4.59% error compared to experimental data, while the simulated stress shows a slightly higher error of 11.1%. The strain values are very close, with the analytical strain at 0.01801 mm/mm and only a 0.054% error. The breaking force recorded experimentally is 18.67 kN. Similarly, the (0°, 45°, 45°)3 laminate exhibits an analytical stress of 62.43 MPa with an even lower error of 3.19%, and the simulated stress has an 11.2% error. The strain here has a slightly higher error of 3.164%, with an experimental breaking force of 18.73 kN. The (45°, 90°, 90°)3 laminate shows the highest analytical stress at 67.23 MPa but also the highest error of 10.99%, with the simulated stress error at 12.5%. The strain analysis for this laminate is quite accurate, with an analytical strain error of only 0.529%, and it has the highest breaking force of 20.17 kN. Overall, the data suggests that the fiber orientation significantly affects the mechanical behavior of the composite laminates, with the (45°, 90°, 90°)3 configuration providing the highest strength, while all models demonstrate reasonable agreement between analytical, simulated, and experimental results.
Error comparison between analytical approach, simulation approach, and experimental approach.

Failure analysis
Based on Failure Identification Codes Record the mode, area, and location of failure for each specimen according to ASTM standard. Compressive failure was attributed by micro buckling surrounded by delamination. The delaminated portions spread to the intact areas of the laminate by a combination of delamination buckling and growth, the buckling further enhancing the growth of damaged area. The culmination of this last event is the complete loss of stiffness of specimens. The first character of the Failure Identification Code describes the failure mode. All of the failure modes in the “First Character” are acceptable with the exception of end-crushing or Euler buckling. The most desirable failure area is the middle of the gage section since the gripping/ tabbing influence is minimal in this region. 15 Because of the short gage length of the specimens in this test method, it is very likely that the failure location was almost at the middle which is acceptable.
The Figure 14 shows the compressive failure types of composite specimens after experimental testing. The specimens, likely corresponding to different fiber orientations, exhibit various fracture patterns typical of compression failure in natural fiber composites. The visible cracks and splits along the length of the samples indicate modes such as matrix cracking, fiber buckling, and delamination. Some specimens show clean splits, suggesting brittle fracture, while others display more irregular or jagged cracks, implying complex failure mechanisms like fiber–matrix debonding or progressive damage. These failure patterns help to understand the compressive behavior of the sisal-polyester laminates and validate the analytical and simulated results by correlating the type and location of damage with the predicted strain and stress concentrations.

Compressive failure type after experiment.
Conclusion
In this study, samples of sisal fiber reinforced polyester composite (SFRPC) were prepared in accordance with ASTM standards. The mechanical performance, specifically the compressive strength of the composite, was evaluated under various angle ply orientations using analytical, experimental, and simulation approaches. The experimental tests provided valuable data regarding the compressive strength of the sisal fiber reinforced polyester resin composite. These results are fundamental in confirming the reliability of the material and its potential application in automotive body components. Based on the experimental findings, several key conclusions were drawn: The compressive strength of SFRPC was determined for different sisal-to-polyester resin ratios under both untreated and various angle ply orientation conditions. The maximum compressive strength was observed in the (0°, 45°, 45°) three-lamina configuration, reaching 60.5 MPa with a corresponding deformation of 2.25 mm. The maximum force the material could resist before failure was 20.17 kN in the (45°, 45°, 90°) three-lamina arrangement, with a displacement of 2.75 mm during compression. The lowest breaking force recorded was 18.67 kN in the (0°, 90°, 90°) arrangement, indicating only a slight variation compared to other configurations. Overall, the maximum compressive strength achieved was 60.5 MPa, and the maximum mean breaking force was 20.17 kN. When comparing the experimental results with simulation data obtained from ANSYS, the composite’s behavior under constant pressure closely matched that of steel, although the composite exhibited higher deformation values. This suggests that while the composite demonstrates promising strength characteristics, its deformation behavior differs from traditional steel, which should be considered in practical applications.
Footnotes
Handling Editor: Claudia Barile
Author contributions
Ayele Hailu Yibeltie: writing – review and editing, writing – original draft, validation, methodology, investigation, formal analysis, data curation, conceptualization. Melese Shiferaw Kebede: supervision, investigation, and data curation.
Funding
The authors received no financial support for the research, authorship, and/or publication of this article.
Declaration of conflicting interests
The authors declared no potential conflicts of interest with respect to the research, authorship, and/or publication of this article.
Data availability statement
The data generated during this study are included in this paper.