
Abstract
The design of fiber-reinforced polymer–concrete hybrid beam is usually governed by deformation. Due to the rigidity degradation caused by fiber-reinforced polymer–concrete slip, the load–slip and load–deflection curves demonstrate a bilinear characteristic. The originality of this article is to propose a bilinear analytical model and to determine two dominant parameters in this model, namely, initial bond stress and slip modulus of the interconnection. This model consists of two distinct linear stages. In Stage I, full composite action between fiber-reinforced polymer and concrete is obtained, and no slip exists; Stage II commences once interfacial bond force diminishes, when slip increases linearly versus load, and the overall beam rigidity drops compared with that in Stage I, indicating only partial composite action is realized. Finally, three large-scale specimens were tested to validate the proposed bilinear model and to calculate the two parameters.
Introduction
Fiber-reinforced polymer (FRP) has been extensively applied in the aircraft, chemical, and automobile industries. The high strength, light weight, non-corrosive properties, rapid construction, and low maintenance requirements make FRP an attractive solution for civil engineering subjected to harsh circumstances. However, to overcome the relatively low stiffness, local weakness, and initial high cost of all-FRP beams, FRP–concrete composite beams (Figure 1) have been researched recently.1–4 This system maximizes the advantages of both FRP and concrete: FRP behaves as the main girder in the tensile side while concrete deck in compression, enhancing the global stiffness and resistance to concentrated load.5–8 After taking into account the expected improvements in transport, installation, and life-cycle differences, the initial cost of FRP can be offset, thereby leading the system competitive in the standard short-span bridge market and bridge decks.9–11 Consequently, the feasibility of full-scale FRP–concrete beam bridges in field applications has increased substantially.3,4,7,12–14

Typical FRP–concrete composite beam.
The design of FRP–concrete composite beam is usually governed by deformation, thus, the computation of deflection will be of great importance.15,16 Like steel–concrete composite beam, interface slip will minimize the compatibility between FRP and concrete, thereby leading to a stiffness degradation of the overall beam.2,7,15–21 FRP composites cannot be welded like steel, and therefore, the performance of shear connectors in FRP–concrete interface totally differentiates from that of steel–concrete composite beam with head studs.15,16,22–26 The most significant difference is that the load–deflection curves demonstrate a bilinear behavior in many literatures2,17,27,28. Therefore, the following pages will propose a novel analysis model to quantify the links between interfacial shear force and relative slip. Three large-scale beam specimens and six push-out specimens will be applied to validate the model and to determine the two parameters, namely, initial bond stress and slip modulus of the interconnection.
Shear connectors and bilinear model in hybrid FRP–concrete beams
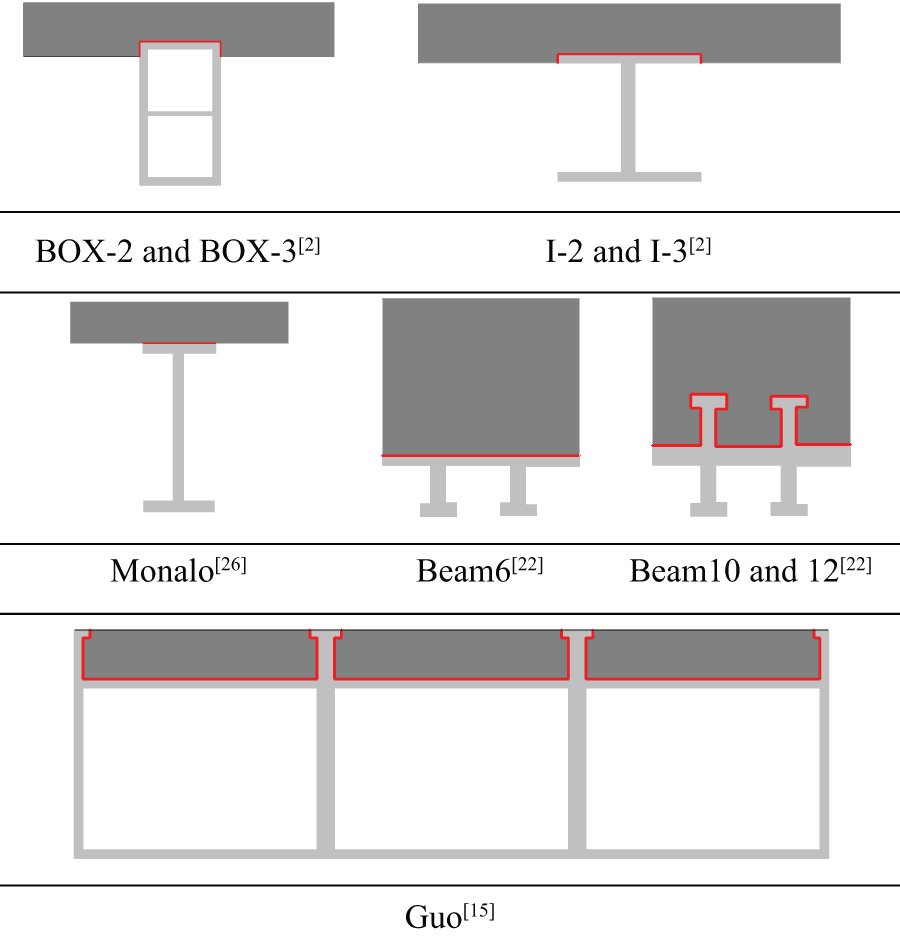
In existing references, five connections (Figure 2) have been evaluated in FRP–concrete composite beam. Adhesives and interlock are easily available means, yet result in only partial effectiveness and catastrophic failure.4,5,8,9,22 Therefore, bolts and dowels are designed fixed in predrilled holes; however, the gap and flexibility of bolts and dowels have led to overdue interface slips.3,5,8,23–25 It was also found that the gap could be prevented effectively by burying bolts and dowels into concrete.8,23 Similar to press blanking lines (PBL) for steel–concrete composite beams, perforated FRP is designed by reinforcing bars passing through holes in the glass fiber–reinforced polymer (GFRP) flanges/webs and embedding in concrete to prevent FRP–concrete slip.19,20,24,26

Alternative composition of FRP and concrete: (a) adhesive, (b) interlock, (c) bolts, (d) drawls, and (e) perforated FRP.
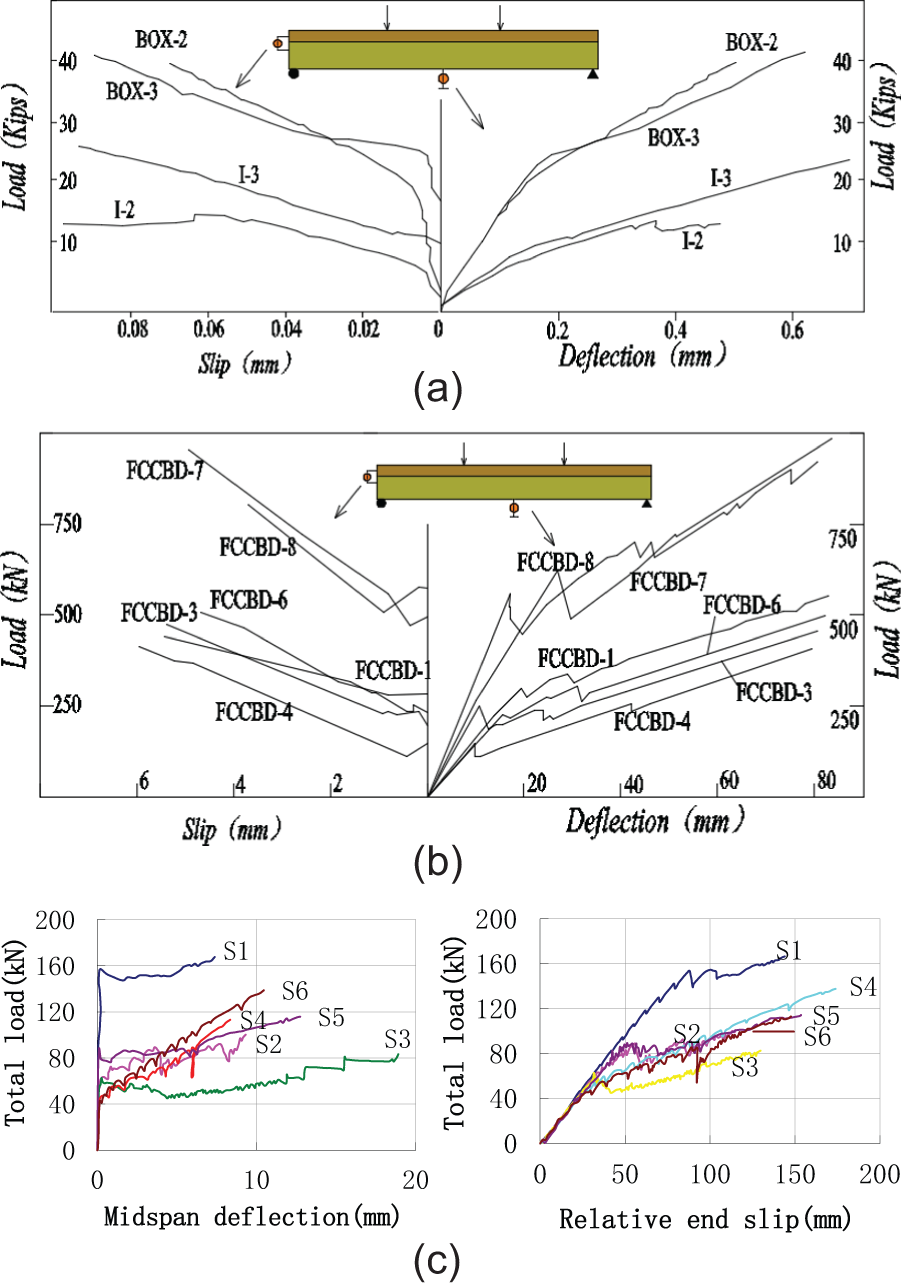
In existing laboratory beams, the load–slip and load–deflection curves consist of two distinct linear stages (Figure 3). In Stage I, full interaction is assured by cooperation of adhesive, static friction, and chemical bond from concrete; there is no separation and slip, and therefore Bernoulli’s beam theory is satisfied; Stage II commences once interfacial bond force diminishes, when slip increases linearly versus load, and the overall beam rigidity (K2) drops compared with that in Stage I (K1), indicating only partial composite action is realized and load–deflection curves and the load stabilize whereas the deflection and slip keep increasing till failure.
A typical load–slip curve will show a linear stage first, followed by a plastic stage after the yielding of steel head studs in steel–concrete composite beam (Figure 4). The comparative curves of FRP–concrete beams and steel–concrete beams are shown in Figure 4.

Analytical load–deflection curves and load–slip curves.
Quantification of bilinear model
Given a comprehensive look at the stresses and other evidence from the tests, the curves showed that the slip remained 0 at the initial loading period and load–deflection curves went up approximately linearly at a fixed slope. Once the load exceeded a certain value, slip ensued and then increased linearly versus the load, and load–deflection curves kept increasing linearly with a smaller slope than that of Stage I.
The bilinear relationship between load and slip can be quantified by equation (1)

where s is the relative accumulated slip between the concrete slab and FRP girder,
This function reflects the link between the vertical load and interconnection slip straightly from the measured curves. However, in order to reveal the constitution of the interconnection, that is, the function between interface shear stress and its corresponding slip, it can be deduced as follows.
The total interface stress in a certain section is of a fixed proportion to the shear force of the hybrid beam

Shear force of the hybrid beam could be calculated from the vertical load using familiar theory (take the concentrate load for example)

Solving equations (1)–(3) yields

where
No doubt that
Determination of parameters in bilinear model by experiments
Determination of
In Stage I, since there was no interface slip, the composite action was perfectly obtained; herein, an equivalent section model could be used, and thus, shear stress of the interface could be obtained by horizontal force equilibrium

For the interface, its vertical height

The total interfacial shear force of a certain section can be given as

In order to determine the interfacial resistance, it was assumed that the interfacial resistance would remain a constant value corresponding to a particular connection, namely,

where Bbond is the total cross-sectional length of bond area (see Figure 5), which denotes the adhesive length in the section.
The sectional equilibrium of the bond force and interfacial shear force gives
Solving equations (2)–(5) yields
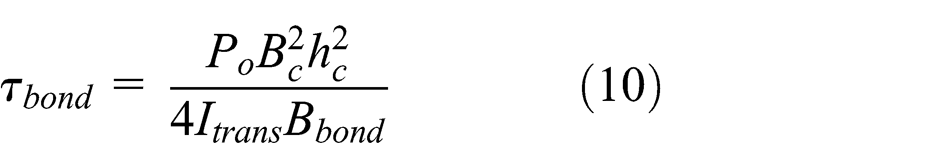
where S* (y) is the moment of area above the height y, Bc is the width of concrete slab, hc is the height of concrete slab, and Itrans is the moment inertia of composite beam section.
Testing and theory results from different specimen in references are given in Table 1.

Epoxy resin: adhesive made by epoxy; bolts: bolts in the predrilled holes; coated: gravel/sand coated on the surface of upper FRP flange before casting; interlock: fiber-reinforced polymer (FRP) ribs.
Determination of ks
ks denotes the link between shear force and interaction slip; it will dominantly affect the composite behavior in partial composite action stage. Since a variety of connectors and testing data about any particular connections are not sufficient to reveal its mechanism, theories are not applicable here for the connections; tests have now been the main way to define ks . Similar to the steel–concrete hybrid beam, the slip modulus of the connectors was usually judged by the push-out tests.
Deflection prediction considered the slip effect using the bilinear model
In the bilinear model, the behavior of the FRP–concrete hybrid beams was divided into two stages: initial full composite action followed by partial composite action later. The former stage could be analyzed using familiar theories,15,16,29,30 and the latter one is analyzed as follows.
The deflection of the hybrid beam comes mainly from the elastic deformation of FRP and concrete, which could be calculated by an equivalent section, and the other income is the additional deflection caused by the interface slip (Figure 6).

Strain distribution along the height direction considering the slips.
For deflection and stress calculation under vertical load, FRP–concrete composite structures are usually modeled elastically since the FRP is inherent linear elastic, and for simplicity, concrete experiences low stress levels until failure. Thus, elastic analysis is used at present, and it is assumed that (1) the shear stress at the interface is ruled by equation (1), that is, the bilinear model, and (2) FRP girder and concrete flange share the same curvature.
For a simply supported beam shown in Figure 7, equilibrium of the finite length dx (Figure 8) in the horizontal direction gives (take the one-point load in Figure 7(a) for example)

where FNC is the axial force in concrete and FNF is the axial force in FRP.

Load definitions: (a) one-point load, (b) two-point load, and (c) uniform load.
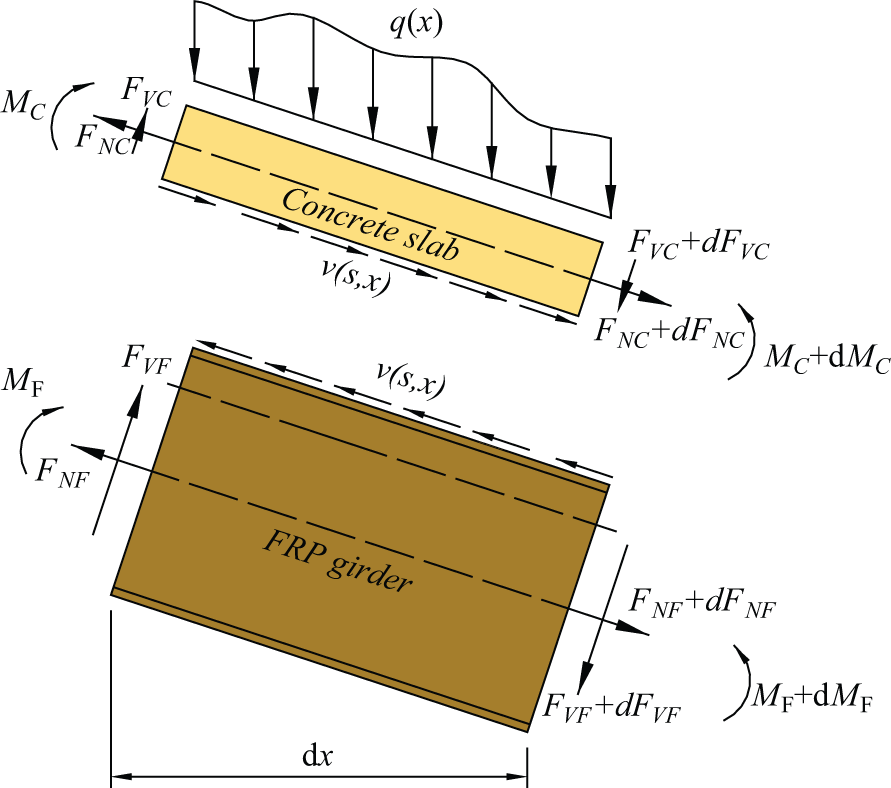
Model of sectional analysis (dx).
Equilibrium in the vertical direction gives

where VC is the shear force carried by concrete, VF is the shear force carried by FRP, and P is the total load at the midspan.
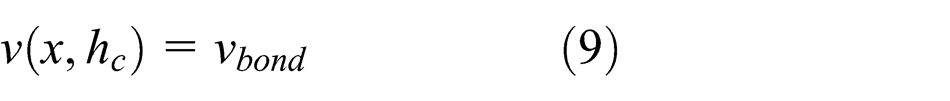
The moment equilibrium of the concrete and FRP segments gives


where Mc is the moment carried by concrete, MF is the moment carried by FRP, v(s,x) is the stress between FRP and concrete interface, hc is the distance from the bottom of concrete to its neutral axis, hF is the distance from the top of FRP to its neutral axis, and r is the normal stress between FRP and concrete interface.
Curvature compatibility between the concrete and FRP gives the curvature
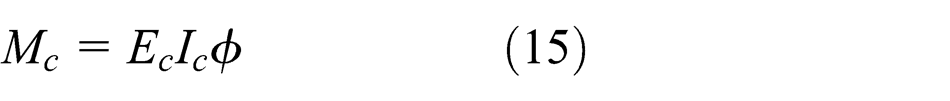

where EFx is the elastic modulus of FRP, IFx is the moment inertia of FRP, Ec is the elastic modulus of concrete, Ic is the moment inertia of concrete, and F is the curvature of the beam.
Strains at the bottom of concrete (εcb ) and top of FRP (εFt ) are calculated from the moment and axial force as

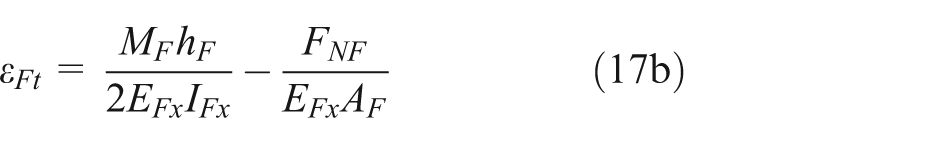
where Ac is the area of concrete and AF is the area of FRP.
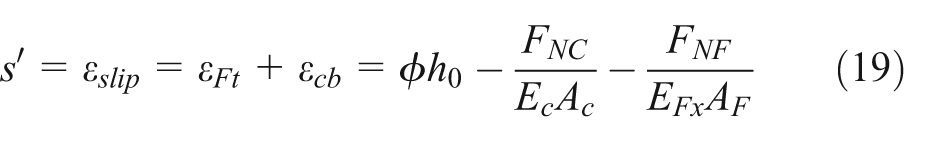
Solving equations (11)–(18) yields

The relative slip strain at the interface is calculated as
Derivation with respect to x in equation (19) and then using equations (17) and (18) give the differential equation as

where
Solving equation (20) and using the boundary conditions that s(x = 0) = 0, s(x = l/2) = 0 (where L = span length) give the slip solution for 0 < x < l/2 as

Correspondingly, slip strain solution is

The additional curvature due to slip is calculated as
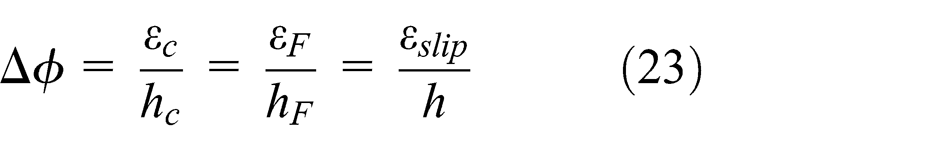
where hc is the depth of concrete, hF is the depth of FRP, and h is the depth of entire section.
For the case of simply supported beams with a single load shown in Figure 7(a), the additional deflection due to slip is then calculated from the curvature as

Similarly, for two-point load (total load = P) and uniform load q shown in Figure 7(b) and (c), the additional deflections due to slip are derived, respectively, as
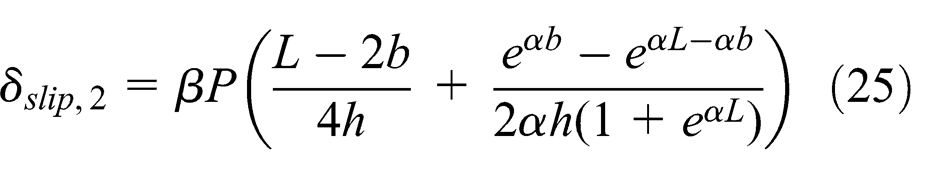
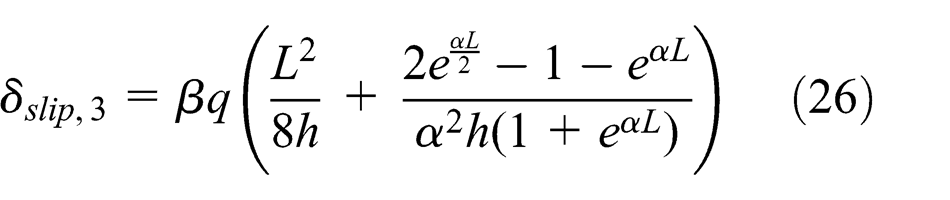
where δslip ,1 is the additional deflection due to slip for one-point load, δslip ,2 is the additional deflection due to slip for two-point load, δslip ,3 is the additional deflection due to slip for uniform load, and b is the distance between loading point and the midspan (Figure 7(b)).
Effect of shear deformation on sectional rigidity
For thin-walled FRP composites, shear modulus is relatively lower than that of conventional materials; thus, the effect of shear deflection on section rigidity cannot be ignored. 31 It was evaluated that the shear deformation would amount to as much as 30% or more of the total deformation. Herein, Timoshenko beam theory was employed to calculate the shear deformation.
The section no more remains an absolute plane owing to the shear deformation; the deflection can be given by structural mechanical methods as

where δshear
is the additional deflection due to shear force, ks
= A/Aweb
,
The comprehensive calculation methodology of deflection
Providing that the shear effect and slip effect are exclusive from each other, the total deformation (

Experimental verification of the posed model
In order to validate equation (28) in predicting the deformation, the slip stiffness ks is tested first using a coupon of push-out tests followed by three large-scale beam specimens subjected to four-point bending test.
Push-out tests for interface connections and determination of k
The push-out specimens were designed to determine the slip stiffness of steel bolts (two specimens) and perforated FRP connectors (two specimens). The geometric sizes are illustrated in Figure 9 and Table 2.

Details for push-out specimens.
Parameters of push-out specimens and the failures.
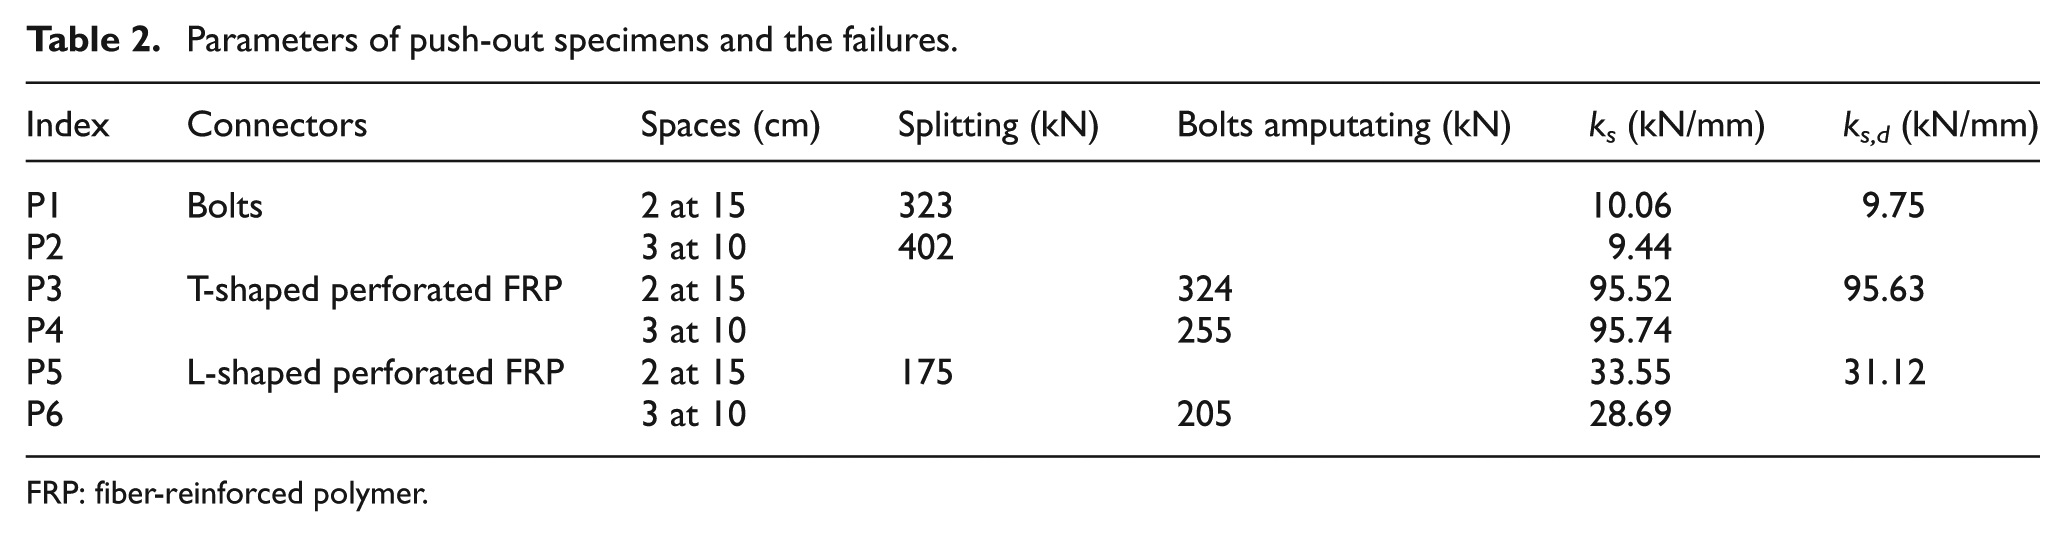
FRP: fiber-reinforced polymer.
The steel bolts were 10 mm in diameter, 110 mm in length, and had yield strength of 880 MPa. T-shaped pultruded FRP profiles were chosen as perforated FRP connectors, attached to H-shaped pultruded FRP profiles as main girders by using epoxy resin and 6-mm-diameter bolts. The 10-mm-diameter steel bars were used to cross 16-mm-diameter predrilled holes in FRP connectors. Timber forms were used to encase the grouting concrete.
After more than 28 days curing, the specimens were subjected to monotonous force-controlled loading using a 1000-kN testing machine. Linear variable displacement transformers (LVDTs) were used to measure the vertical sinking of concrete slab and H-shaped FRP for calculating their relative interconnection slips.
As for P1 and P2, specimens with high-strength steel bolts as connectors, FRP girder (H-shaped FRP) cracked along the lines containing the bolts (Figure 10) for the force concentration of the bolts.

Failures of P1 and P2 specimens.
For P3, P4, and P6, the connection between perforated FRP connectors and H-shaped FRP, the 6-mm-diameter connection bolts were amputated (Figure 11(b)) under interfacial shear force just after fibers on the surface of pultruded H-shaped FRP were peeled completely along the adhesive areas (Figure 11(c)).

Failures of P3, P4, and P6 specimens: (a) overall specimen, (b) fractured bolt, and (c) separated FRP and concrete.
For P5, the perforated FRP connectors were predrilled before grouting concrete, and similar cracks ensued along the connection line of holes (Figure 12).

Failures of P5 specimens.
The curves of load–slips of all the specimens are shown in Figure 13. In order to evaluate connections of different spaces and numbers, single connector and its corresponding load–slip curves are plotted and the secant slopes are defined as slip stiffness. The outcomes of the six specimens are concluded in the last column of Table 2; ks is the experimental result and ks,d is the average magnitude of each type of connectors.

Slip modulus of single interfacial connection.
As such, perforated FRP has an extremely high performance in slip resistance than bolts, the accumulated relative slip is less than 1 mm, and its average ks is nearly 10 times that of bolts. The capacity of perforated FRP is mainly governed by their connection with FRP girder which means the connection must be paid substantial attention when designing the beam specimens.
FRP–concrete hybrid beam experiments
After the push-out tests, three beams (Figure 14) in bending experimental programs were therefore subjected to flexural load. The parameters of these specimens are summarized in Table 3.
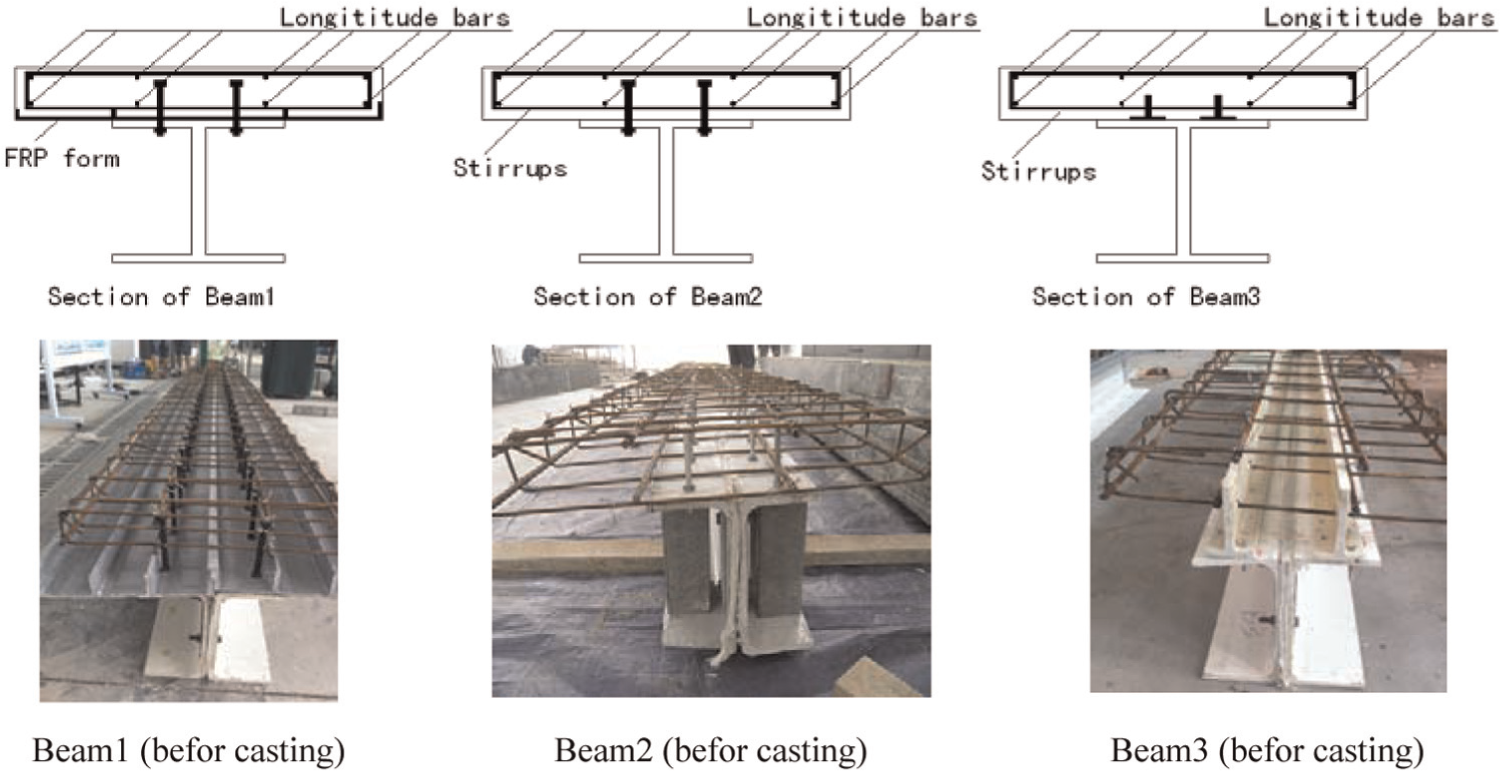
Sections of specimens.
Parameters and material properties of specimens.
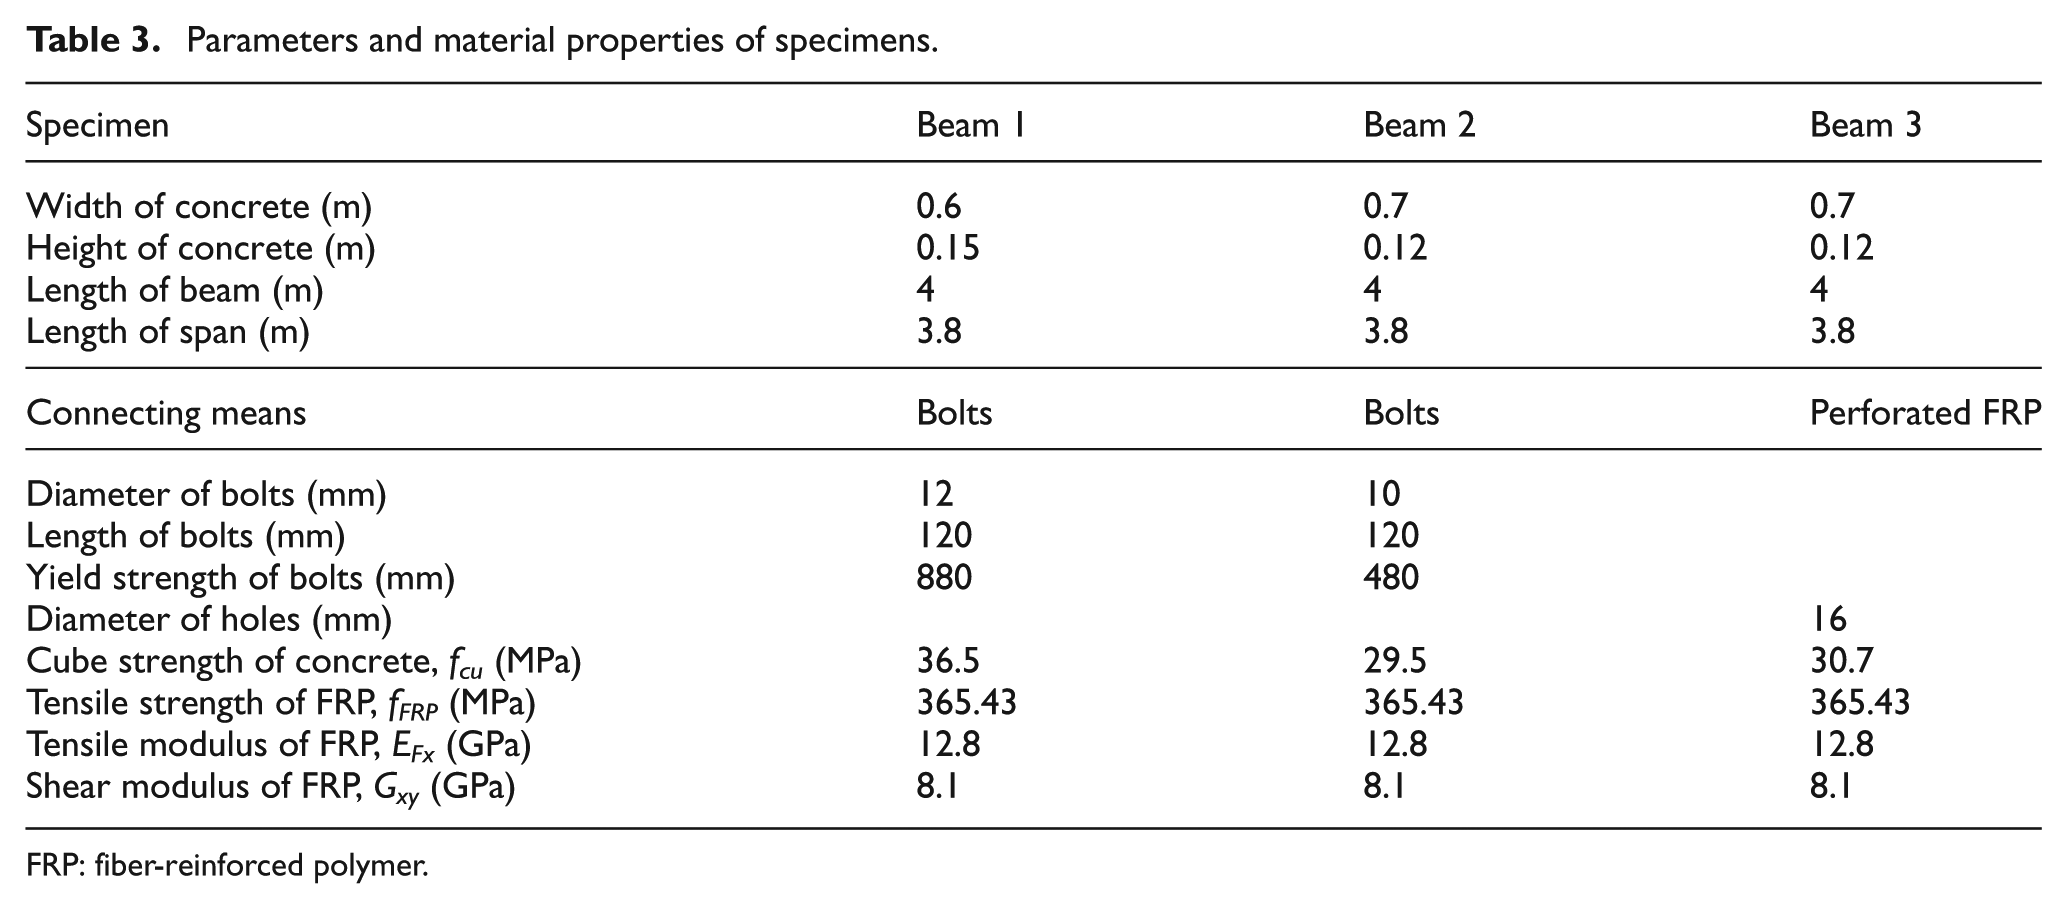
FRP: fiber-reinforced polymer.
The FRP composites were manufactured by Kangte Fiber Reinforced Composites Co. Ltd (Nanjing, China). The concrete was manufactured with a target compressive strength of 30 MPa. Reinforcing bars were Q235 (Chinese standard, the yield strength is 235 MPa). Timber forms were used to cast concrete; all the composite beams were cured at the same condition as the material testing specimens.
The beam specimens were instrumented with strain gages and LVDTs. The dial gages shown at the ends of the slab measured the accumulated slip of the concrete relative to the FRP beam. Figure 15 shows a typical arrangement of the transducers. The loading was force controlled and was applied in small increments using a 1000-kN testing machine.

(a) Instrumentation for specimens.
Testing procedures and results of beam experiments
All the beams had three loaded schedules—I: 1–100 kN (speed = 10 kN/min, increment = 10 kN), II: 100–200 kN (speed = 5 kN/min, increment = 5 kN), and III: 200-failure (if not fail before 200 kN) (speed = 2 kN/min, increment = 2 kN).
Beam 1
At about 90 kN, two cracks sprouted at the bottom of the concrete slab below the two load points, respectively, and then extended upward along the height direction due to the increase in load. At about 200 kN, interfacial slip recorded by dial gages occurred suddenly, and a loud noise was heard at the same time. At about 210 kN, a longitude crack was found in the joint area of FRP web and flange. At about 250 kN, a longitudinal horizontal crack alongside the fiber direction was found in the FRP web. At about 306 kN, the crack became wider resulting in failure; thus, the concrete crushed on the top of bending section just beside the north loading point (Figure 16).

Failure mode of Beam 1.
Beam 2
At about 55 kN, interfacial slip recorded by dial gages occurred suddenly; at the same time, a loud noise was heard. At about 70 kN, two cracks sprouted at the bottom of the concrete slab below the two load points, respectively, and then extended upward along the height direction due to the increase in load. At about 240 kN, snapping noise in the interface could be heard; it can be seen that bolts in the shear span were broken due to the shear force (Figure 17).

Failure mode of Beam 2.
Beam 3
At about 80 kN, two cracks sprouted at the bottom of the concrete slab below the two load points, respectively, and then extended upward along the height direction due to the increase in load. At about 115 kN, interfacial slip recorded by dial gages occurred suddenly; at the same time, a loud noise was heard. At about 240 kN, snapping noise in the interface could be heard; it can be a guess that bolts (between FRP shear connector and FRP gird) in the shear span were broken due to the shear force (Figure 18).

Failure mode of Beam 3.
Analysis of the results and validation of the bilinear model
It can be seen that the relationship between load and slip can be ruled by equation (1) quiet well; accordingly, the parameters of the bilinear model can be calculated (Table 4 and Figure 19). The load–deflection curves (Figure 20) of the three beams are found to be bilinear, and the rigidity degradation occurred once the slip ensued in Figure 19.
Results of initial bond stress,

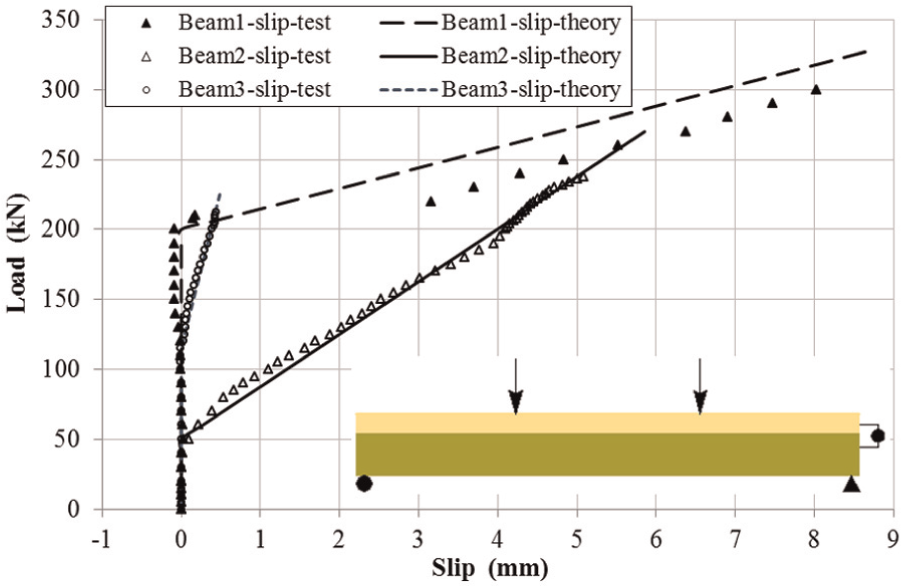
Testing and theoretical load–slip curves of the specimens.

Experimental load–deflection curves of the specimens.
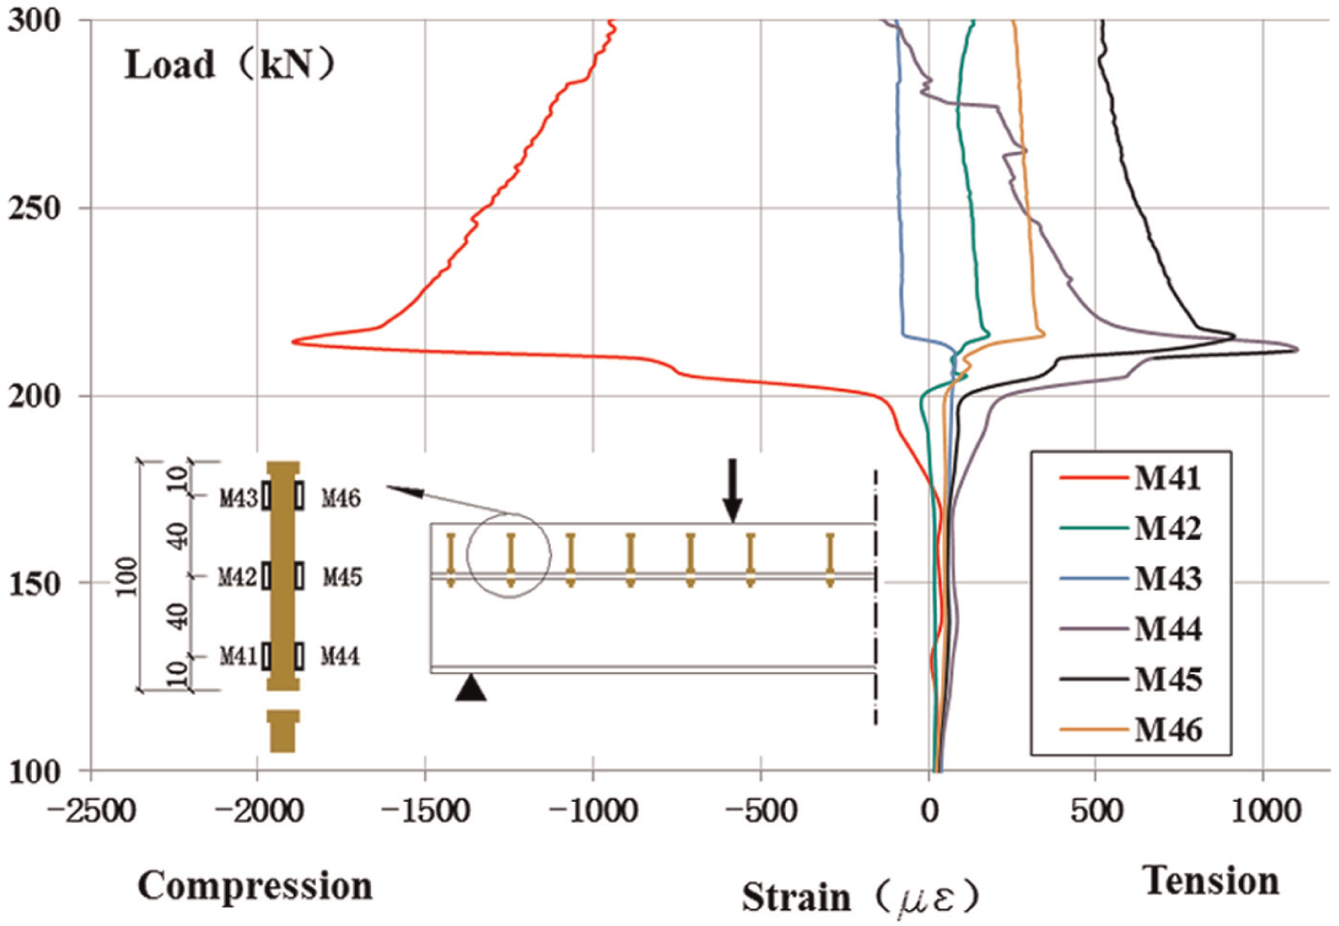
The measured slip and strain discontinuity between the FRP and concrete is clearly observed (Figure 21). It is noticeable that the plane assumption can be matched well before slip, but once the slip occurs, the section no longer remains a plane (Figure 22). Figure 23 shows the load–strain relationship of the steel bolts at shear span; as expected, the strain of bolts remains 0 before slip, and it shoots up once the slip occurs. This indicates that the steel bolts at shear span started to carry the horizontal force after slip occurrence. In Figure 24, four measured locations show the differences along the longitude directions of slip, and the increase in the slip versus load is plotted in the same figure.
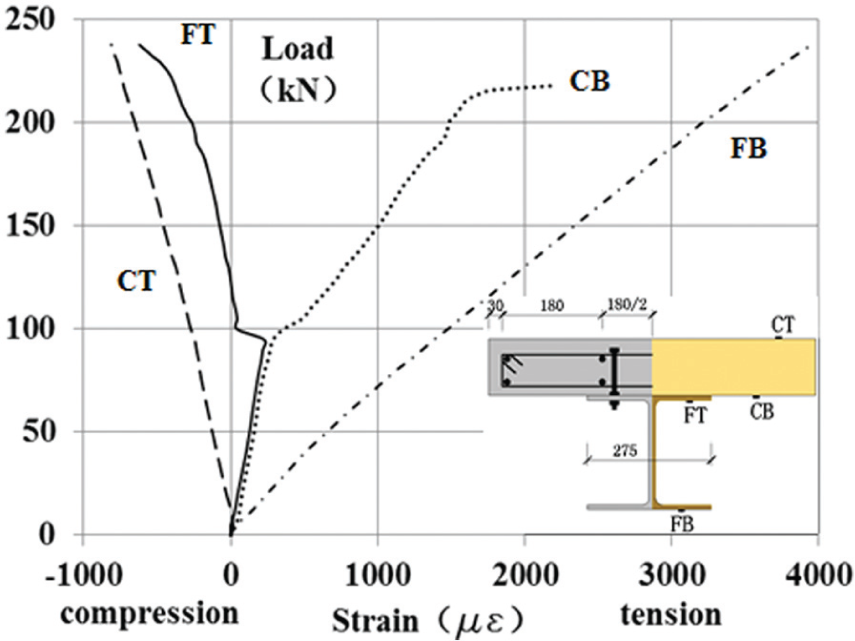
Strain of Beam 2 in midspan along the height direction.

Axial strains of hybrid beam along the height direction in the midspan of Beam 2.
Bolts’ strains of Beam 1.

Slip increasing versus load and distribution along the beam: (a) dislocation of the slip measurements, (b) slip increasing in Beam 2, (c) slip distribution in Beam 2, (d) slip increasing in Beam 3, and (e) slip distribution in Beam 3.
Based on the results in Tables 2 and 4, the constitute relationship of the interconnection and shear force was thus defined. According to the theoretical slip curve, the deflection of midspan was calculated, and results between theory and testing show good agreement (Figure 25).
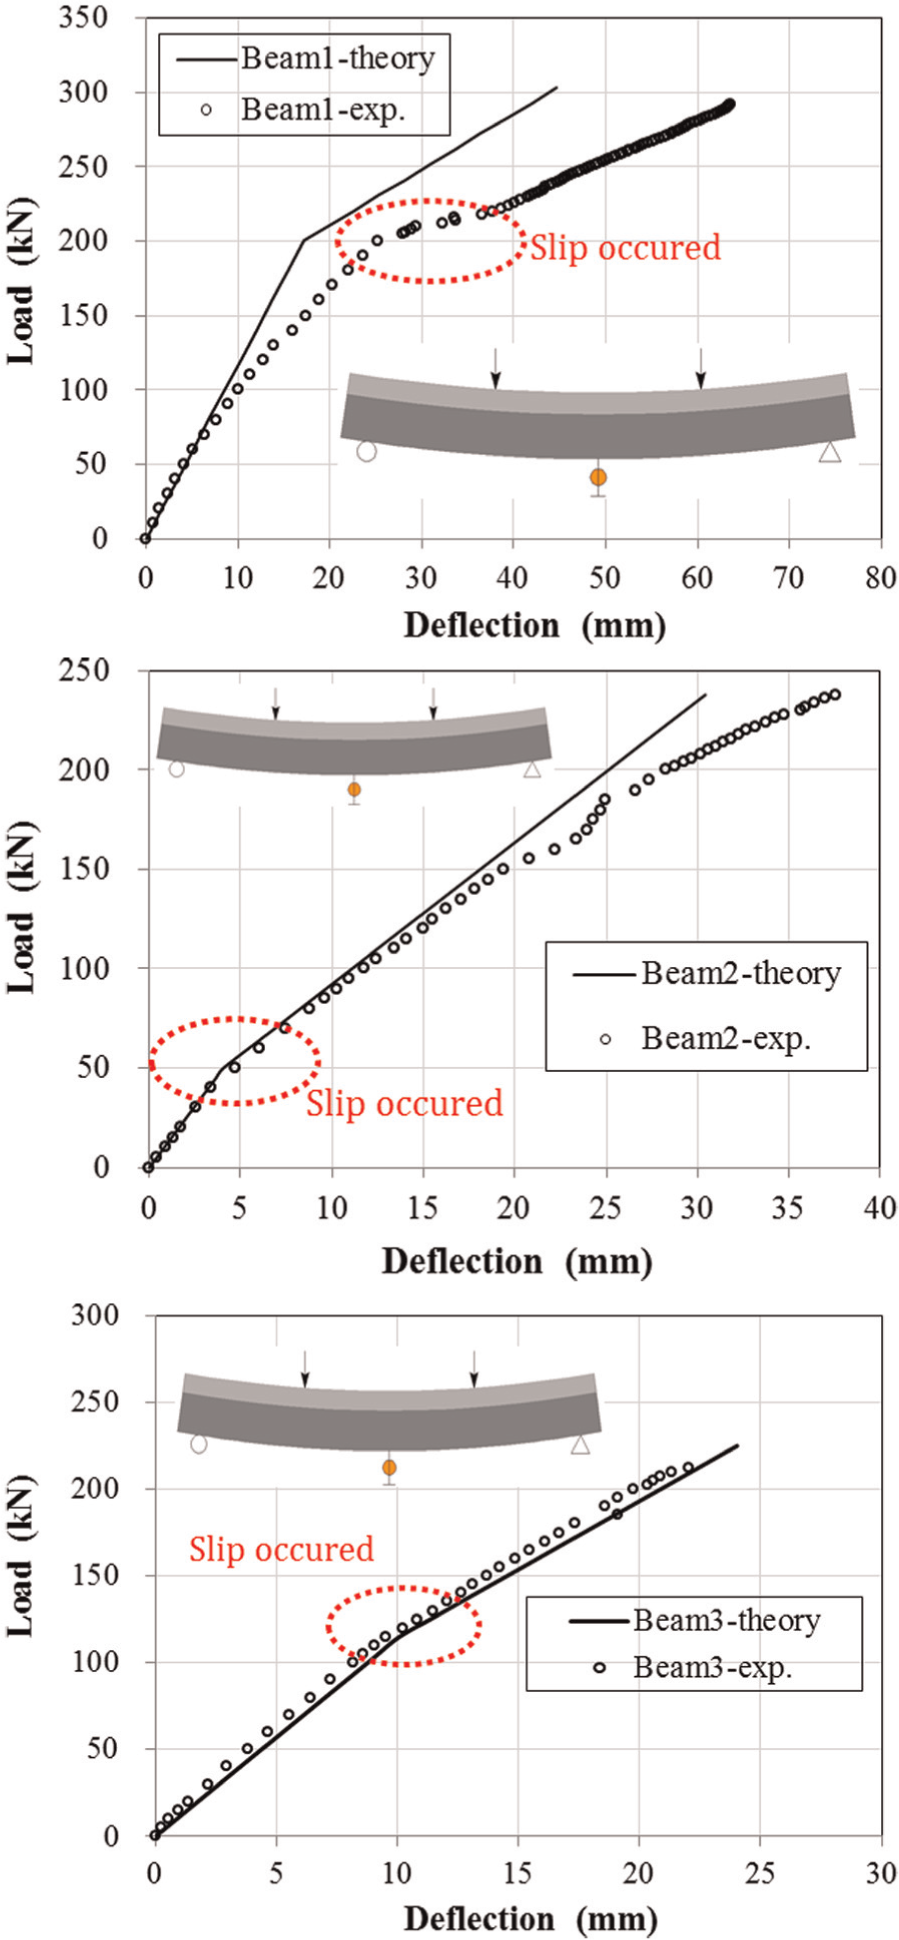
Comparison of experimental and theoretical load–deflection curves.
Conclusion
The significant effects of interface slip on the beam stiffness and strength of FRP–concrete composite beams cannot be ignored.
A bilinear model was proposed to predict to load–deformation curves considering the slip characteristics.
Two dominant parameters in the simplified model, initial bond stress (τo ) and shear stiffness of the interface (ks ), were determined according to the testing data.
Six push-out specimens were tested to evaluate the performances of different connections and to determine the slip modulus.
Three large-scale specimens were loaded to verify the bilinear interfacial model and supply insight into its precision, and good agreement between testing and theory was obtained from these tests.
Footnotes
Acknowledgements
The authors would like to thank their group members, Chen Jun, Li Shuai, Li Ming, and Yan Xiaowei, for their contributions to the experimental works.
Academic Editor: Yu-Fei Wu
Declaration of conflicting interests
The authors declare that there is no conflict of interest.
Funding
This work was supported by the National Natural Science Foundation of China (grant no. 51008068 and 51438003), six talent peaks project in Jiangsu Province (Grant No. JZ-007), and the Fundamental Research Funds for the Central Universities.