
Abstract
This study develops and validates a practical approach to estimating and reducing fuel consumption in urban bus operations using real-world data from Transinco B80 buses on Route 30 (Ho Chi Minh City). Against the company supply baseline (Q
c
c
= 24.42 L/66 km), the computed actual consumption under current practice is
Introduction
In the automotive industry, considerable attention has been devoted to the issue of fuel consumption in internal combustion engines under various operating conditions. Numerous studies have investigated the relationship between engine fuel consumption and factors such as engine design, operating regimes, and structural configurations.1–3 Additionally, the vehicle’s drivetrain characteristics, including transmission efficiency and mechanical losses, as well as resistive forces acting on the vehicle—namely rolling resistance, gradient resistance, aerodynamic drag, and inertial forces—have been comprehensively analyzed to estimate fuel consumption over time or distance traveled.4,5 These insights have led to continuous research and development efforts focused on optimizing engine systems, including the combustion chamber design, air intake and exhaust systems, fuel delivery, cooling, lubrication, ignition timing, and early fuel injection strategies. The introduction of advanced technologies such as turbocharging to enhance volumetric efficiency 6 and electronically controlled high-pressure fuel injection systems 7 has further contributed to improvements in engine performance and fuel economy, aligning with environmental sustainability goals. Beyond operational optimization for conventional buses, hydrogen fuel-cell powertrains are also being explored as a decarbonization pathway, with recent PEM designs reporting efficiency improvements.8,9
Nevertheless, actual fuel consumption in practice is heavily influenced by user behavior and driver operation. Key factors include vehicle maintenance practices, speed regulation, steering maneuvers, braking behavior, and adaptation to diverse terrain and traffic conditions. This study specifically investigates fuel consumption patterns of the Transinco B80 bus fleet operating on Route 30 in Ho Chi Minh City (see Figure 1). Using operational data provided by SaigonBus Company and validated by domain experts, 10 the study aims to propose effective strategies to minimize fuel consumption based on real-world driving conditions and vehicle usage characteristics.

Bus Route 30 map—Ho Chi Minh City.
The 33-km route from Tan Huong Market to the International University includes 64 stop points, consisting of both bus stops and traffic light-controlled intersections. This high frequency of deceleration and acceleration events significantly affects fuel consumption and vehicle operating efficiency in urban transit systems.
Fuel consumption rate on a transportation journey
Each type of vehicle will have a standard fuel consumption Qđm (l) for a 100 km journey. For buses, the standard fuel consumption is determined by equation (1) based on coefficients 7 that have been studied and applied to calculate the fuel consumption Qđm of buses operating in Vietnam in general and in Ho Chi Minh City in particular.

In there:
K 1: Technical fuel consumption coefficient
K 2: Passengers stop fuel compensation coefficient
K 3: Fuel adjustment factor for turning maneuvers
L: Bus route
p: Total stop count (incl. traffic lights)
n: Number of U-turns
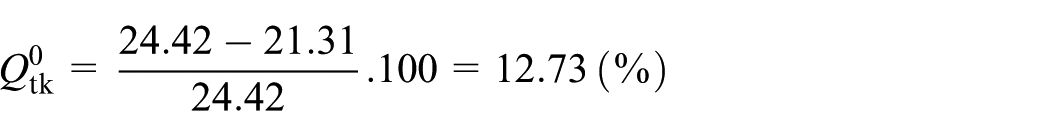
With the bus route calculation method in the topic, given two times (going and returning). Therefore: n = 2 (times) L = 33 2 = 66 (km), p = 64 2 = 128 (stations). The standard fuel consumption for a 66 km trip is calculated with the result Qđm = 21.31 l/66 km.
Currently, fuel consumption
Under the current operating conditions of the bus, the fuel supply Qcc of SaigonBus company is 37 l/100 km or 24.42 l/66 km for one vehicle. But fuel consumption is calculated based on equation (2) relating the engine structure and vehicle movement, giving the following results:

In which, η t is the transmission efficiency, A p , B p , C p are coefficients depending on the engine type, i h is the transmission ratio of the gearbox, G a is the vehicle weight, f, i are the rolling resistance and slope resistance coefficients, W is the air resistance coefficient, V a is the vehicle speed. For the B80 bus using diesel fuel and the technical parameters, 11 I obtained the necessary values to calculate the fuel consumption according to equation (2) as in Table 1.
Parameters affecting fuel consumption of B80 bus.

With the parameters affecting fuel consumption recorded in Table 2 determined and the vehicle’s moving speed V a on each transmission level, the fuel consumption is shown as in Figure 2.
Fuel consumption per gear during vehicle movement.


Graph of fuel consumption according to each gear and vehicle speed.
To accurately determine the actual fuel consumption, the project experimentally surveyed the driving habits of a group of drivers.11,12 From there, the actual speed of the vehicle at each gear level was calculated as well as the amount of fuel consumed during vehicle operation was determined.
During deceleration phases approaching designated stops—such as bus stations or red traffic signals—the driver adopts an energy-efficient maneuvering strategy by progressively reducing the throttle to idle, disengaging the clutch, downshifting to lower gears if necessary, and applying light trailing brake pressure. This controlled deceleration is typically executed over an average approach distance of ∼30 m/stop. Assuming the number of such stops is 128 over the observation period and denoting the deceleration time per stop as t gt . 13 Therefore, the distance the vehicle travels

The total deceleration time, denoted as t gt , is calculated by the equation t gt = (t c + t d ).n, where t c is the time, the vehicle prepares to stop within 30 m, t d is the time the vehicle stops completely at stops or at traffic lights. n is the number of times the vehicle stops. Experimental survey results for time intervals t c = 14 s and t d = 10 s, n = 128 2 = 126 (times).
Vehicle tractive forces across gear ratios were analyzed and summarized in Table 3.
Vehicle tractive force and total resistance by gear (B80, Route 30).

In Table 3, the total resistance of the vehicle at low speed (or the number of crankshaft revolutions from n e = 598 to 712 rpm) then ∑Fres = 2.75 kN. Thus, from the values of the magnitude of the traction force F k and the total resistance ∑Fres shows that the traction force of the vehicle on gears 1, 2, 3 is many times larger than the total resistance.

Fuel consumption during deceleration and stopping at a bus stop or at an intersection with a red light is calculated in 1 h, determined by the fuel consumption over time formula.

With engine useful power

Thus, the total amount of fuel for the Transinco B80 bus journey running on Route 30 for the outbound and return trips is calculated as follows:

Propose and compare and evaluate measures to reduce fuel consumption
Thus, with flat terrain conditions like Ho Chi Minh City and the operating characteristics of buses at low speeds (V a <50 km/h), the total weight of the vehicle only reaches a maximum of 15,040 kg, the traction on gears 2 and 3 can generate traction (four to seven) times greater than the total resistance. Therefore, reducing fuel consumption by reducing unnecessary residual traction on gears is the most effective and practical measure.
First measure: Reducing fuel consumption by minimizing the use of first gear to limit residual traction losses
In this approach, fuel consumption is reduced by minimizing the use of first gear during vehicle operation, particularly under typical driving conditions. This strategy aims to reduce residual traction losses caused by high engine torque at low speeds. By limiting the reliance on first gear, the vehicle can operate more frequently in higher, more fuel-efficient gear ranges, thereby improving overall fuel economy. 14 The quantitative effects of this measure on fuel consumption are summarized in Table 4. This table presents the fuel consumption calculation for the B80 bus when the first gear is skipped. By avoiding the low-efficiency first gear, total fuel consumption for a round trip on Route 30 is reduced to 22.37 l. This strategy improves energy efficiency and promotes sustainable urban bus operation through optimized gear shifting.
Fuel consumption when skipping the first gear (

Total fuel consumption for the turn-round trip on Route 30: 22.37 l.
Second measure: Operational compliance with the skipping-second strategy
In this measure, fuel consumption is reduced by minimizing the use of second gear during vehicle operation. Specifically, drivers are trained to shift directly from first to third gear, thereby bypassing second gear under normal driving conditions. This gear-skipping strategy reduces residual traction losses associated with lower gear operation and contributes to improved fuel efficiency. 15 The quantitative effects of this measure on fuel consumption are summarized in Table 5. This table illustrates the fuel consumption results for the B80 bus when the second gear is skipped during operation. By reducing reliance on the lower-efficiency second gear, the bus transitions more quickly to higher gears with better fuel economy. As a result, the total fuel consumption for a round-trip journey on Route 30 decreased to 21.71 l, compared to higher fuel consumption under conventional gear usage. 16 This approach demonstrates a measurable improvement in energy efficiency through gear-skipping strategy and enhanced driving behavior.
Fuel consumption when skipping the second gear (

Total fuel consumption for the turn-round trip on Route 30: 21.71 l.
Results and discussion
The author visualized the heterogeneity of the paired differences using a forest plot (Figure 3). For each bus route–time route the author computed
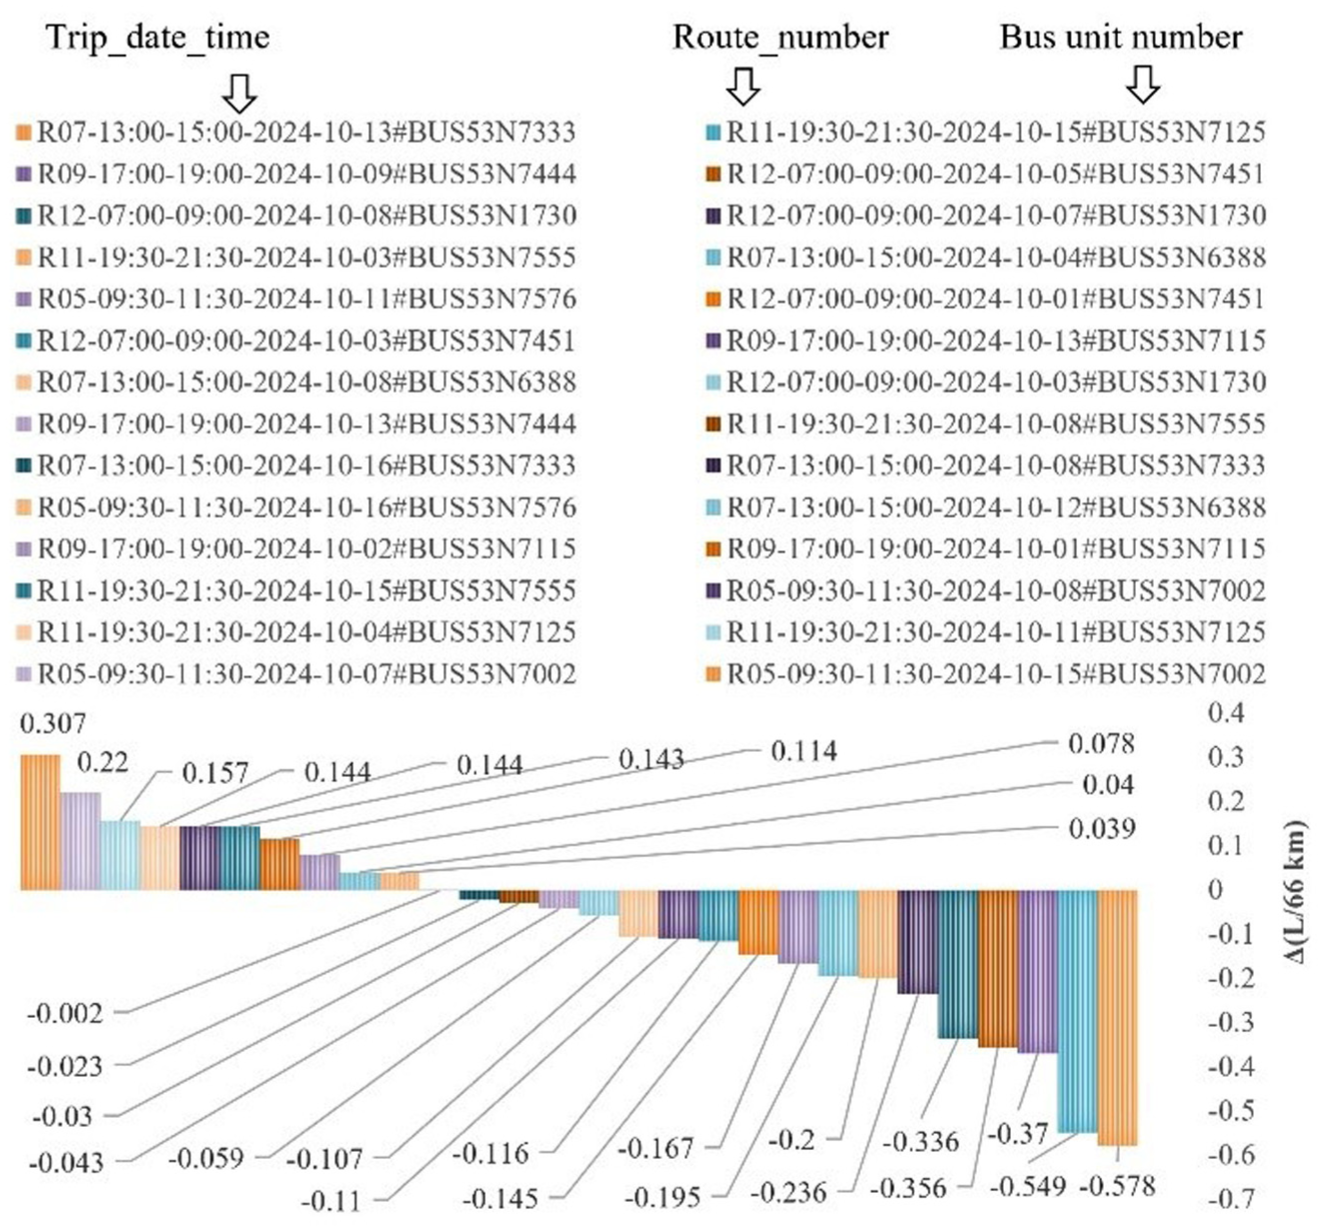
Forest plot of paired differences in normalized fuel use (Δafter before).
Most pairs exhibited negative differences (after < before), consistent with fuel savings, although several pairs were near zero or positive. The mean difference was
The amount of fuel for a 100 km trip provided by the company is 37 l or the amount of fuel for a 66 km trip is 24.42 l. Meanwhile, the calculation results based on the driving habits of the drivers show that the amount of fuel consumed is 22.41 l. From these results, the actual amount of fuel consumed is less than the amount of fuel provided by the company. To evaluate this difference, the author performs the calculation (4), which quantifies the relative fuel savings by comparing the supplied and consumed quantities. This method has also been adopted in related studies evaluating fuel efficiency discrepancies in real-world fleet operations17,18:

In there:
Q tk: Fuel economy between specific fuel quantity and fuel supply quantity.
Q cc: Fuel supply quantity.
Q ct: Specific amount of fuel.
Therefore, the amount of fuel saved
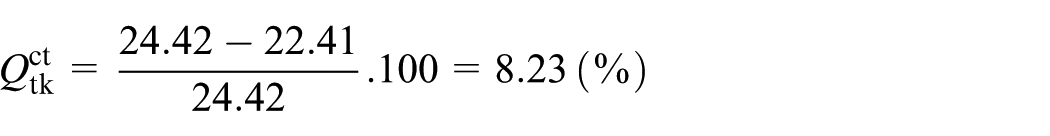
Each measure must save more than 8.23% compared with current practice. It must also meet the standard fuel-consumption value
For the first measure, the amount of fuel saved

For the second measure, the amount of fuel saved

Comparing the fuel savings of the two measures with the actual fuel savings, The author have the following results:
The amount of fuel saved
The amount of fuel saved
Calculate the fuel savings
When applying the first measure.

When applying the second measure.
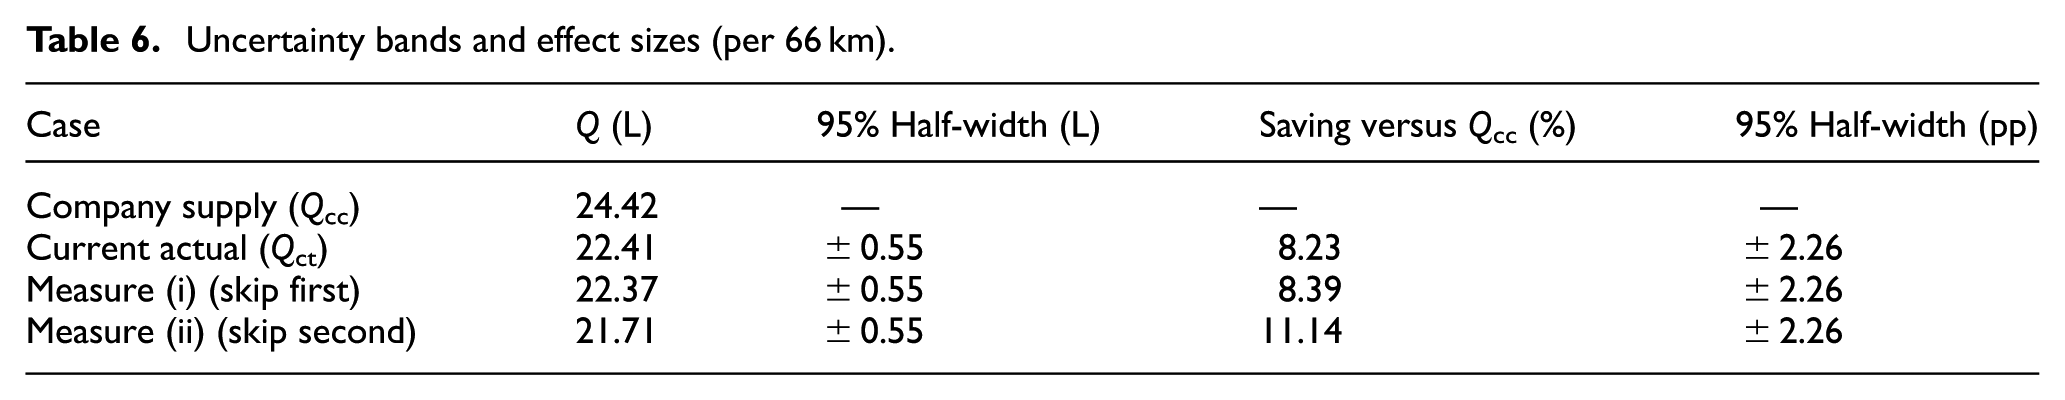
Point estimates and uncertainty: Table 6 summarizes point estimates and 95% half widths
19
(per 66 km):
Uncertainty bands and effect sizes (per 66 km).

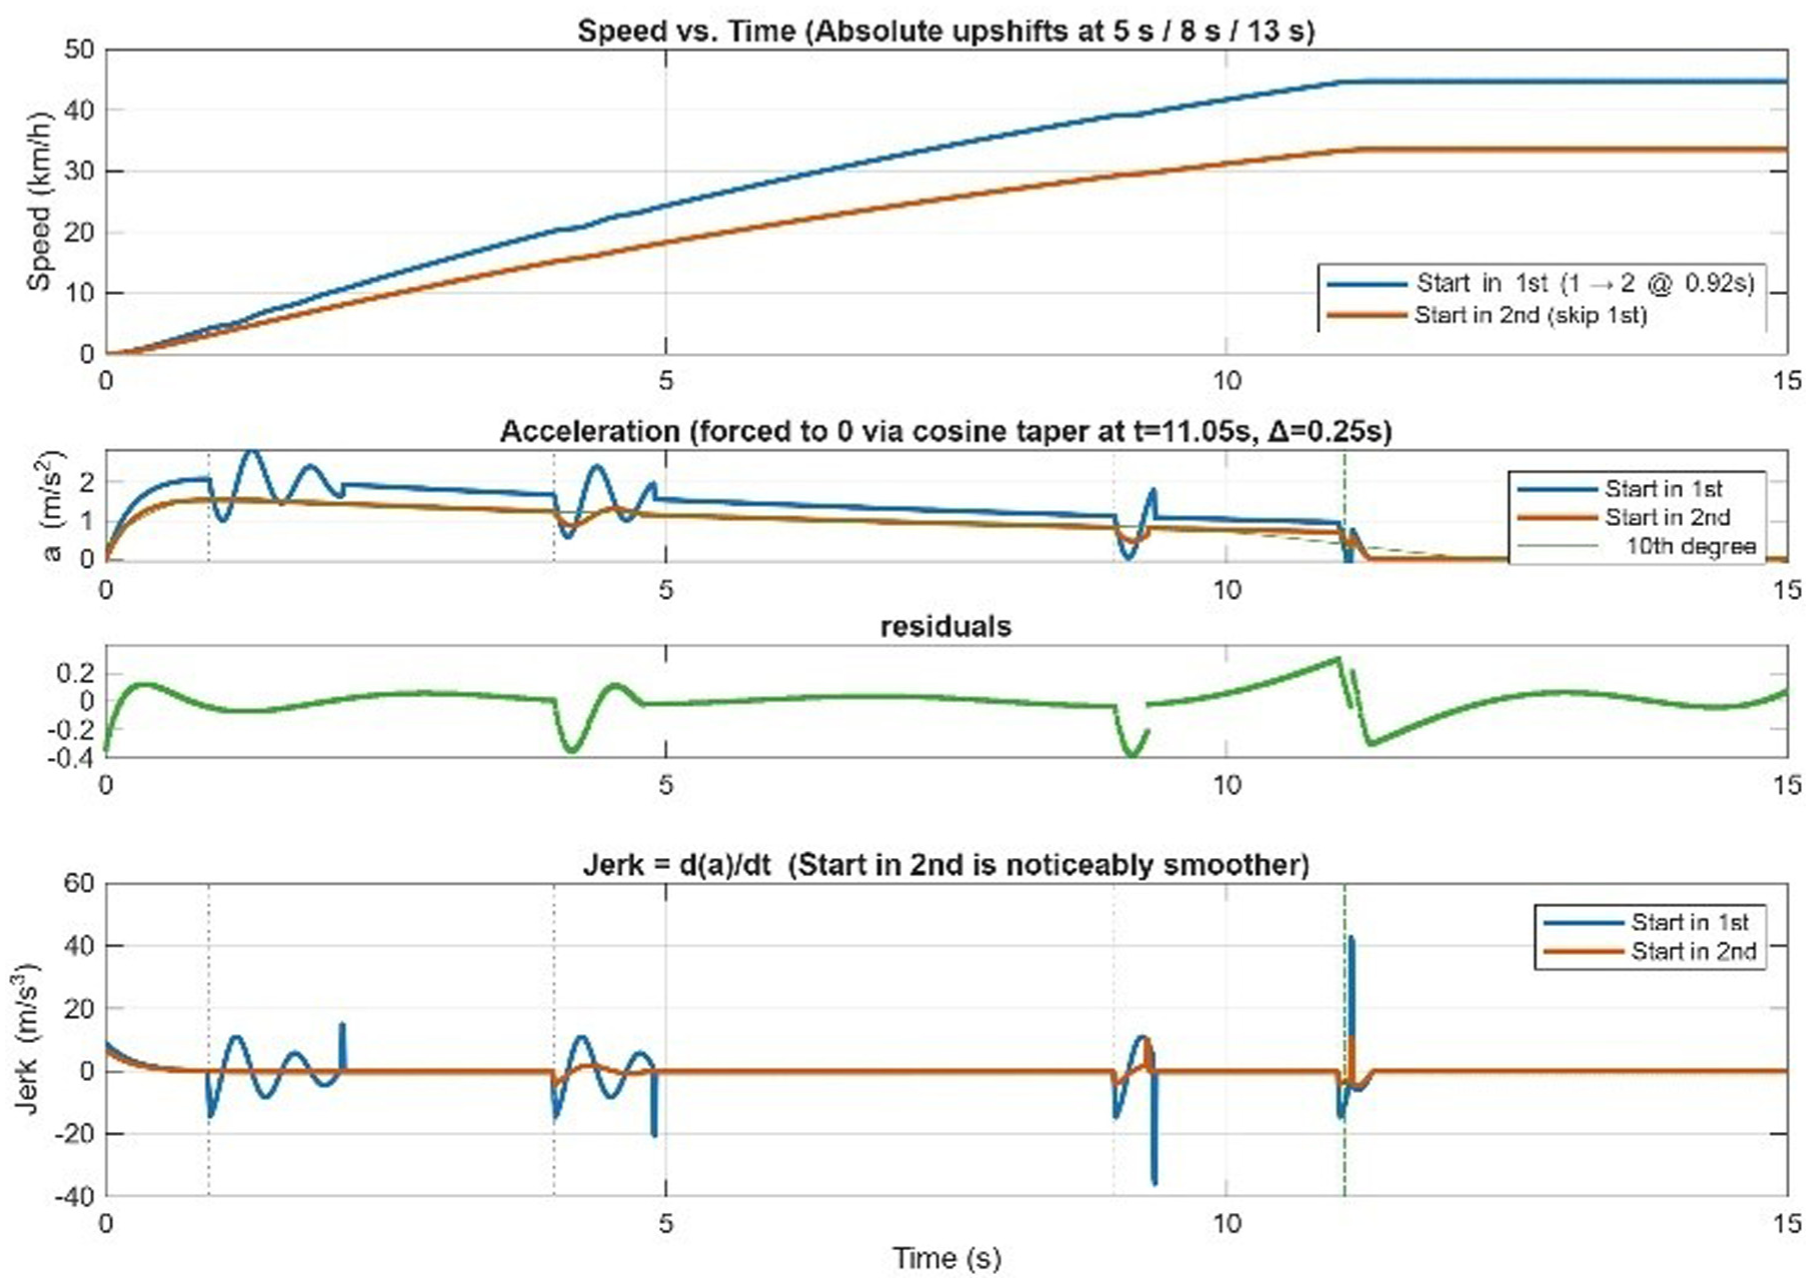
Simulation bus dynamics under different gear-shifting strategies: speed, acceleration, and jerk profiles.
This column chart compares fuel consumption across five cases. The baseline Qcc shows the highest value (24.42 L/66 km). All other cases demonstrate improved fuel efficiency, with reductions ranging from 8.23% to 12.73%. The most significant decrease is seen in Qđm, reaching 21.31 L, indicating the effectiveness of the proposed optimization strategies in reducing fuel usage.
Simulation of the speed, acceleration, and jerk profiles
The simulation results are expected to yield three distinct profiles: vehicle speed, acceleration, and jerk. The speed curve demonstrates a nonlinear growth as the vehicle progresses through gear shifts, with smoother gradients observed when skipping the lower gears. The acceleration profile indicates that when all gears are engaged, noticeable peaks appear during the first → second and second → third transitions, reflecting transient load changes in the powertrain. Conversely, bypassing the first or the first and second gears reduces these fluctuations, resulting in a more uniform acceleration pattern. Simulation setup and results (expanded). Using equation (2) with gear-dependent speed envelopes for Route 30, The authorsimulate speed, acceleration, and jerk profiles under current practice, skipping first gear, and skipping second gear. Figure 5 now shows the simulated traces, with reduced peak acceleration and jerk when lower gears are skipped, consistent with the lower transients and improved fuel economy.
Comparison chart of fuel consumption versus fuel supply.
Shift smoothness model (blip–cut–engage–re-apply)
Each upshift is represented by four phases—throttle blip, torque cut, gear engagement, and throttle re-apply—with raised-cosine shaping to ensure

with baseline:

Which guarantees a(0) = 0 and integrates toward the desired terminal speed (e.g. ∼50 km/h in urban operation).
The envelope for the ith shift centered at time ti is the product of three C1—smooth components (edges shaped by raised-cosine windows) 22 :

Where:
All phase boundaries are thus at least
Parameters and interpretation
Smoothness metrics
The author quantify ride smoothness using RMS jerk and the 95th-percentile jerk 23 :
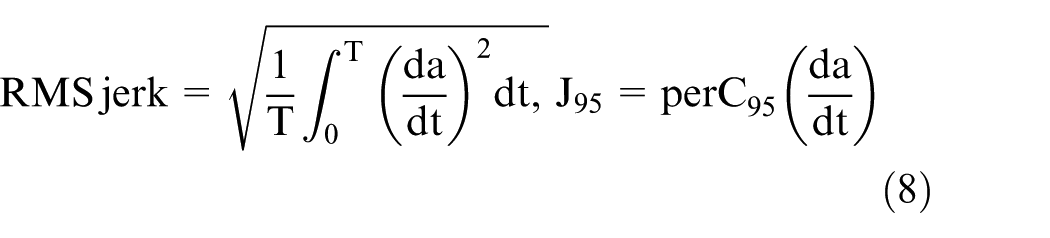
A start-in-second strategy (smaller
Operational implications
(i) Passenger comfort improves via lower jerk (reduced fore–aft sway, less motion sickness, lower risk of balance loss for standing riders); (ii) mechanical loads are attenuated (less driveline lash/chatter; reduced impulsive loads on mounts, couplings, and bushings); (iii) urban efficiency benefits from diminished traction oscillations, supporting modest fuel savings, and reduced tire wear.
The jerk profile, representing the time derivative of acceleration, provides deeper insights into ride comfort. High jerk amplitudes, especially in the first → second gear transition, are strongly associated with passenger discomfort due to sudden dynamic shocks. By omitting the lowest gears, the amplitude of jerk decreases significantly, indicating smoother transitions and improved ride quality. However, this strategy may slightly extend the time to reach cruising speed. Overall, the findings highlight the trade-off between drivetrain performance and passenger comfort, with jerk analysis serving as a reliable metric for evaluating ride smoothness in urban bus operations. The structure of our simple techno-economic estimate (assumptions, unit prices, payback horizon) mirrors typical TEA templates in the energy-systems literature.
External benchmarking. Our observed magnitude of reduction (order of 2%–3% for measure (ii)) aligns with urban-bus studies on driving style and gear-selection/eco-driving previously cited in our reference list,4,9,13,14 which report comparable benefits in dense, stop-and-go routes. The author keep the reference list focused per the journal’s guidance.
Conclusion
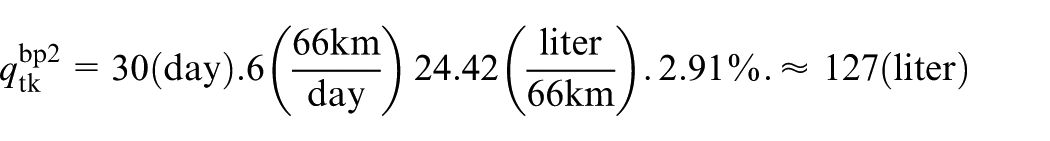
This study presented a practical approach to estimating and improving fuel consumption for the Transinco B80 bus operating on Route 30 in Ho Chi Minh City. By comparing empirical fuel consumption data with the proposed optimization measures. Although constrained by testing conditions and resources, the study still achieved 0.16%–2.91% reductions. Future research will focus on integrating advanced engine technologies—such as electronic fuel injection, turbocharging, and adaptive injection timing—into broader pilot programs to validate long-term effectiveness under real-world conditions.
These findings may provide a foundation for scalable and cost-effective fuel-saving strategies in public bus fleets operating in Vietnam and other developing countries, where improving transport efficiency remains a national priority.
For Transinco B80 buses on Route 30, current practice already saves 8.23% versus the supply baseline, and skip second yields a further +2.9 pp (to 11.14%). This study recommends adopting measure (ii) as a practical, low-cost intervention; measure (i) is marginal. A 3-month paired trial (10–20 round trips/arm) is proposed for long-term validation and operational monitoring.
Footnotes
Acknowledgements
The author would like to express their sincere gratitude to SaigonBus Company for providing access to the operational data of Transinco B80 buses and for their technical support throughout the study. The authors also appreciate the constructive feedback and insights from transportation engineers and field experts who contributed to the validation of the proposed strategies. These contributions were essential in ensuring the practical relevance and accuracy of the research findings.in ensuring the practical relevance and accuracy of the research findings.
Handling Editor: Sharmili Pandian
Funding
The author disclosed receipt of the following financial support for the research, authorship, and/or publication of this article: This study was supported by Van Lang University.
Declaration of conflicting interests
The author declared no potential conflicts of interest with respect to the research, authorship, and/or publication of this article.