
Abstract
If an infrastructure intervention, such as the conversion of a car lane into a dedicated bus lane, decreases automobile accessibility but increases transit accessibility, what is the overall effect on accessibility? To date, no methods have been proposed to evaluate this question. Accessibility research in the transportation and land-use literature has been dominated by unimodal and comparative approaches to analyzing accessibility. Little attention has been paid to quantifying multimodal accessibility or to the interactions between modes, and how these might affect overall accessibility. Moreover, the use of targets for accessibility in planning has been largely ignored. Particularly important to the evaluation of transportation planning outcomes is accessibility to employment, as this is a key element and predictor of urban economic prosperity. This study, building on the work of Alain Bertaud, proposed the multimodal accessibility target or MAT. The MAT provides a more accurate picture of overall (across mode) accessibility to jobs in a city, and can be used to evaluate transportation infrastructure investments. It also provides a target for accessibility that is an easily interpretable indicator that can serve as a goal in accessibility-based transportation planning. A case study of the proposed implementation of a bus rapid transit (BRT) system in Montreal, Canada was used as an empirical example of the use of the MAT. In the case study, predicted multimodal accessibility to employment in the study area (and thereby the MAT) was found to increase with BRT compared with the base case scenario.
Keywords
If an infrastructure intervention, such as the conversion of a car lane into a dedicated bus lane, decreases automobile accessibility but increases transit accessibility, what is the overall effect on accessibility? To date, no methods have been proposed to evaluate this question. It is the purpose of this paper to propose such a measure. Accessibility in transportation is defined as the potential to reach destinations or opportunities that are spatially dispersed ( 1 ). Mobility is defined as the ability to move from one place to another ( 2 ). Both accessibility and mobility are relevant in illustrating how well people can move around a city. The most significant difference between them is that mobility is concerned with the ease with which people can move from one place to another, whereas accessibility is concerned with what can be reached when you arrive. As such, accessibility is intrinsically tied to land use, since measuring accessibility requires knowledge of the location of spatially dispersed opportunities.
Research in accessibility has been dominated by unimodal approaches and comparative analyses of accessibility. As a result of the primarily unimodal nature of accessibility approaches, accessibility measures are not well adapted to evaluating overall (across mode) accessibility. Given the recognized importance and benefits of accessibility, being able to evaluate overall accessibility is important in and of itself. Just as important, if not more so, is that there are accessibility interactions between modes; an increase in infrastructure dedicated solely to automobiles at the expense of buses reduces, ceteris paribus, accessibility to jobs by transit. As a result, adequately evaluating overall accessibility, and particularly changes to accessibility caused by changes in infrastructure, requires the ability to account for these interactions. That approaches have been comparative is to say that they have lacked explicit targets to guide the use of accessibility in planning contexts. Although accessibility is generally considered a good thing, without targets, it is difficult to evaluate to what extent any given level of accessibility is a good thing.
This paper proposes a measure for evaluating accessibility that is both multimodal and includes an explicit planning target. The measure is called the multimodal accessibility target (MAT) and builds on the work of Bertaud ( 3 ). For Bertaud, the most critical aspect of urban transportation planning is to ensure accessibility to jobs, since accessibility to jobs is a key element and predictor of the prosperity of cities. At the same time, because of the effect on accessibility of interactions between modes, accessibility to jobs needs to be evaluated multimodally. The next section of the paper reviews the literature on accessibility in planning and describes the place of a measure like the MAT, which is subsequently proposed. The MAT is then applied in a case study that looks at the planned implementation of a bus rapid transit (BRT) line on a major commuting corridor in Montreal, Canada. The results of the application of the MAT in this context are described and discussed, and the paper is brought to a close with some concluding remarks and suggestions for areas of future work.
Literature Review
The analysis of urban transportation systems through the lens of accessibility has become the dominant paradigm in the academic planning literature (and increasingly in practice) since Hansen first developed his “accessibility model” in 1959 ( 1 ). Although the roots of the accessibility paradigm go quite far back, this new paradigm really has its roots in the 1990s with two landmark papers by giants in the field Cervero ( 4 ) and Ewing ( 5 ). In the years between Hansen’s accessibility model and the mid 1990s, the accessibility literature was confined primarily to the development of increasingly complex accessibility measures ( 6 ). The shift toward the accessibility paradigm involved a move away from the implicit use of mobility measures in planning to the explicit use of accessibility measures ( 7 ). Whereas mobility measures were concerned with the ease with which one could go from one place to another in a city (e.g., travel time to the central business district), accessibility measures were concerned more with what opportunities could be accessed once destinations were reached.
This represented a paradigm shift for two reasons. The first was simply that it led to the use of different metrics in evaluating transportation system performance. The second was that it valorized active modes relative to the automobile and central cities relative to the suburbs. Whereas previously, central cities were considered congested and inconvenient, the paradigm shift led to central cities being thought of as having high accessibility, an accessibility that did not require (polluting) automobiles at all. This paradigm shift involved an explosion of research primarily concentrating on the calculation, evaluation, and comparison of accessibility for different modes ( 8 – 11 ), and how these analyses could be used in the transportation planning process ( 12 , 13 ). More recently, accessibility research has become concerned with inequities in accessibility by disadvantaged groups ( 14 , 15 ) to different types of amenities such as healthcare facilities ( 15 – 17 ), greenspace ( 18 , 19 ), and grocery stores ( 16 , 20 ).
Despite the amount and breadth of research on accessibility in transportation planning, two characteristics of this literature stand out. The first is that measures and analyses are unimodal. That is, accessibility measures ultimately represent measures of the opportunities that can be accessed by a given transport mode ( 21 , 22 ). Even when multiple modes are considered or compared, typically transit compared with automobile (4, 23–25), calculations for accessibility by different modes are done independently. (It should be mentioned that the possibility of multimodal individual accessibility measures has opened with the development of logsum-based space–time accessibility measures [26, 27].) Second, accessibility is evaluated comparatively and/or relatively. That is, more accessibility is considered better, but there is no target or objective standard on which to evaluate whether a given amount of accessibility is good or not ( 28 ). Note that although there are normative considerations here, there are no standards or targets used to evaluate the amount of accessibility.
Recently, however, work inspired from the urban economics literature has appeared that recognizes and has begun to remedy these two weaknesses in the current literature ( 3 ). Three concepts are critical in Bertaud’s thinking. First, he considers the most important function of cities (indeed their raison d’être) to be as “labor markets,” by which he means the jobs within a city accessible by a worker. This is a city’s most important function because the more jobs accessible to the workers within a city, the more prosperous a city can be ( 29 ). As a result, he reasons that transportation planning should seek to maximize the proportion of jobs within a city that are accessible to the workers of that city; what he calls the “effective” labor market. Second, transportation planning and the prioritizing of effective labor markets needs to be considered in relation to accessibility (and not mobility). Third, the prioritizing of labor markets in transportation planning needs to be done across modes. These latter two points are important because there are interactions between modes. An increase in infrastructure dedicated solely to automobiles at the expense of buses, for example, reduces ceteris paribus accessibility to jobs by transit. As a result, an analysis of the effects of changes in the transportation system, particularly when the changes imply an interaction between modes, needs to be evaluated across modes. Based on these three concepts, Bertaud proposed an accessibility measure that can be used in the evaluation of effective labor markets.
In this study, we built on Bertaud’s work by using his ideas and further developing his accessibility measure to propose a multimodal accessibility measure with a well-defined standard of evaluation that can be used in any city. After presenting the measure, we demonstrate how it can be used through a case study.
Multimodal Accessibility Target
As discussed, the measure we propose is inspired by Bertaud’s ideas and builds on his proposed accessibility measure. As it turns out, Bertaud’s measure has a slightly confusing name for those familiar with the accessibility literature in transportation planning. It is called the city mobility index or CMI. The name is confusing because although it refers to mobility in the name, it is in fact an accessibility measure (see Equation 5.3 in Bertaud’s Order Without Design: How Markets Shape Cities [ 3 ]):

Here the CMI is denoted as M. The letter i indexes census tracts (or traffic analysis zones). We use the term “zone” hereafter to replace census tracts and traffic analysis zones. Ai represents the number of jobs accessible (within a given [cut-off] period of time, e.g., 60 min) from zone i; Pi is the active (working age) population of zone i; and P is the total active population of the region. As such, one can see that the CMI is the active-population-weighted average of the number of jobs accessible to an average working-age person within a given period of time by a given mode in a region. It is thereby what would be considered an accessibility-, and not simply a mobility measure, in the transportation planning literature. To account for congestion, travel times between zones for peak period (rush hour) travel should be used. (Incidentally, the same measure has been used by Grisé et al. [ 30 ] although apparently independently of Bertaud.)
Another aspect critical to Bertaud’s perspective is the potential effect on the accessibility of one mode by another, such as the allotment of roads to automobiles at the expense of transit. At the same time, given that the CMI concentrates on only one mode at a time, it is necessary to modify M. To be able to use the CMI in a multimodal context, it is necessary to perform two operations: first, to account for the effects of different modes; and second, to combine accessibility across the different modes. To do this, it is necessary to weigh mode shares and apply a sum across the different modes as illustrated in Equation 1.

where Mm is the CMI for mode m, and Wm is the mode share of mode m. Mode is indexed over µ, the total number of modes considered. In the case of a BRT implemented at the expense of lanes of automobile traffic, any overall change to accessibility for affected modes will be captured by the multimodal accessibility indicator or the MAI. The measure allows the quantification of overall accessibility across modes as well as the ability to capture the interdependencies in accessibility across modes. (Equation 1 is also ultimately a reduced version of the theoretical accessibility measure proposed by Levinson [
31
]. It is reduced in the sense that Equation 1 sums over mode share whereas Levinson’s measure also sums over activity type and time of day.) It is necessary to weigh the CMI for each mode to be able to aggregate results but not double count effective labor markets. As a result,
The MAI is a simple tool that assesses the average number of jobs accessible to the individual across all modes. The MAI would be useful for comparing multimodal accessibility values across different cities. However, it is not exactly a quantifiable target. As a result, we propose the following modification resulting in what we call the MAT described in Equation 2,

Here, the MAI represents the value obtained from Equation 1. To get Equation 2, the MAI has been divided by J, which represents the total number of jobs in the region. The MAT represents the mode-weighted average of the jobs accessible across modes. This measure is unitless and bounded by zero (0) and one (1). Like the MAI, it is also separable so that it can be used to consider only modes that are likely to experience interactions as a result of an intervention in the transportation system. A MAT. value of 1 would imply that for an average working-age resident, all jobs within the region would be accessible by all modes. A MAT value of 0 would imply that for the average working-age resident, no jobs would be accessible. It is expected that MAT values will fall between these extremes in most practical cases. It is possible that very small cities could have MAT values of 1, although a value of 0 is in all probability impossible in any city. Naturally, according to Bertaud’s perspective, the higher the value of the MAT the better, and indeed a MAT of 1 should be a central goal (or indeed target) of transportation planning. The MAT is a useful measure because it can be used to capture interactions in accessibility across modes. As such, the MAT is suitable and appropriate to calculate the multimodal effects of transportation system interventions and is most appropriate for a region or corridor.
Analysts may also be interested in a disaggregate analysis by zone. This tool is useful to analyze changes at a smaller scale than the region. This can be done using Equation 3, the disaggregate multimodal measure or DMM.

The DMM provides the proportion of jobs within a region that would be accessible across all modes from a given zone, i. It is the zonal disaggregate of the MAT and is suitable for finer-grained zonal analyses. Like Bertaud’s Equation 5.3 ( 3 ), Ai represents the number of jobs accessible within a given cut-off (period of time) such as 60 min from zone i. As in Equation 1, J is the total number of jobs in the surrounding region. Like Equation 2, Wm is the mode share of mode m. The next section demonstrates use of the MAT and the DMM in a case study.
Case Study and Area
The case study of the MAT was applied to a planned project in the Greater Montreal region, in Québec, Canada. Montreal is Canada’s second largest census metropolitan area, with a population of just over 4 million people as of the 2016 census ( 32 ). Montreal has one of Canada’s densest urban forms, whereas the surrounding suburbs have densities similar to those of other Canadian suburbs. The transportation system in Montreal relies on a multitude of different transport modes, including commuter rail, the metro network, buses, and highways. Future public transit projects include an extension to the Blue metro line, the REM (Réseau Express Métropolitain) light rail system, and the Pie-IX BRT.
The Pie-IX BRT is a future BRT project that will be implemented in the cities of Montreal and Laval, Québec. The project consists of dedicated bus-only lanes in the center of the road Pie-IX (Pius the 9th), an important commuter corridor. A map of the Pie-IX BRT corridor in its context in the region of Greater Montreal can be found in Figure 1. The BRT will involve priority traffic signals, and 21 stops along 13 km of the Pie-IX corridor ( 33 ). The Pie-IX BRT will connect to the Pie-IX metro station on the Green Line of the city’s underground metro, and eventually to the future Pie-IX metro station of the city’s Blue Line expansion. To evaluate the accessibility effects of the BRT and only the BRT, the future planned extension of the Blue Line is not included in the BRT scenario.
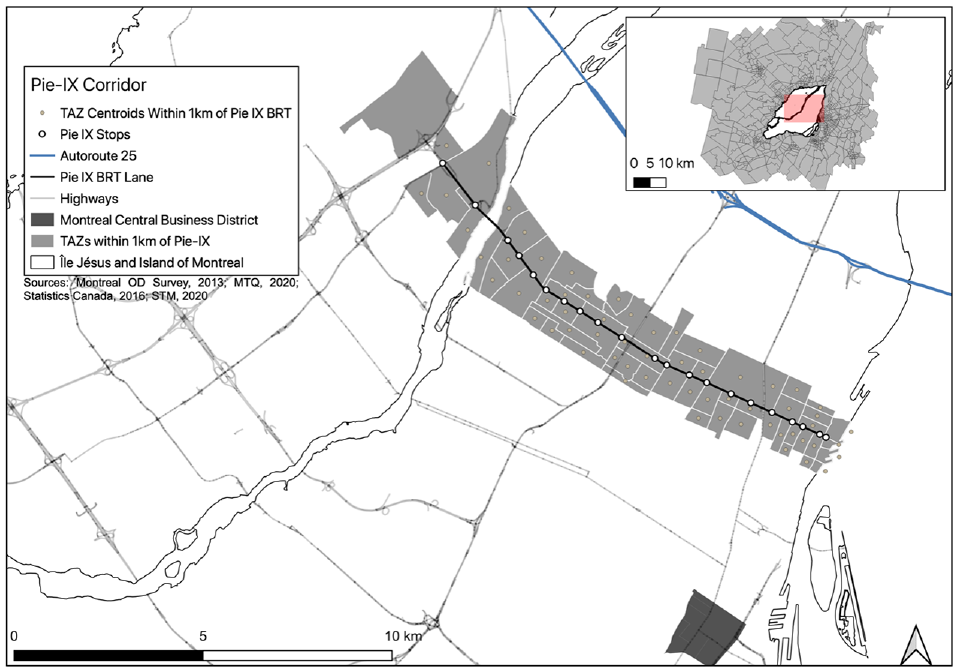
Pie-IX BRT corridor.
In the analysis that follows the MAI will be calculated and compared across base- and BRT scenarios for the morning peak period. Since this is a BRT line, the BRT scenario involves some reductions in capacity on the road network available to automobiles, although not as much as one might expect at first. The reason is that there is already an inbound (northwest-to-southeast) reserved lane for buses in the morning peak period. That said, the BRT scenario will involve a decrease from three to two inbound and outbound automobile lanes at the northwestern-most reach of the corridor on the Island of Montreal (See Figure 1). In addition, as part of the accommodations for BRT infrastructure on the bridge between Montreal and Laval, there will be an additional lane of traffic available to automobiles inbound on the bridge from Laval to Montreal (See Figure 2).
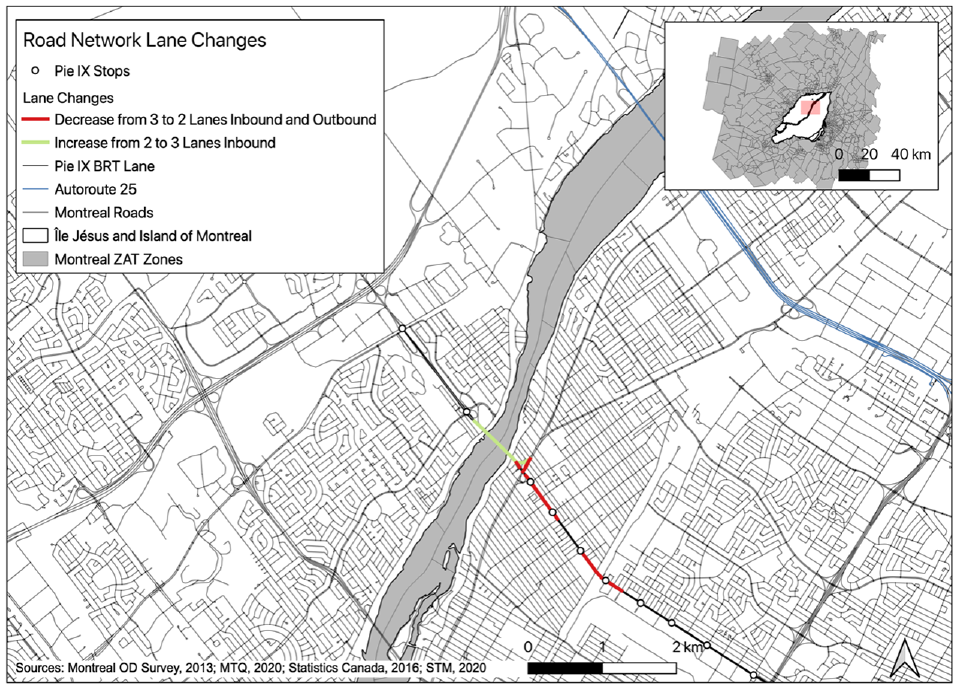
Road network lane changes from Pie-IX implementation.
Figure 3 shows the projected changes in vehicle flows resulting from the implementation of the BRT resulting from the Québec Ministry of Transportation’s forecasting model (see the section on data used for more detail). In the figure, we can see that there is a projected diversion of inbound automobile through-traffic from the arterial network and toward the A25 highway parallel and to the northeast of the Pie-IX corridor. This is projected to reduce intra-island and inbound automobile travel times that will have significant consequences for automobile accessibility, as we will see later.
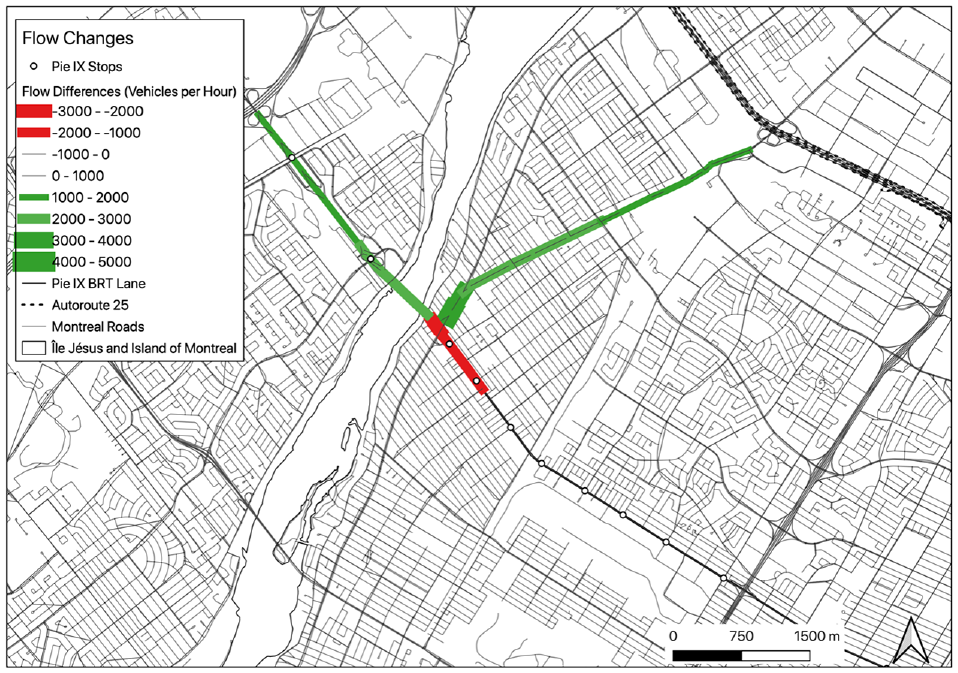
Predicted vehicle flow changes in Pie-IX BRT scenario.
These changes to both the transit and road networks make the Pie-IX BRT project a good candidate to assess changes in multimodal accessibility in the context of interventions in transportation infrastructure. It is thus also a good candidate to demonstrate the use of the MAI. Since the project is only expected to affect automobile and transit modes, and since the MAI is separable, the analysis concentrates only on these two modes. It would of course be possible, however, to include all modes in such an analysis if desired.
Data Used
To be able to calculate the MAT for the base- and BRT scenarios for the implementation of the Pie-IX BRT corridor, the following data are needed. The first is the delimitation of the urban region and a zone system. Second are zone-to-zone travel times by mode for both the base- and BRT scenarios. Third is the total zonal working-age population and the number of jobs. Finally, morning peak period mode shares are required to weight the modal effective labor market measures. The data used for these came from several different sources.
The delimitation of the region of Greater Montreal and the traffic analysis zone (TAZ) system were provided by the provincial ministry of transportation’s (Transports Québec) Transportation System Modeling Directorate. Zone-to-zone travel times for the base- and BRT scenarios were also provided by Transports Québec based on their regional transportation model calibrated to the most recently available (2013) regional origin–destination (O-D) survey. The zone-to-zone travel times were based on modeling for the morning peak period from 8 to 9 a.m. in the horizon year, 2021.
TAZs with centroids within 1 km of the Pie-IX BRT line were selected to define the corridor. From here, the results calculated were narrowed to the jobs accessible from the TAZs within the Pie-IX corridor, illustrated in Figure 2.
Zonal population numbers were derived from the most recently available (2013) regional (quinquennial) O-D survey. The Montreal O-D survey is one of the longest-running O-D surveys in the world and has been conducted roughly every 5 years since 1970 ( 34 ). It surveys between 3% and 5% of households in the region of Montreal. The residential location of (expanded) individuals was used to derive zone-level population figures.
Total zonal employment was derived from data provided by the Québec provincial government “Data Consortium.” The Data Consortium distributes data to its members, which it orders from Statistics Canada and that relate to the location of employment in Québec. The data themselves are derived by Statistics Canada from the federal census that is conducted every 5 years ( 32 ). The data used in this analysis came from the 2016 census. Since census geographic boundaries do not perfectly overlap with the zonal boundaries of the Transports Québec transportation model, and since there are somewhat fewer census zones (i.e., census tracts and census subdivisions) than TAZs, it was necessary to distribute census employment figures to the TAZs.
Owing to slight differences in the underlying geometries of the TAZ and census zone systems, it was not possible to simply intersect the zone systems. As a result, a list of census zones was visually and manually attributed to each TAZ. Once that was done, the Python programming language using the Pandas and Geopandas libraries was used to attribute census jobs to the TAZs. The pseudo code for this is as follows: For each census zone i: Count the number of TAZs with which the census zone overlaps. Divide the number jobs in the census zone by the number of TAZs with which the census zone overlaps, call this Average Census Zone Jobs (Ai) for census zone i. For each TAZ
j
: Create a list of the Census Zones with which the TAZ overlaps. Calculate the sum of Ai for all the census zones with which the TAZ overlaps, call this Jj. Jj is the number of jobs attributed to each TAZ.
Morning peak period mode shares for the Greater Montreal region, as well as for its municipal sectors, were obtained from documentation on the 2018 O-D survey ( 35 ). The municipal sector was the sampling stratum used in the O-D survey.
To derive the mode share values for the Pie-IX corridor specifically, the traffic analysis zones were matched to the corresponding municipal sectors as outlined by the 2018 Montreal O-D survey. The mode shares were then multiplied by the respective population in each traffic analysis zone. Then, the individual traffic analysis zones in the corridor were summed to get the mode shares for the Pie-IX corridor. The following section describes how these data were used to calculate the MAT in the base- and BRT scenarios.
Results
This section goes through the different steps of the calculation of the MAT as described in the section on the multimodal accessibility target. We begin with the results for the region of Montreal as a whole, and then consider the Pie-IX corridor separately.
Results for Greater Montreal
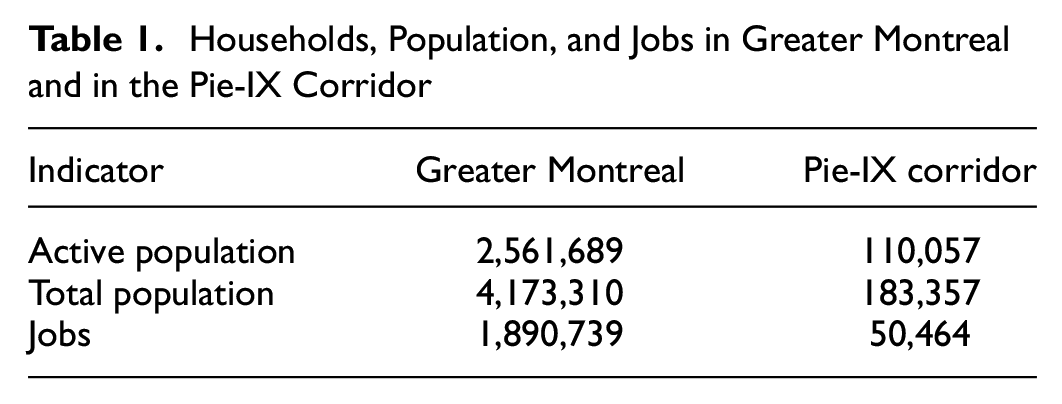
Table 1 summarizes employment and population numbers for Greater Montreal as well as for the Pie-IX corridor. There are roughly 1.8 million households and as can be seen from Table 1, with 4.2 million people and 1.9 million jobs in the entire region.
Households, Population, and Jobs in Greater Montreal and in the Pie-IX Corridor
The data in Table 1, as well as the data described in the previous section were then used to calculate Bertaud’s “M” or his CMI (i.e., Equation 5.3). This represents the number of jobs accessible to the average working-age individual in the region broken down by mode. This is shown for the two scenarios as well as for three different time cut-offs for the cumulative accessibility calculation. The results of these calculations are given in Table 2.
Bertaud’s CMI: (M) Number of Jobs Accessible to the Average Individual for the Montreal Region
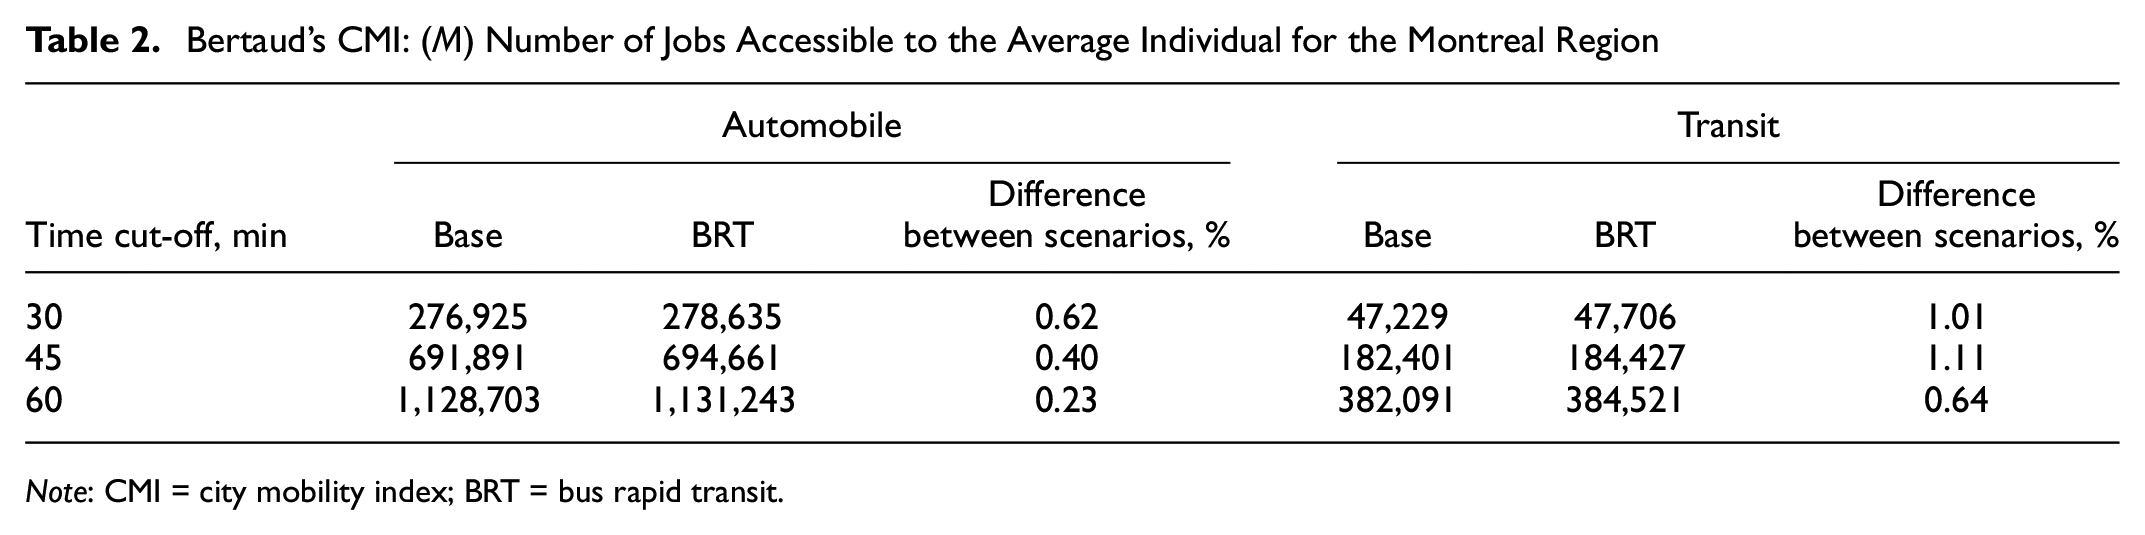
Note: CMI = city mobility index; BRT = bus rapid transit.
The BRT scenario was predicted to result in small increases in average accessibility to employment for both examined modes of travel. The (perhaps surprising) increase in automobile accessibility was caused by on-island decreased travel times (and thereby increased accessibility). These were caused, as mentioned above, because of the diversion of inbound automobile through-traffic from the arterial network, caused by the decreased inbound capacity on arrival on the Island of Montreal. This is illustrated in Figure 3 in the section covering the case study and area. This inbound through-traffic was diverted toward the A25 autoroute (see Figure 1) parallel to the Pie-IX corridor but further toward the northeast. Transit accessibility (as should be expected) also increased in the BRT scenario. Naturally, M increased for both modes as the time cut-off for the accessibility calculations increased. (It is worth mentioning here that the transit M values were slightly lower than those reported in research by Grisé et al. [ 30 ] because they were based on all of Greater Montreal and not just the Island of Montreal.)
Once M, the number of jobs accessible to the average individual, was calculated, the MAI could be calculated. The MAI was calculated by multiplying M by the mode share weights and summing the M values across the different modes. Table 3 shows the results of multiplying M by the mode share weights and summing the values across the mode shares. Based on the Montreal O-D survey, the morning-peak automobile mode shares for the Greater Montreal region represented 64.7% of trips and transit represented 20.6% ( 35 ).
MAI and MAT for Entire Montreal Region
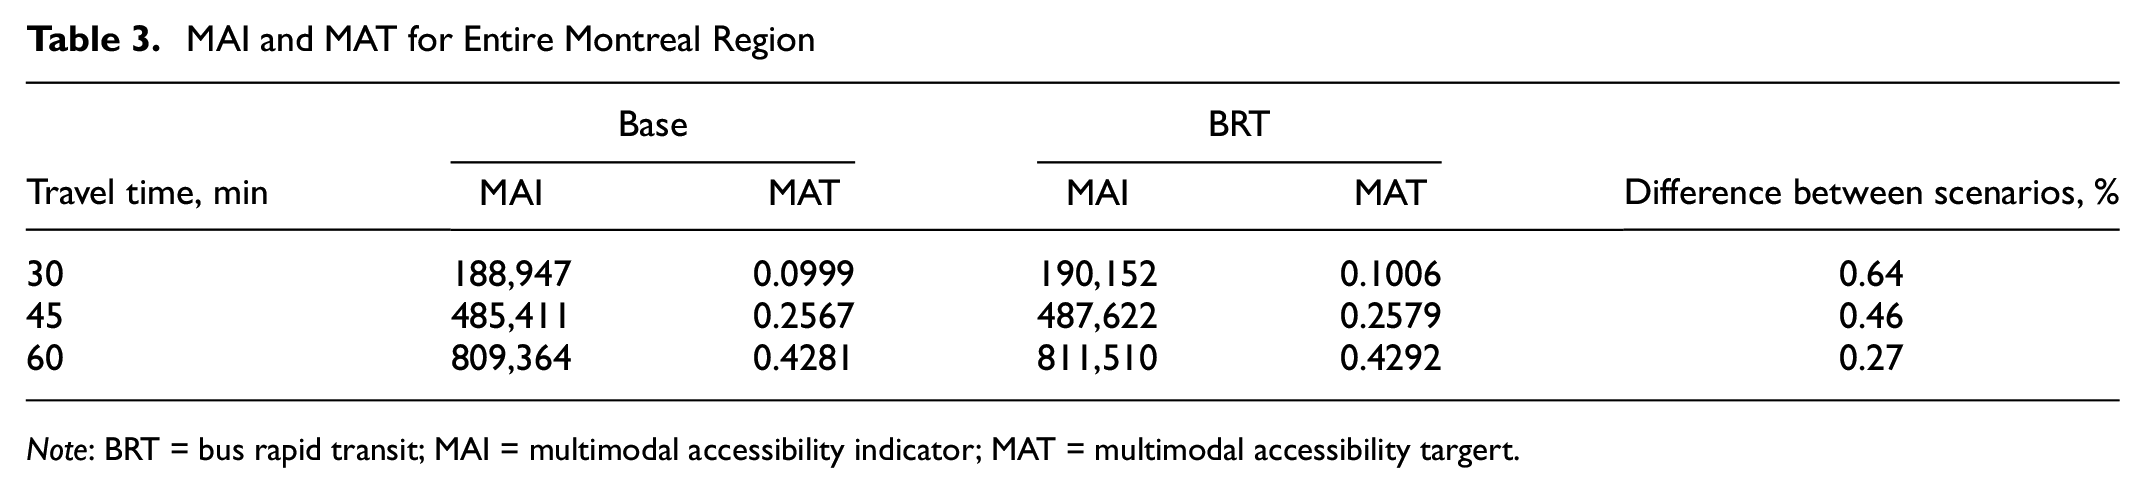
Note: BRT = bus rapid transit; MAI = multimodal accessibility indicator; MAT = multimodal accessibility targert.
Table 3 also includes the MAT values for the entire Montreal region. The percent differences between the MAI- and the MAT values were identical. The MAT for the two scenarios showed that at every temporal interval, the scenario with BRT had greater multimodal accessibility to employment, with maximum MAT values of around 0.43 in both cases. As a result, we can say that about 43% of jobs were accessible after the implementation of the Pie-IX BRT.
Results for Pie-IX Corridor
The aforementioned steps were then used to calculate the results for the Pie-IX corridor, where the effects of multimodal accessibility were more pronounced. Table 1 summarizes the employment and population numbers used for the corridor analysis. This table illustrates how there were roughly 50,000 jobs within 1 km of the Pie-IX BRT and that the active population was roughly 110,000. Bertaud’s M (his CMI [ 3 ]) was then calculated for the corridor and is illustrated in Table 4.
Bertaud’s CMI: (M) Number of Jobs Accessible to the Average Individual for the Pie-IX Corridor
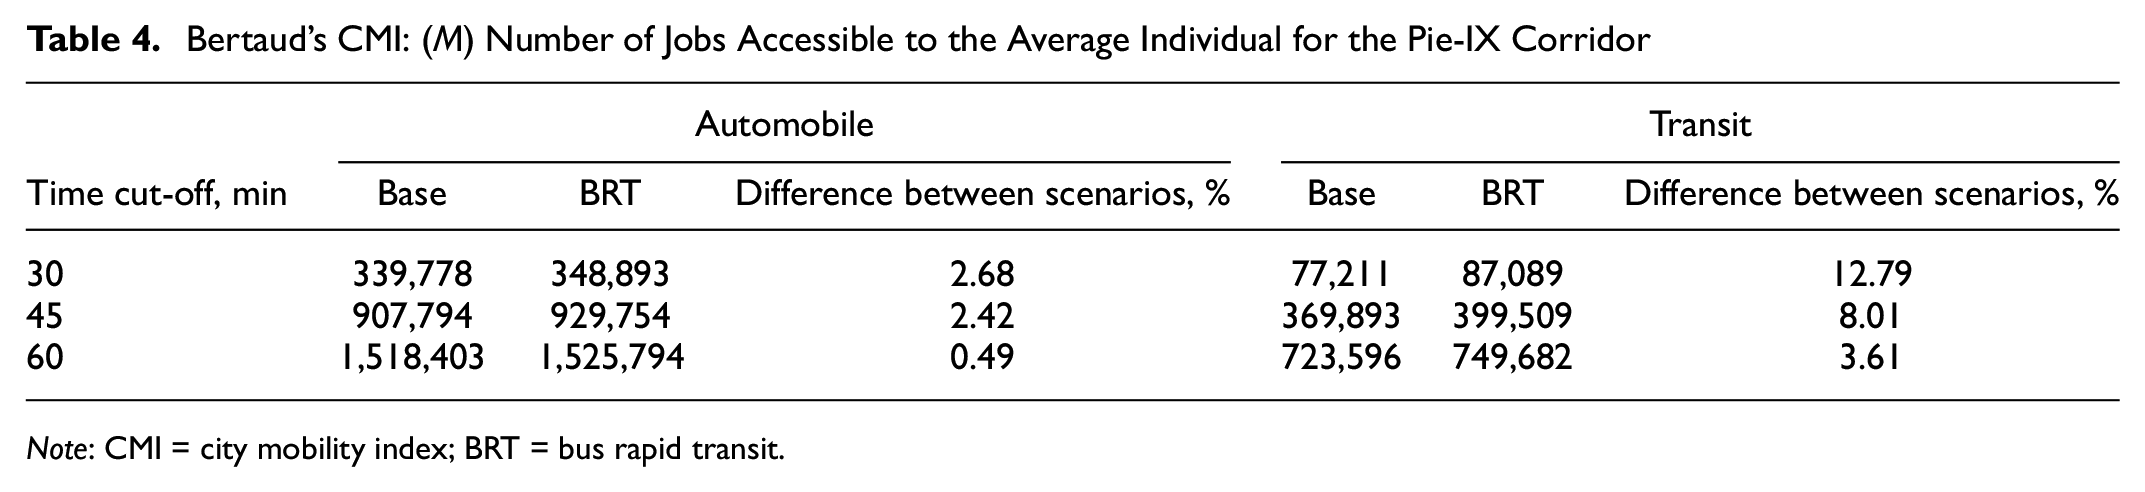
Note: CMI = city mobility index; BRT = bus rapid transit.
The Pie-IX corridor is relatively centrally located, and this explains its higher accessibility to jobs for both modes compared with the region. This difference can be seen by comparing the results of Tables 2 and 4. As in the case for the region as a whole, implementation of the BRT was estimated to result in increases in average accessibility to employment. The reasons for the increase in jobs accessible by automobile and transit were the same as for the region as a whole. At the same time, the increases in accessibility were more pronounced for the corridor than for the region, especially for transit. This can be seen in in Table 4, which shows the number of jobs accessible to the average individual within 30 min by transit increasing by 12.79% with the BRT. This was significantly higher than for the region as a whole, where at the same cut-off time there was an increase of only 1.01%. For jobs accessible by transit in 45 min, in the corridor, this number increased by 8.01% with BRT. Once again, this was a significant difference, as Table 2 has a result of 1.11% for the same time interval. These relatively large increases in transit accessibility in the corridor relative to the region made sense, since it is the corridor that is most affected by the BRT implementation.
With M calculated, the MAI values could be calculated. The results of this calculation for the Pie-IX corridor can be found in Table 5. Based on the zonal population numbers, and the municipal sectors outlined in the O-D survey, morning peak period automobile mode share was 51.7% and transit mode share 31.9% of the corridor’s trips ( 35 ). Compared with the Montreal region, transit mode share was 11% higher in the corridor.
MAI and MAT Values for the Pie-IX Corridor
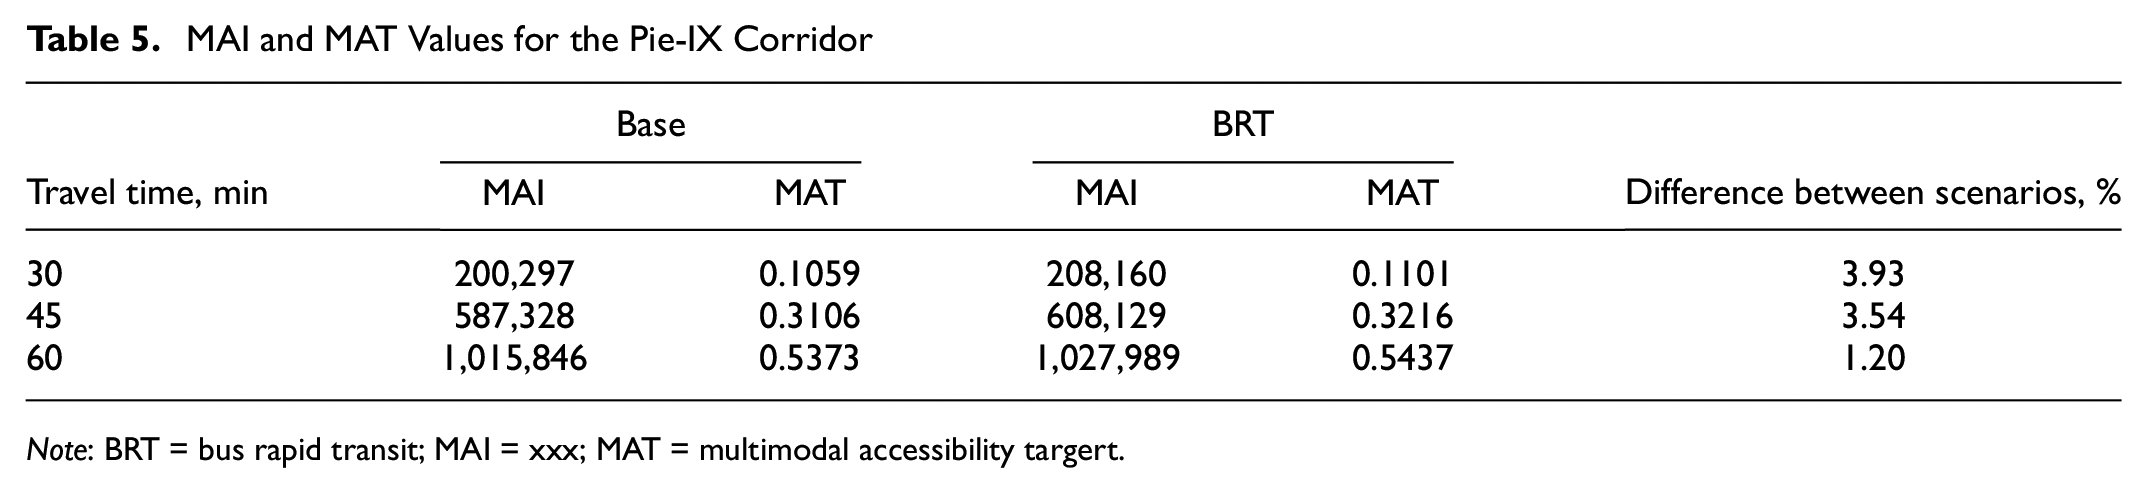
Note: BRT = bus rapid transit; MAI = xxx; MAT = multimodal accessibility targert.
The MAI for the two scenarios showed that at every temporal interval, the scenario with BRT had greater multimodal accessibility to employment. With the MAI, it was also possible to calculate the MAT (Table 5). With BRT, at a 30-min interval, the proportion of jobs accessible climbed by 3.93%. At the 45-min interval, the proportion of jobs accessible increased by 3.54%. The effects were smaller at the 60-min cut-off at which the proportion of jobs of jobs increased by 1.20% from 53.73% to 54.37%.
Although the MAI and MAT are aggregate measures for either an entire region or a corridor, neither of these measures are suitable for cartographical analysis. The DMM (Equation 3) on the other hand is. Figures 4 to 6 show DMM disaggregated percent changes in multimodal accessibility by zone between the BRT and base scenarios.
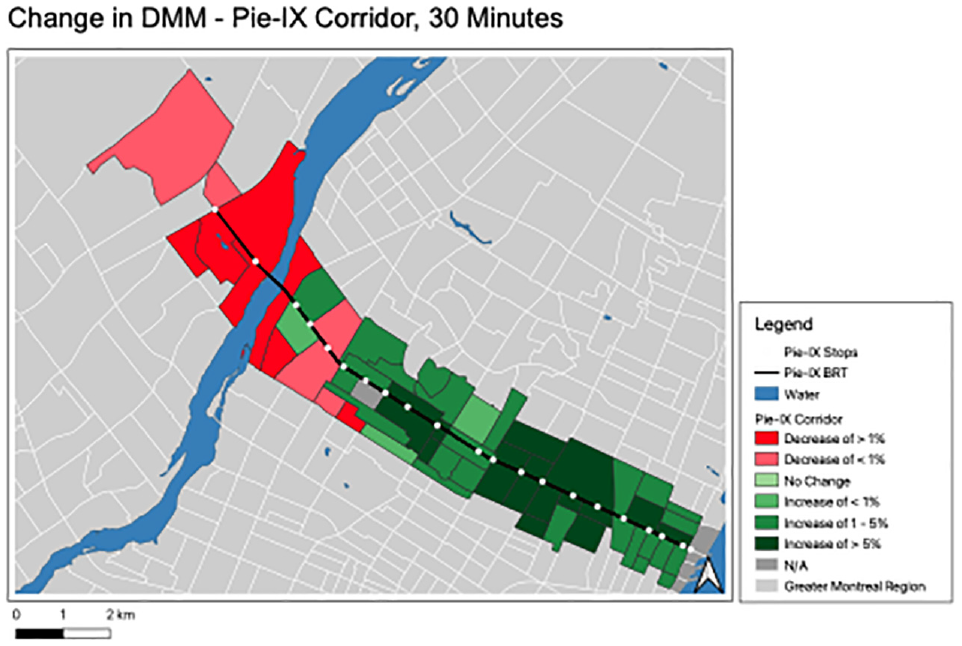
Changes in DMM values (BRT–base case) for TAZs within 1 km of Pie-IX for 30-min interval.
Figures 4 and 5 illustrate percent changes in DMM for 30- and 45-min intervals. In both these figures, it can be seen how there are small decreases to the DMM in Laval (Île Jésus), with larger decreases at 30-min, and some small gains at 45-min. These results imply that multimodal accessibility decreased in some TAZs in Laval as a result of the implementation of the BRT. These decreases in multimodal accessibility, illustrated in Figure 6, had two sources. The first is that the reduction in southbound automobile capacity (see the section on case study and area) also reduced automobile accessibility. Second, there was also a multimodal effect that can be observed. In Laval, there was a high percentage of trips made using cars. In fact, 71.8% of work trips were made by automobile, and only 21.9% of the population used transit to get to work. As a result, the higher automobile mode share amplified the decrease in automobile accessibility and thereby the decrease in DMM values.
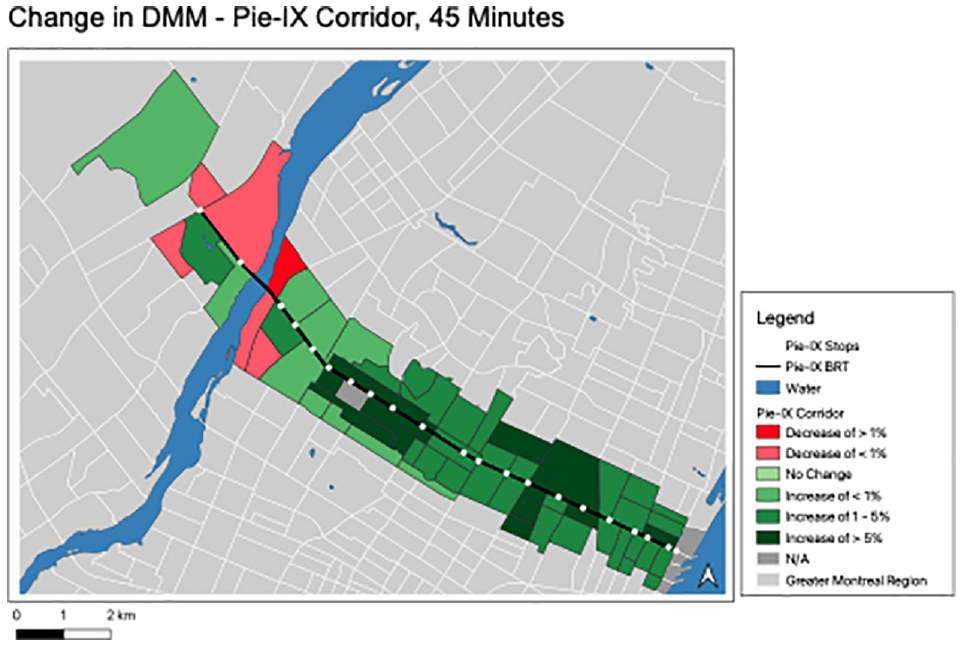
Changes in DMM (BRT–base case) for TAZs within 1 km of Pie-IX for 45-min interval.
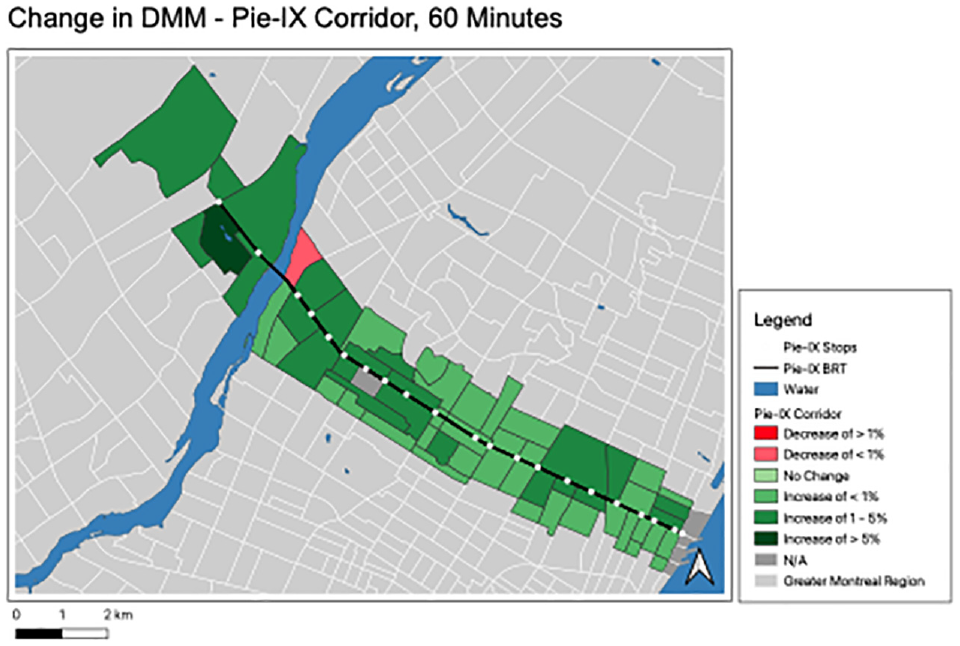
Changes in multimodal accessibility (BRT–base case) for TAZs within 1 km of Pie-IX for 60-min interval.
Toward the southern end of the corridor, on the Island of Montreal and southeast of the automobile capacity reductions, DMM values were unchanged or increased. This was because accessibility for both modes in these zones had increased, as explained. As a result, the multimodally weighted DMM necessarily increased. The trends presented in the disaggregated measures matched the aggregate results of Table 5, which illustrated the slight increase in aggregate accessibility across the corridor.
Sensitivity Analysis
A sensitivity analysis was completed to understand how small mode share changes along the TAZs of the Pie-IX corridor would affect the MAI- and corresponding MAT values. The Pie-IX corridor TAZs remained the same, including all TAZs with centroids within 1 km of the Pie-IX BRT. Mode shares were altered in 0.1% increments, increasing the transit mode share and decreasing the automobile mode share up to a difference of 0.5% from the original mode shares of the corridor. The MAI, as expected, decreased with each increase of the transit mode share. Despite the improved travel times by both automobile and transit along the Pie-IX corridor, fewer jobs could be reached by public transit than by driving from the corridor, on average. As the sensitivity analysis assumed an equivalent change in automobile and transit mode shares, and the decrease of automobile share led to a loss of accessibility that was larger than the gain in transit mode share and accessibility, the overall MAI and consequently MAT decreased marginally with the loss of automobile mode share and the gain of transit mode share. Table 6 presents the results of the sensitivity analysis.
MAI and MAT Values for the Pie-IX Corridor
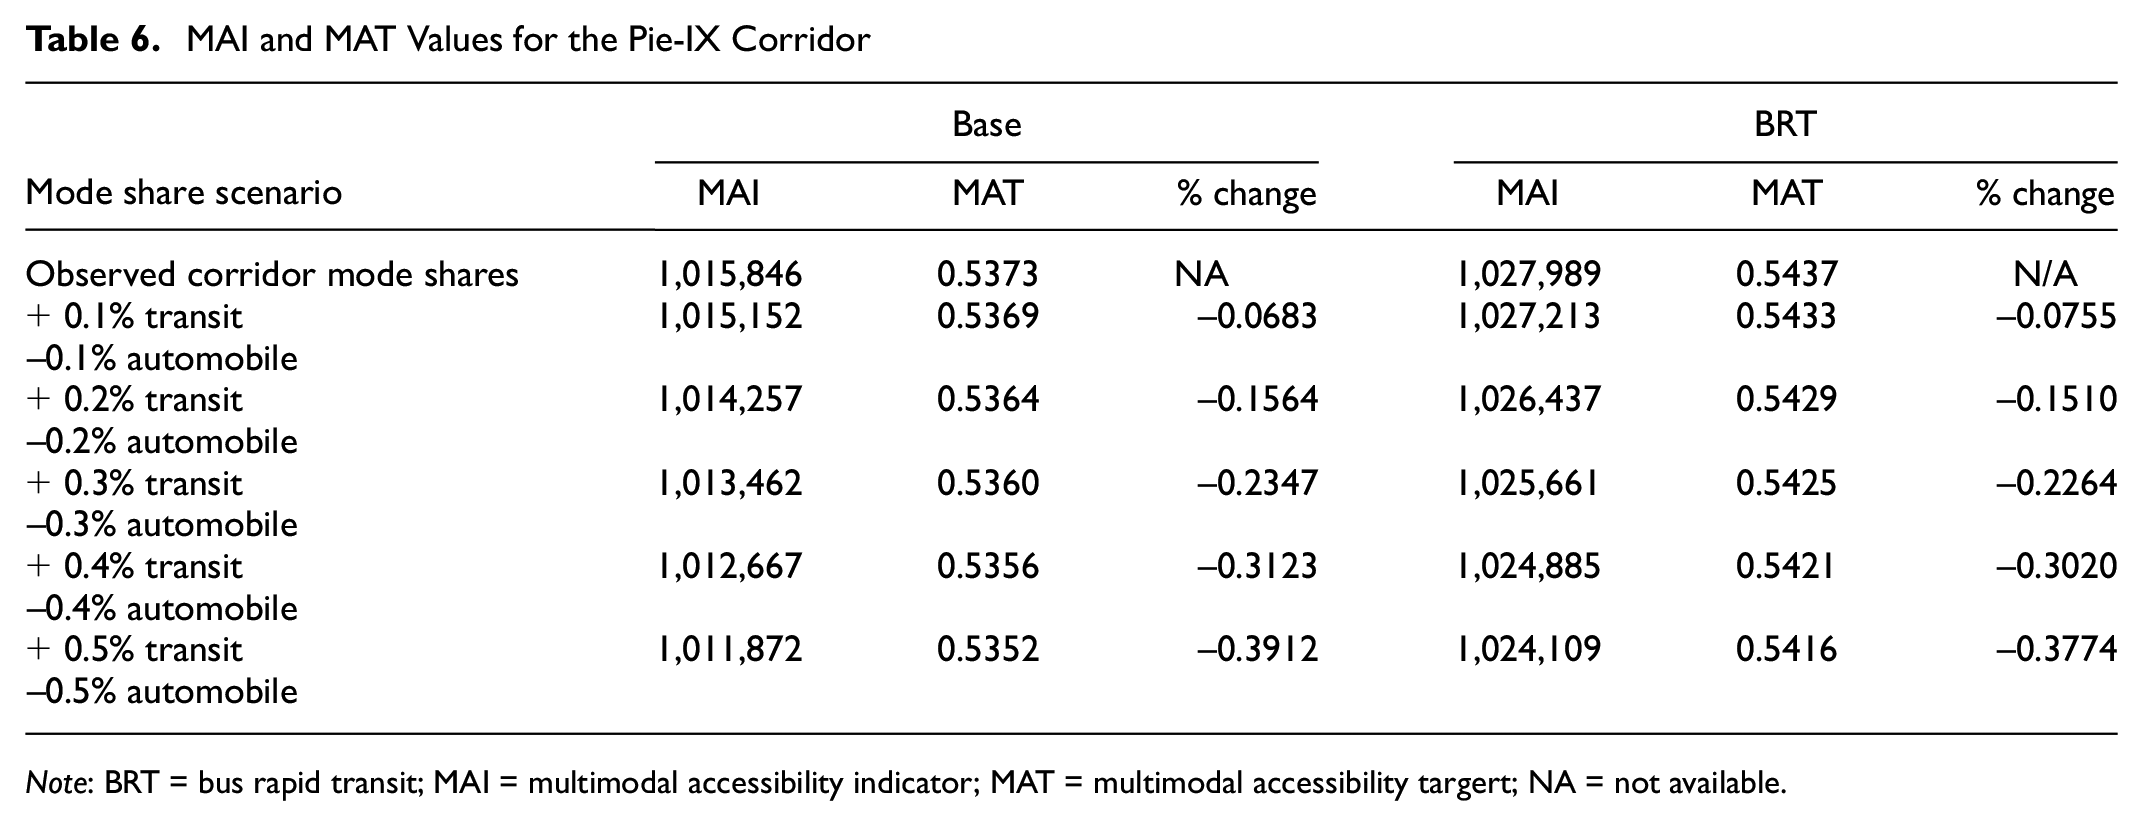
Note: BRT = bus rapid transit; MAI = multimodal accessibility indicator; MAT = multimodal accessibility targert; NA = not available.
Limitations
As demonstrated through the sensitivity analysis, the MAT measure can decrease when mode shares are altered, despite the increase in accessibility by each individual component mode. This happens when the mode share that is increasing allows for fewer jobs to be accessed than the mode share that is decreasing. Although the MAT would decrease as fewer mode-share-weighted jobs become available, this does not reflect a decrease in mobility, which, as in this case, would improve accessibility for each individual mode. This apparent contradiction highlighted the limitation to the mode share weights and more broadly with cumulative opportunity measures. An individual changing their travel mode is only likely to occur if a job remains accessible when switching from a higher to a lower mobility mode. Accordingly, although mode-share-weighted accessibility to employment experienced a net decrease, and individuals switching from driving to transit also had fewer jobs accessible to them, nobody was losing access to their job. This relates to critiques of cumulative opportunity measures, which generally criticize the broadness of examining access to all jobs, rather than examining access to specific categories or subtypes of employment that may be more relevant to an individual.
Conclusion
This paper has proposed and demonstrated use of the MAT for the Pie-IX BRT project. It also advocates for the use of this target in the analysis of transportation infrastructure projects that have impacts on more than one transport mode. In particular, the target for any such project should be to increase the value of the MAT, with an ultimate target of 1. A MAT of 1 implies that all jobs within a region are accessible by all modes of transport. The specific project analyzed here affects both the transit and automobile networks for an important corridor in Greater Montreal. If one were to adopt a unimodal or comparative analysis looking at automobile and transit accessibility separately, it would be unclear how these changes would affect overall, multimodal accessibility. The proposed multimodal approach has illustrated how we could evaluate and conclude that overall, multimodal accessibility increases at the regional and corridor scale. As we drilled down, these regional and corridor level analyses obscured variation at the zonal level, since some zones experienced decreases in multimodal accessibility, even though there was an overall increase. The MAT is a tool that measures and evaluates the effect on overall (across multiple modes) accessibility of transportation interventions that may affect multiple modes and thereby involve accessibility interactions.
This analysis could have been improved or extended in two dimensions. The first is to have adjusted the MAT in the BRT scenario using predicted (instead of fixed) mode shares, although it is anticipated this would have had only a small effect on the results and would not have affected them qualitatively. The second would have been to include all modes in the analysis to provide a more complete picture of overall accessibility in the region. At the same time, their inclusion would not have contributed much to this context since other modes were not affected by the interventions and their share of the MAT would have remained constant. Moreover, since the MAT is itself separable by mode, the analysis could easily be done with only subsets of modes.
On the other hand, future research using the MAT could incorporate other modes of travel, like rideshare, cycling, and walking to obtain a complete picture of multimodal accessibility. Planners and policy makers could use the MAT to create accessibility goals within master plans or, as demonstrated in this paper, to evaluate changes in accessibility from infrastructure investments. Similarly, it would be interesting to evaluate MAT for multiple cities and see how they compare and perform in relation to overall accessibility.
Footnotes
Acknowledgements
The authors thank the members of the Transports Québec Transportation System Modeling Directorate for their help in developing the modeling results and providing their help in their interpretation of the results, particularly Anouk Germain-Paquette, Maxime Formond, Éric Martel-Poliquin, Louiselle Sioui, and Brigitte St-Pierre.
Author Contributions
The authors confirm contribution to the paper as follows: study conception and design: Z. Patterson, data collection: A. Bensmihen, analysis and interpretation of results: A. Bensmihen, Z. Patterson, draft manuscript preparation: Z. Patterson, G. Hermanson. All Authors reviewed the results and approved the final version of the manuscript.
Declaration of Conflicting Interests
The authors declared no potential conflicts of interest with respect to the research, authorship, and/or publication of this article.
Funding
The authors received no financial support for the research, authorship, and/or publication of this article.