
Abstract
Dissimilar metal joints often fail due to the formation of brittle intermetallic phases at the interface. This study demonstrates a practical strategy to join titanium (Ti) and chromium (Cr) using laser surface alloying with molybdenum (Mo) as an intermediate layer. Single tracks and thin coatings of Cr and Mo were deposited on commercially pure Ti using a custom powder bed system that mimics key powder bed fusion parameters: laser power 150–450 W, scan speed 10 mm/s, beam diameter ∼254 µm, powder layer thickness 0.25 mm, and 50% overlap. Microstructure and composition were analysed by SEM-BSE/EDS and XRD, while hardness and Young’s modulus were measured by instrumented indentation. Cr-only deposits showed cracking near the fusion boundary, linked to brittle Ti-Cr intermetallics and residual stress. In contrast, Mo-only coatings were crack-free and promoted β-Ti stabilisation. A bilayer design (Ti/Mo+Cr) produced a continuous, crack-free modified zone. Mo acted as a compatibility layer, improving dilution and allowing the top Cr layer to form a Cr-Mo solid solution above metastable β-Ti. The Ti-Mo-Cr surface exhibited higher hardness than the substrate without the embrittlement seen in Ti-Cr alone. These findings show that a Mo interlayer can enable sound Ti-Cr joints in additive manufacturing.
Keywords
Introduction
Titanium and its alloys are valued in aerospace, biomedical, and energy sectors for their high specific strength, corrosion resistance, and biocompatibility.1–3 Recent progress in additive manufacturing (AM) has made it possible to build complex Ti components with short lead times. Among laser-based routes, powder bed fusion enables fine geometries and tight control of process parameters, while direct energy deposition can repair or add material to existing parts.4–6 However, joining Ti to dissimilar metals remains challenging because brittle intermetallic compounds may form at the interface, leading to cracking and premature failure. 7
Prior work has explored how the physical process and melt-pool shape affect microstructure and defects in laser processing. For example, Kim et al. 8 examined the role of beam defocusing on keyhole formation, and Panwisawas et al. 9 linked keyhole dynamics to heat flow and porosity. These studies show that a transition from conduction to keyhole mode is accompanied by deeper melt pools and higher thermal gradients, which can amplify residual stresses.
Understanding this behaviour is essential when alloying or joining dissimilar systems where thermal and chemical mismatches are pronounced.
The selection of compatible chemistries is equally important. Phase-diagram assessments report limited mutual solubility and the presence of brittle intermetallics in the Ti–Cr system, 10 whereas Mo is a strong β stabiliser for Ti with wider solubility and fewer deleterious compounds. 11 Chromium and molybdenum are mutually soluble over a large composition range. 12 Therefore, the data suggest that a Mo interlayer can act as a chemical and crystallographic bridge between Ti and Cr, promoting dilution and suppressing the direct formation of Ti–Cr intermetallics near the fusion boundary. On the mechanical side, the solid-solution strengthening and β-Ti stabilisation produced by Mo additions are well documented and are consistent with higher hardness and lower cracking susceptibility in Ti–Mo alloys.13–15
Laser surface alloying provides a convenient way to tailor near-surface composition and to create functionally graded transitions without conventional filler metals. Classical surveys describe laser surface alloying as a single-step route where a pre-placed or blown powder is melted with a narrow laser track to obtain rapid solidification microstructures with refined phases.16–18 In parallel, additive manufacturing studies have examined dissimilar combinations such as Ti with Ni-based superalloys, highlighting the importance of interlayers and processing conditions to control dilution and avoid brittle phases.19,20 Reviews focused on Co–Cr alloys illustrate how laser parameters, scan strategy, and layer design govern microstructure and properties, reinforcing the need to discuss parameter–structure–property relations rather than listing settings.21,22
Despite these advances, the literature offers limited discussion on Ti–Cr joints produced by laser-based routes with an Mo interlayer to mediate both chemistry and phase stability. Moreover, few reports connect melt-pool morphology (conduction vs keyhole), elemental partitioning, and cracking behaviour within a single processing map applicable to additive manufacturing conditions. Addressing these gaps can help define robust pathways for building or repairing multi-material components where a Ti substrate must be locally alloyed to achieve a Cr-rich working surface (e.g. wear or high-temperature environments).
This research investigates a Ti–Mo–Cr transition produced by laser surface alloying on commercially pure Ti. Single tracks and coatings of Mo and Cr are deposited (individually and in a bilayer arrangement), with variation of the laser power for traverse conduction and keyhole regimes. The microstructure and chemistry are analysed by SEM–BSE/EDS and XRD, and mechanical response is assessed by microhardness and instrumented indentation. The design of the interlayer and the interpretation of the phase selection are guided by reported Ti–Cr, Ti–Mo, and Cr–Mo equilibria,10–12 by established descriptions of laser processing physics,4,9 and by prior demonstrations of laser modification on Ti substrates. 17 For continuity, earlier findings on Ti surface alloying were taken into account, they indicated the potential of Mo to stabilise β-Ti and reduce cracking under comparable processing conditions. 18
Experimental details
Figure 1 represents an overview of the complete process and the following section provides detailed information on the techniques and procedures used to process the parts, as well as the characteristics and behaviour investigated in this research.

Processing map.
Raw materials analysis
To characterise the Cr and Mo powders, and the Ti substrate, X-ray diffraction (XRD) and scanning electron microscopy (SEM) were used to examine powder morphology and identify surface phases on Ti. Particle size distribution was assessed using laser diffraction via a Mastersizer-3000 (Malvern Instruments, model MAZ3000). In this technique, powder is suspended in compressed air, and the diffraction pattern generated by a laser beam passing through the sample is analysed to determine volume-based grain size.
Process equipment
For this study, a glovebox chamber (MBraun) was used to control atmospheric conditions, maintaining positive pressure with inert Argon (Ar) purified via oxygen and humidity absorption filters. Within the glovebox, a computer numerical control (CNC) table allows X- and Y-axis movement of the workpiece for laser processing, managed using Mach3 software to create single and multilayer laser tracks. A custom-built device within the glovebox enables micrometric adjustment of cylinder height, allowing precise control of powder layer thickness during deposition.
This set-up replicates the conditions of powder bed fusion as closely as practicable. Although it cannot exactly match the technique’s process parameters, it offers a robust approximation of the interactions between the constituent materials and the behaviour of the resulting joints under realistic processing conditions, while remaining faithful to the principles of additive manufacturing. 23 Further equipment details are provided in section S.1 of the Supplemental Material.
Optical and scanning electron microscopy
A Carl Zeiss Axio Scope optical microscope, equipped with reflected light, was used to examine the morphology of the raw Cr and Mo powders. Microstructural and metallographic characterisations were carried out using SEM. Specifically, a Carl Zeiss EVO-MA15 microscope, equipped with backscattered electron (BSE) and secondary electron detectors, was employed to analyse the microstructure within the fusion zone of the Ti-Cr and Ti-Mo alloy, single laser tracks and coatings.
Energy dispersive X-ray spectrometry
In addition, the SEM is equipped with an X-max detector from Oxford Instruments, enabling energy dispersive X-ray spectrometry (EDS). This facilitates the acquisition of qualitative and semi-quantitative data on the sample, providing insights into the elemental distribution within the fusion zone.
X-ray diffraction
To identify the crystalline phases present in the sample that is initially manufactured with a Mo layer and subsequently modified by depositing an additional Cr layer, X-ray diffraction (XRD) analyses were conducted on the surface. Following this, approximately a 20 µm layer of the sample was removed, and a second XRD analysis was performed. For these analyses, a Panalytical X’Pert PRO diffractometer, equipped with a copper anode and a PIXcel ultra-fast detector, was used. Measurements were carried out at 40 kV and 30 mA. Prior to this analysis, the surface was lightly polished to reduce surface roughness.
Hardness and Young’s modulus
To assess the mechanical response of the Ti surface modified with Mo and Cr, microhardness tests were performed on Ti-Mo-Cr, Ti-Cr, and Ti-Mo coatings. A Future Tech Vickers hardness tester (model FV-800) with a 136° pyramidal diamond indenter was used. Fifteen indentations per sample were carried out under a 0.5 kgf load, held for 15 s.
For depth-resolved analysis, a CSM Instruments nanoindenter (model NHT1) with a Berkovich diamond tip applied a 400 mN load for 30 s on the Ti-Mo-Cr sample. Hardness and Young’s modulus were calculated using the Oliver and Pharr method, assuming a Poisson’s ratio of 0.3. 13
Methodology
Samples from Ti plates (25 mm in length) were cut and machined with 15 mm wide, 0.25 mm deep surface recesses, based on prior studies.14,24–26 The plates were sanded with 1200 mesh silicon carbide paper and ultrasonically cleaned in 95% ethyl alcohol. Cr and Mo powders were then applied separately into the recesses to prevent cross-contamination. Using the CNC table, a speed of 10 mm/s was programmed to move the table and therefore laser beam; a laser power of 150, 200, 300, 450 W was used to manufacture the individual tracks and 300 W for the single and double layer samples.
For metallographic preparation, plates were sectioned perpendicular to the laser scanning direction using a diamond disc, embedded into hot-curing resin, and ground with SiC papers (100–1200 mesh). Polishing was carried out in two stages: initially with 9, 6, and 3 µm diamond pastes, followed by a final polish using 0.5 µm silica suspension on a VibroMesh polisher, in accordance with ASTM guidelines. 27
Single track and coating
To evaluate the elemental compatibility, single laser tracks were produced on Ti substrates using Cr and Mo powders. Laser power was varied from 150 to 450 W, while CNC speed (10 mm/s), laser diameter (0.2 mm), and powder layer thickness (0.25 mm) remained constant.
Following this, one- and two-layer coatings of Cr and Mo were fabricated using a fixed laser power of 300 W. For the second layer in dual coatings, the scanning strategy was altered by swapping X- and Y-axis directions to replicate conditions typical of laser powder bed fusion closely as practicable. Full details are provided in section S.2 of the Supplemental Material.
Single and multiple-layer samples
Based on single-track and coating trials, a process was designed to maximise the near-surface hardness while suppressing cracking and porosity. For a 0.25 mm pre-placed powder layer and 10 mm/s scan speed, 300 W produces a stable transition-mode melt pool with good dilution; 450 W drives keyhole formation and porosity, particularly for Cr. A Mo-first/Cr-top bilayer (optionally with multiple Mo layers) acts as a chemical and crystallographic bridge, promoting β-Ti near the interface and a Cr–Mo solid solution at the surface. A schematic process map can be found in the Supplemental Material.
Finally, two samples were fabricated. One of them was produced with a single layer of Mo followed by a layer of Cr, while the other sample was made with three layers of each element, starting with Mo and finishing with Cr. The same parameters used for the two-layer coatings were applied, and the laser scanning strategy was adjusted after each layer, as mentioned in Single track and coating section. Detailed information about this strategy can be found in section S.2 of the Supplemental Material.
Results
The following sections present the data from the various analyses conducted on the raw materials, as well as the results of the single-track laser treatment. Additionally, the fabrication of single and multiple-layer samples via LPBF is discussed, with SEM analysis and mechanical property evaluation of the produced samples.
Raw materials analysis
The raw materials used for this research were obtained from different suppliers. Table S.1 in the Supplementary material presents key characteristics that are relevant for this research. Additionally, an X-ray Fluorescence (XRF) test confirmed the Ti plates’ purity at 99.7%. Results from raw materials characterisation are presented in section S.3 in the Supplemental Material.
Single tracks
To evaluate the behaviour of Ti-Cr and Ti-Mo systems during laser processing, single tracks were produced at laser powers of 150, 200, 300, and 450 W. Results are grouped into two sets: low-to-medium energy (150–200 W) and medium-to-high energy (300–450 W), shown in Figure 2. Additional SEM images are provided in section S.4 of the Supplemental Material.
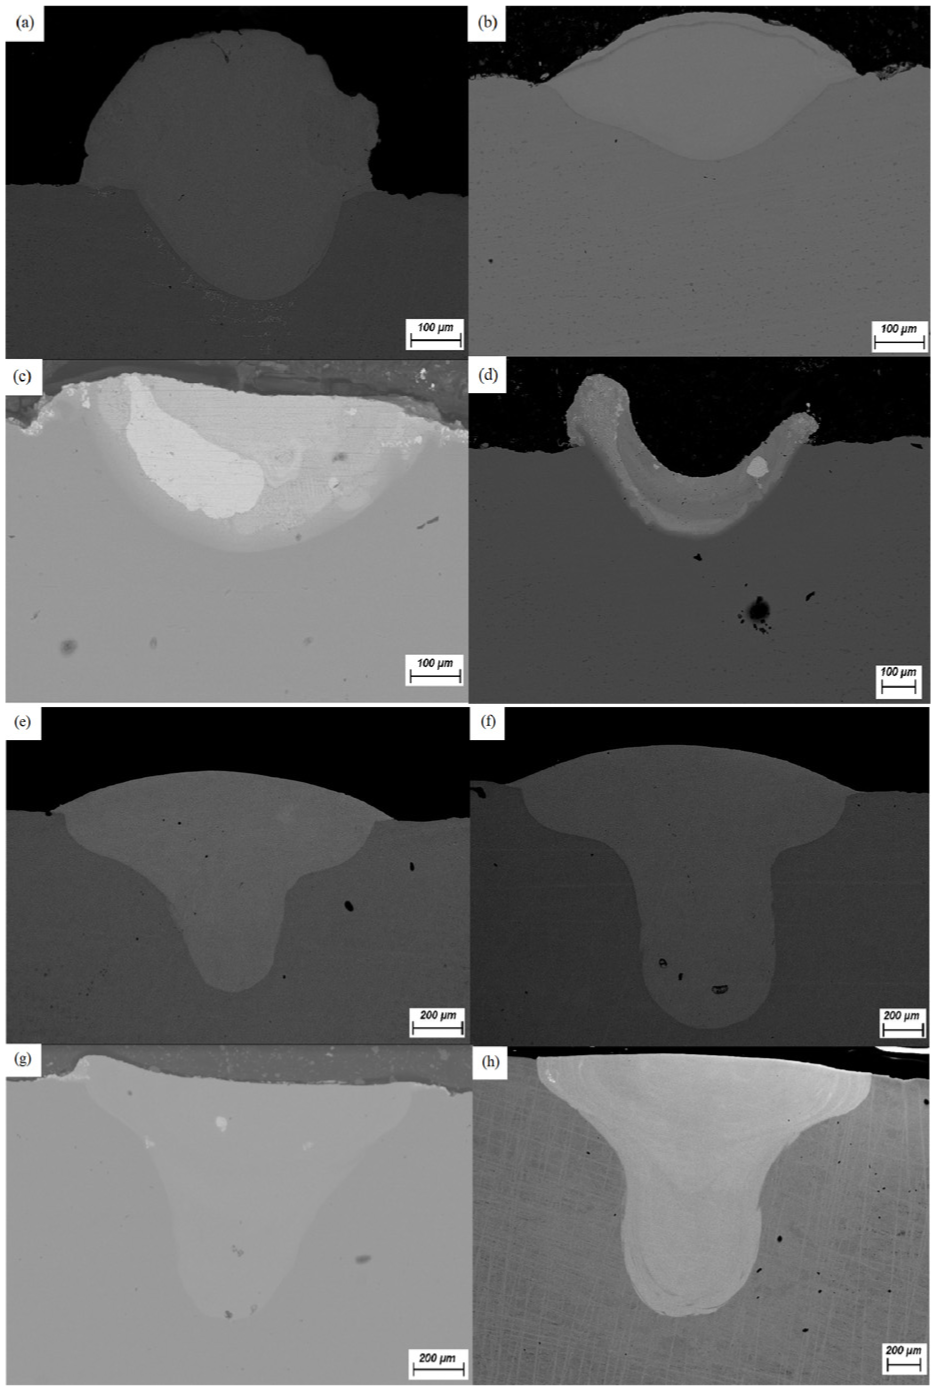
(a) Ti-Cr 150 W, compared with (c) Ti-Mo at 150 W. Also, (b) 200 W for systems Ti-Cr, compared with (d) Ti-Mo. (e) Ti-Cr 300 W, compared with (g) Ti-Mo at 300 W. Finally, (f) 450 W for systems Ti-Cr and (h) Ti-Mo.
SEM images were captured in BSE mode to gain insights into the elemental distribution on the cut surface and within the fusion zone. In Figure 2(a), the Ti-Cr system is shown, while Figure 2(c) presents the Ti-Mo system. In the latter, a brighter region is noticeable compared to the rest of the fusion zone, suggesting areas where the laser energy was insufficient. At a power of 200 W, as shown in Figure 2(b) for Ti-Cr and Figure 2(d) for Ti-Mo, a larger fusion zone is observed in the Ti-Cr system. In contrast, the Ti-Mo system still exhibits unmolten particles, indicating that the energy remains insufficient to fully melt the Mo.
In Figure 2(e), the Ti-Cr system at a power of 300 W is compared with the Ti-Mo system shown in Figure 2(g) at the same power. A noticeable change in the fusion zone format can be observed for both systems. Then, single tracks were fabricated using a power of 450 W for the Ti-Cr system (Figure 2(f)) and the Ti-Mo system (Figure 2(g)). In these cases, porosity is observed at the bottom of the fusion zone in the Ti-Cr system, while both systems exhibit a complete keyhole-type formation.
For each of the single tracks, EDS analysis was performed in mapping and semi-quantitative modes to observe the distribution of elements in each trial, as well as the average concentration in the fusion zone for each condition. Table S.3 in the Supplemental Material presents the Cr/Mo and Mo/Ti average concentrations in the fusion zone. Table 1 presents the measurements of width and depth for the different laser power conditions. EDS mapping of each single-track are presented in the Figures S.7 to S.14 in the section S.5 in the Supplemental Material. The porosity was evaluated as presence or absence of it in the SEM images.
Fusion zone depth and width along the laser power variation.

Single and dual-layer Ti-Cr and Ti-Mo
Using the information obtained from the single track tests, samples were processed with one and two layers of each element. For these tests, the custom-designed equipment was used to fabricate single and double layers of each element separately on their respective Ti substrate, with a powder layer thickness of 0.25 mm for each. For the second layer, the laser path was altered by changing the direction of trajectory. The movement was automatically programmed along the Y-axis for the first layer and then along the X-axis for the second layer, simulating the laser movement in the PBF additive manufacturing equipment. Figure 3 presents SEM images in BSE mode, illustrating each system.

(a) Ti-Cr one layer and (c) two layers samples compared with (b) Ti-Mo one layer and (d) two layers at 300 W.
The Ti-Mo system presented in Figure 3(b) demonstrates a notable separation between the starting and midpoint distances of the fusion zone, indicating an overlap between the laser tracks that facilitates a consistent coating along the sample. Additionally, a brighter appearance can be observed in compositions that are richer in Mo, alongside the presence of microstructures within the Mo coating, which display dendrites in the fusion zones and micro-segregation in the interface region. However, as shown in Figure 3(a), a crack is evident along the coating. Moreover, there is a clear differentiation between the laser tracks, suggesting a homogeneous solution formation during the fusion process. For the two-layer Ti-Cr (Figure 3(c)) sample, porosity was observed at the bottom of the fusion zone.
Similarly, EDS mapping and semi-quantitative analysis were performed on single laser tracks to better understand elemental distribution and concentration. The corresponding images can be found in section S.6 of the Supplemental Material.
Single layer Ti-Mo-Cr sample
Based on previous findings, a Ti substrate was surface-modified with a Mo layer, followed by Cr powder deposition. The sample was fabricated using a 300 W laser for both layers and the same laser scanning strategy as in earlier dual-layer trials. Powder thickness was maintained at 0.25 mm using the custom-designed setup. After processing, the specimen was sectioned and prepared for SEM analysis, Figure 4.

(a) SEM image of Ti with one layer of Mo and subsequently a single layer of Cr added, (b) dendritic microstructures, and (c) microsegregation details.
Dendritic structures and microsegregation were observed along the modified surface, Figure 4(b) and (c). EDS mapping was used to evaluate elemental distribution, Figure 5.

(a) SEM image using BSE mode. Different element distribution: (b) Ti yellow, (c) Cr cyan, and (d) Mo green.
Three zones are visible: a Cr-Mo mixture near the surface, a transition region with all three elements, and a Ti-only base layer. Semi-quantitative EDS confirmed elemental variation (see section S.7 in the Supplemental Material). Hardness and Young’s modulus were measured across the Mo-Cr coating to the Ti substrate. Results are shown in Table 2.
Young’s modulus and hardness from surface to the substrate.

Surface Vickers hardness was compared across Ti, Ti-Cr, Ti-Mo, and Ti-Mo-Cr samples, Figure 6. Values were averaged from 15 random measurements on each treated surface, based on the samples discussed in the Single and dual-layer Ti-Cr and Ti-Mo section.

Comparison of Vickers hardness values between the different systems.
Multiple layers and XRD analysis
After completing the analysis of the sample fabricated with a single layer of each element (initially Mo, followed by Cr), a new sample was produced with a greater number of layers for each material. Figure 7 presents a cross-sectional SEM image in BSE mode of a sample fabricated with three layers of Mo, followed by the addition of three layers of Cr.

(a) SEM image with EDS map analysis from multilayer sample, (b) Ti yellow, (c) Cr cyan, and (d) Mo green.
To determine the cause of the fracture, an XRD analysis was performed, starting from the surface of the sample. Approximately 50 µm of material was then removed by grinding, reducing the total height of the sample. After each grinding step, the XRD analysis was repeated on the newly exposed surface. This process was carried out eight times, resulting in nine diffractograms, including the initial surface XRD. These diffractograms were combined into a single graph, with the distance from the surface δ used to distinguish each one, as presented in Figure 8. The peak indexation of each diffractogram is presented in section S.8 of the Supplemental Material.
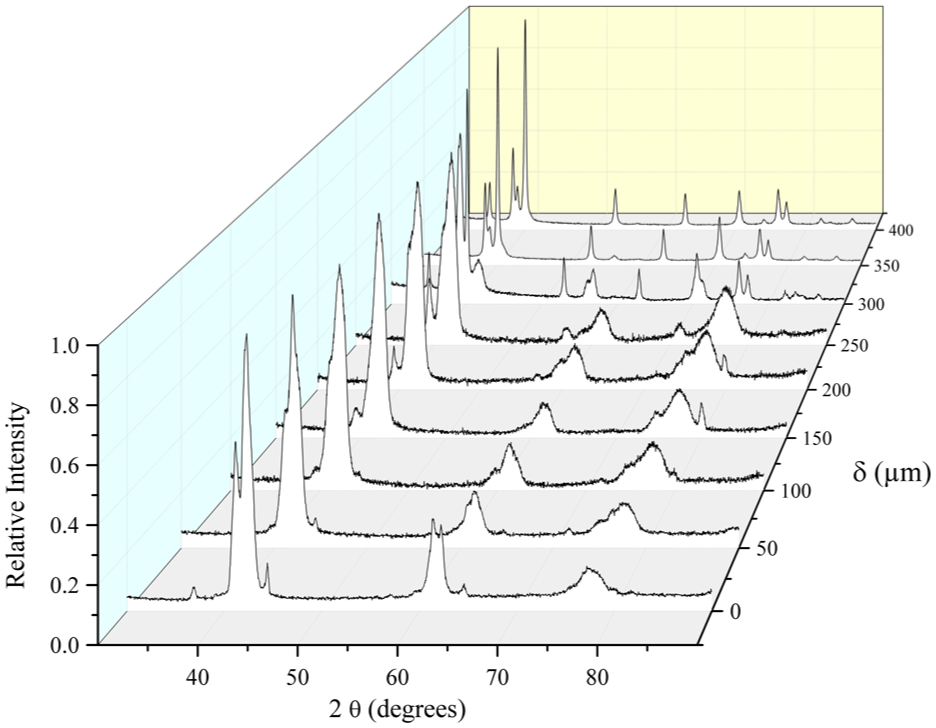
XRD tests conducted on the Ti-Mo-Cr multilayer sample, from the surface to the Ti-Mo interface (400 µm).
Discussion
The use of the custom-designed equipment in this study, which closely mimics many of the conditions found in PBF additive manufacturing, provides notable advantages. Notably, it allows processing powders of varying particle sizes and shapes, eliminating the need for strictly spherical particles in some commercial systems. This flexibility expands the range of materials that can be utilised, offering greater versatility in material selection. Additionally, the system allows for the use of smaller powder quantities, reducing material costs, and enabling cost-effective research. Importantly, it also opens the possibility for studying element substitution and bonding alterations, thereby enhancing the potential for compatibility studies across different materials using laser-based processing techniques.
Single tracks
The single track experiments provided insight into how laser power affects fusion zone depth and composition. A slight increase in fusion depth was observed in the Ti-Mo system, attributed to multiple reflections. 18 As noted in the Raw materials analysis section in this main document and in the Supplemental Material, Mo has a higher reflectivity than Cr, allowing more laser energy to reach the Ti substrate. This results in deeper melting and greater Ti dissolution into Mo. In contrast, Cr absorbs more energy, reducing the energy available to melt Ti, and thus limiting fusion depth. This behaviour is reflected in the concentration trends shown in Table S.5 in the Supplemental Material.
The multiple reflection phenomenon also explains the evolution of fusion zone geometry. At 150 W, both systems display conduction-type zones with partially melted particles due to limited energy. At 200 W, the Ti-Mo system transitions to a “U” shape, caused by splashing, 28 where vapour builds at the bottom of the melt pool and ejects due to pressure differences.
An average power of 300 W was selected for one- and two-layer coatings, representing the transition from conduction to keyhole mode. 9 Although keyhole formation is observed at 450 W, these conditions were excluded due to excessive dilution and notable porosity, particularly in Cr samples.
Single and dual-layer Ti-Cr and Ti-Mo
A key feature in the SEM images is the fracture observed in Figure 3(a), likely caused by intermetallic compound formation 29 that embrittles the Ti-Cr joint during cooling. This is consistent with the Ti-Cr phase diagram, where such phases have lower volume than adjacent phases. 10 EDS and BSE imaging (see section S.6 of the Supplemental Material) reveal a homogeneous Ti-Cr mixture, but porosity was also observed at the bottom of the fusion zone in the first layer, suggesting volume shrinkage due to intermetallic phase formation during laser treatment.
In contrast, the Ti-Mo system displays a homogeneous mixture without cracking, attributed to the better chemical compatibility of Ti and Mo. 11 As shown in Figure 3(d), a clear concentration gradient forms from the surface inward after the second Mo layer, confirmed by EDS analysis.
In the Ti-Mo-Cr configuration (see Single layer Ti-Mo-Cr sample section), dendritic microstructures reveal compositional variation. Mo and Cr are more concentrated in the dendrites, while Cr levels near the substrate fall below 10%.
Multiple layers and XRD analysis
The multilayer component showed behaviour similar to the single-layer sample. As seen in Figure 7, EDS mapping indicates that Mo effectively isolates Cr, limiting its contact with Ti and reducing the formation of brittle intermetallic phases.
Fractures were observed propagating from the surface to the Cr-Mo interface (300 µm). This is attributed to differences in thermal expansion behaviour. Mo expands linearly, 30 similar to Ti, 1 while Cr’s expansion remains stable up to 973 K, then increases sharply doubling from 5.7 to 10.3 × 10 − 6 K − 1 by 1270 K. 31 During rapid cooling in laser processing, this leads to abrupt Cr contraction and surface detachment, with fractures terminating at the more stable Mo interface.
XRD analysis in Figure 8 confirmed phase evolution from surface to substrate. Indexed diffractograms revealed peaks corresponding to Mo-Cr solid solution, 32 β-Ti, 33 and α-Ti 34 within the first 100 µm. From 150 to 250 µm, Mo-Cr peaks diminished as β-Ti increased. At 300 µm, the Mo-Cr phase vanished, leaving a mix of β-Ti and α-Ti typical of Mo-modified Ti. 14
Mechanical properties of the laser-modified surface
Figure 9 shows depth-resolved nanoindentation results for the Ti–Mo–Cr coating, revealing high hardness within the top 80–120 µm, followed by a gradual decrease towards the Ti substrate, while Young’s modulus remains comparatively stable (Table 1). Together with the surface Vickers comparison (Figure 6), the data indicate that the Ti–Mo–Cr design increases near-surface hardness relative to Ti, yet avoids the excessive embrittlement observed for Ti–Cr alone. This response is consistent with the observed microstructure: a Cr–Mo solid solution near the surface above Mo-stabilised β-Ti, as confirmed by XRD from surface to sub-surface.

Young’s modulus and hardness through sample from surface to substrate.
Conclusions
The custom-designed equipment used in this work successfully replicates conceptual conditions of the PBF additive manufacturing process and demonstrates several practical advantages and some findings.
- It allows for the use of powders with diverse particle sizes and shapes, removing the dependence on spherical powders required for flow in many commercial systems. This enhances the versatility of the method, expanding the material options available for processing. Additionally, the system’s efficient use of smaller powder quantities reduces material costs, making it highly suitable for research purposes.
Furthermore, it enables the investigation of element substitution and bonding modifications, facilitating compatibility studies between different materials in laser processing applications.
- A transition from conduction to keyhole mode was observed as laser power increased. Tracks on Mo showed deeper and narrower melt pools, while Cr produced shallower pools with higher near-surface concentration. Cracking appeared mainly in Ti–Cr tracks near the fusion boundary; Ti–Mo tracks were crack-free under the same conditions. The change in melt-pool mode explains the shift in dilution and residual-stress build-up. The higher energy coupling with Mo supports deeper pools and smoother dilution; this behaviour is favourable for creating crack-free modified zones on Ti.
- Coatings with only Cr tended to form cracks and localised hard regions, consistent with brittle intermetallic formation. Coatings with only Mo were continuous and promoted β-Ti near the interface. Dual-layer designs reduced cracking compared with Cr-only deposits, indicating that Mo improved chemical compatibility. A Mo-underlayer with a Cr top layer produced a continuous modified zone without visible cracks. Near the surface, the chemistry was Cr–Mo rich, while the region close to the substrate showed Mo-enriched β-Ti, suggesting a gradual transition in composition.
- With increasing deposited layers, hardness increased relative to the substrate, and XRD indicated phases consistent with BCC solid solution in the Cr–Mo rich region and metastable β-Ti beneath. Peaks related to brittle Ti–Cr compounds were not dominant in the measured range. A graded Ti–Mo–Cr transition can balance hardness and integrity. The near-surface Cr–Mo solid solution provides higher hardness, while the Mo-enriched β-Ti below helps to accommodate strain and to limit crack initiation and growth.
Finally, Mo interlayer enables a practical route to obtain a sound Ti–Cr surface by laser-based processing. The results define a process window and a materials path that reduce cracking when a multimaterial sample is made, while increasing surface hardness, which is useful for applications that need to merge Cr-rich alloys with Ti materials. For future work, different intermediate materials should be explored (either a single intermediary or a tailored set of several) to provide a reliable pathway for joining dissimilar elements. This approach should not be limited to titanium and its alloys, as some steels also form brittle phases that make direct bonding to other materials impractical. By systematically selecting and optimising intermediaries, including the use of functionally graded stacks, it should be possible to suppress brittle phase formation and achieve sound, durable joints.
Supplemental Material
sj-pdf-1-ade-10.1177_16878132251401629 – Supplemental material for Laser surface alloying of Ti with Cr/Mo enabling dissimilar Ti-Cr joints using additive manufacturing concept approach
Supplemental material, sj-pdf-1-ade-10.1177_16878132251401629 for Laser surface alloying of Ti with Cr/Mo enabling dissimilar Ti-Cr joints using additive manufacturing concept approach by Andres F. Ramirez, Andres F. Galvis and João B. Fogagnolo in Advances in Mechanical Engineering
Footnotes
Handling Editor: Sharmili Pandian
Acknowledgement
The authors would like to thank to the University of Campinas (Brazil), specially to Physical Metallurgy Laboratory from School of Mechanical Engineering.
Ethical considerations
This article does not contain any studies with human or animal participants.
Consent to participate
There are no human participants in this article and informed consent is not required.
Funding
The authors disclosed receipt of the following financial support for the research, authorship, and/or publication of this article: This study was funded by the Coordination for the Improvement of Higher Education Personnel (CAPES) – Grant No. 88887.648620/2021-00.
Declaration of conflicting interests
The authors declared no potential conflicts of interest with respect to the research, authorship, and/or publication of this article.
Supplemental material
Supplemental material for this article is available online.
References
Supplementary Material
Please find the following supplemental material available below.
For Open Access articles published under a Creative Commons License, all supplemental material carries the same license as the article it is associated with.
For non-Open Access articles published, all supplemental material carries a non-exclusive license, and permission requests for re-use of supplemental material or any part of supplemental material shall be sent directly to the copyright owner as specified in the copyright notice associated with the article.