
Abstract
In order to solve the problems of high surface roughness and low dimensional accuracy of titanium alloy metal-wire fuse additive manufacturing, this paper proposes a high surface quality and dimensional accuracy of titanium alloy additive manufacturing with composite heat source process. On the basis of orthogonal experiments, titanium alloy wires with diameter of 0.3 mm Ti-6Al-4V were deposited in a small molten pool by laser and Joule heat source. Thin-walled titanium alloy parts with high surface quality and dimensional accuracy were obtained, and the quality, microstructure, and mechanical properties were tested. The measurement areas are shown that the average roughness Ra is 1.65 μm in the direction deposition, and the dimensional accuracy error is less than 0.28 mm. On this basis, the microstructure and mechanical properties of titanium alloy thin-walled were analyzed. The microstructures are net-like, with microhardness of about 330HV. The ultimate tensile strength of titanium alloy thin-walled parts is 917.56 MPa, and the elongation can reach 20.68%, which is comparable to the strength of casting and forging fracture. The results show that the proposed additive manufacturing process of metal-wire with composite heat source has the potential of further metal AM in high surface quality parts.
Introduction
As a subversive manufacturing technology, metal additive manufacturing has been widely used in rocket, aero-engine and other equipment, and has become one of the fastest developing technical directions in the world’s advanced manufacturing field.1,2 In the mainstream process of metal additive manufacturing, according to the material form mainly divided into two kinds of metal powder and metal wire. The heat input can be laser, 3 electron beam 4 or arc. 5 Among them, the metal fuse wire additive manufacturing process has the advantages of low material cost, material utilizaition rate can be close to 100% and environmental requirements are simpler and safer. However, the manufacturing process often has the problems of poor surface roughness and dimensional accuracy, which limits the further application of the metal feeding wire additive manufacturing process. 6
As a light alloy, titanium alloy has excellent properties such as high strength, stiffness and corrosion resistance and is one of the most widely studied metal materials in metal additive manufacturing.7–9 Kelly and Kampe 10 studied the structural characteristics evolution and microstructure morphology of titanium alloy multilayer microstructure by using laser fuse additive manufacturing process. Baufeld et al.11,12 deposited the thin-walled structures of titanium by using LAM and SMD processes, and analyzed the microstructure characterized and tested the mechanical properties. Pixner et al. 13 used electron beam free forming technology to study the deposition state of Ti-6Al-4V and the microstructure after heat treatment, and studied the influence of microstructure and mechanical properties. Wang et al. 14 studied the microstructure and mechanical properties of titanium alloy under different deposition paths. However, it is difficult to directly obtain high surface quality titanium alloy deposition parts of the wire feeding additive manufacturing method mentioned above. In the process of metal fuse additive manufacturing, due to the process characteristics of layer-by-layer melting accumulation of wire, the surface of parts will produce a certain degree of ladder effect, coupled with thermal deformation, resulting in poor precision and surface quality of parts, which will increase the cost and delivery time of post-processing. 15
The surface roughness is one of the important factors affecting the surface quality of additive manufacturing parts. 16 Some scholars have made preliminary exploration on how to improve the surface roughness of metal fusing wire additive parts. For example, Shaikh et al. 17 deposited stainless steel wire with a diameter of 0.1 mm by pulsed laser and obtained a deposition part with a surface roughness of 8–16 μm. Li et al. 18 used 304 stainless steel wire with a diameter of 0.3 mm to deposit uniform thin-walled parts under the composite heat source process, and obtained better surface roughness through chemical polishing. According to the above research, it can be found that metal wire melting deposition by controlling energy input to form small molten pool has the potential to form high surface quality additive parts. However, how to obtain high surface quality titanium alloy parts by additive manufacturing method has not been widely studied. Therefore, it is meaningful research to obtain titanium alloy parts with high surface quality and dimensional accuracy through metal fusing wire additive manufacturing.
In this paper, an additive manufacturing method of titanium alloy fuse with laser and Joule heat source was proposed. The process uses diameter of 0.3 mm titanium alloy wire as raw material, uses laser as main energy and Joule heat as auxiliary heat source, a set of formable process parameters were obtained by direct analysis of orthogonal test and considering the geometric characteristics of a single bead. On this basis, thin-walled parts of titanium alloy were deposited and their surface roughness, microstructure and mechanical properties were measured. This process can improve the poor surface quality of titanium alloy wire feeding additive manufacturing, has higher surface quality and dimensional accuracy, and has the potential for further development.
Materials and methods
Material
In this experiment, Ti-6Al-4V titanium alloy wire with a diameter of 0.3 mm was selected as the deposition material. The substrate was a Ti-6Al-4V titanium alloy plate with a thickness of 5 mm. The chemical composition (mass fraction) is shown in Table 1. The surface of the substrate shall be polished, and be cleaned with absolute ethanol solution to remove impurities.
Chemical composition of Ti-6Al-4V (mass fraction, %).
Experimental setup
The forming principle of Laser and Joule heat composite heat source deposition method is shown in Figure 1(a). The process method uses laser and joule heat generated energy as composite heat source, through the control of laser power input, the small size of the molten pool formed in the substrate. Then, Joule heat will be generated when the wire with current is in contact with the substrate, heating the wire to a state close to the melting point or melting, with the moving of the substrate into the continuous deposition in the molten pool. At the same time, the electric energy is directly converted into heat energy on the wire, and the energy utilization rate is close to 100%, 19 which reduces the dependence on laser energy and thus reduces the power used by the laser.
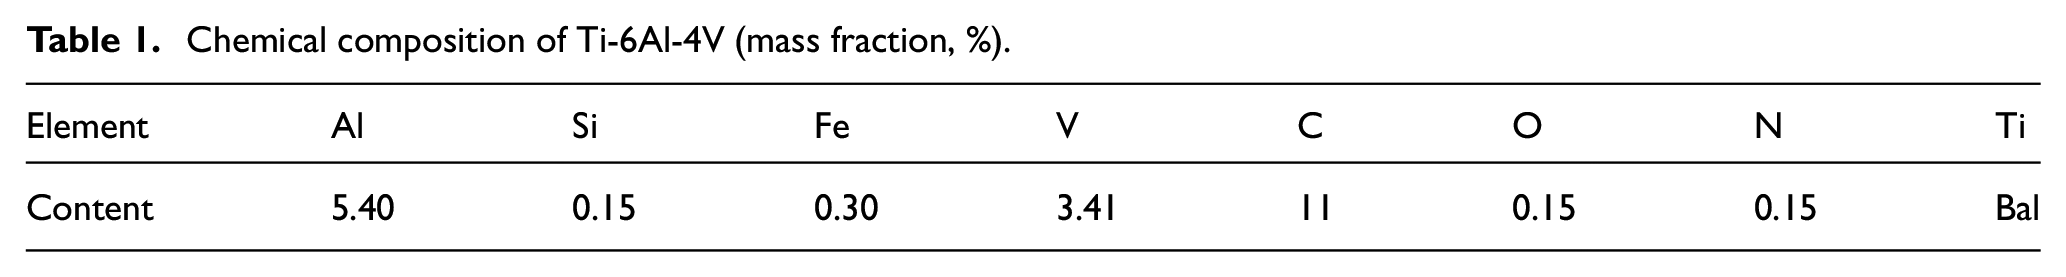
Schematic diagram of: (a) laser and Joule heat fuse additive manufacturing principle, (b) detailed set up, (c) the composite heat source forms the molten pool and the wire, and (d) the cutting position and test area of corrosion, the microscopic observation, and tensile specimens of the titanium alloy thin-wall parts.
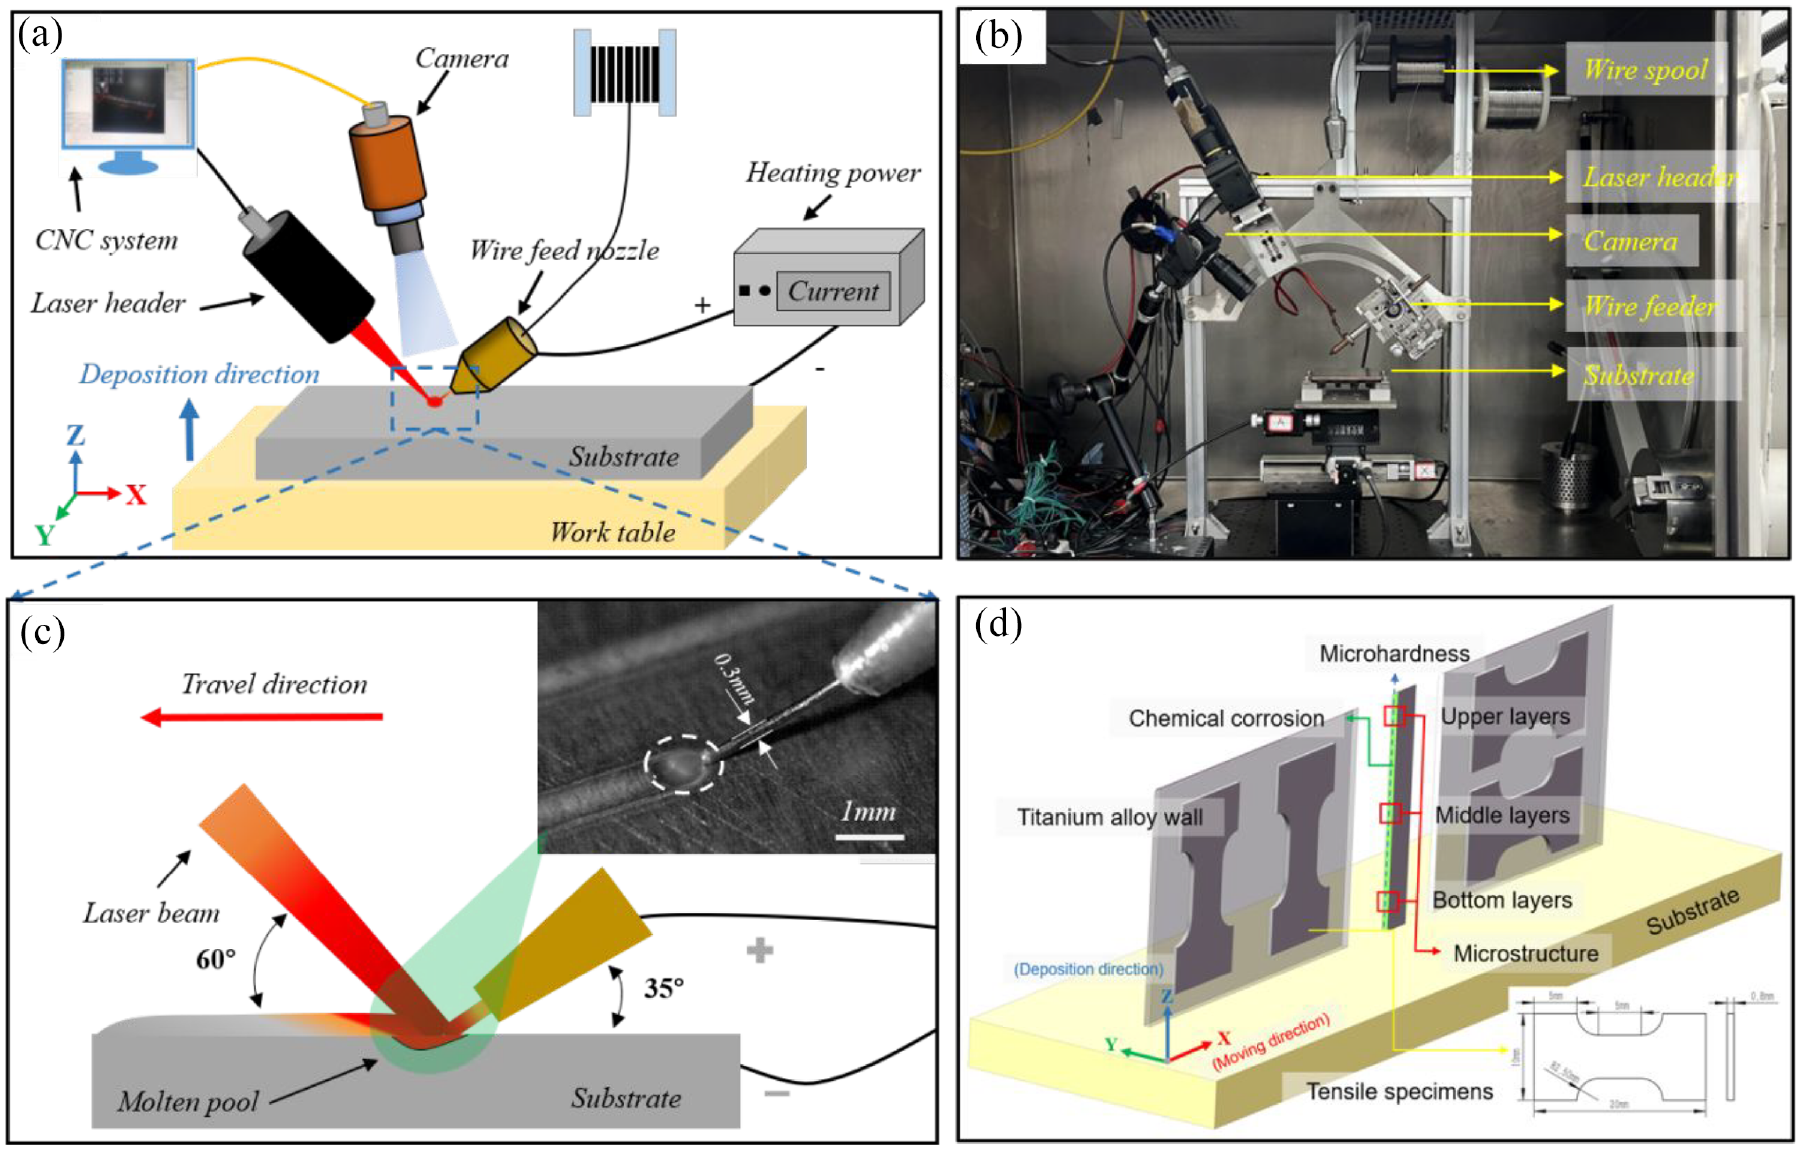
Figure 1(b) shows the schematic diagram of the above principles to build the experimental device. The composite heat source system is composed of an IPG fiber laser (QCW-150, IPG, China) and a programed power supply (IT-6512D, ITECH, China). The G code is used to control the energy output, the movement of the table and the wire feeder. The spot size of the laser is 0.3μm and the wavelength is 1064 nm. The output range of programming power supply is 0–120 A. During the experiment, the Angle between the laser and the wire feeding structure is close to 100°. Due to the small diameter of the wire and spot, by controlling the laser defocus amount to adjust the laser beam spot size, the defocus amount is selected as −2 mm; The wire is fed by an electrically controlled roller through the copper nozzle of the wire feeder. One end of the copper nozzle is connected with a current power supply to the substrate, and the metal wire is sent into the process of contact with the substrate to form a closed loop to realize the heating of the wire. By computer control, the metal wire is fed forward to form a stable molten pool on the substrate and realize continuous deposition. To avoid sediment oxidation, the laser Joule heat fuse additive manufacturing device is placed in a positive pressure box with displacement purifying gas function. The chamber is filled with argon and the water and oxygen levels are controlled under10PPm. Table 2 shows the main range of technological parameters used in the deposition process.
Range of test process parameters.
Parts characterization and mechanical tests
The length and wall thickness of thin-walled parts were measured by vernier caliper and helical micrometer. The surface quality of thin-walled parts was measured by Mahr 300C surface roughness instrument and Smart proof 5 (Zeiss, Jena, Germany) laser confocal microscope. The roughness of three different areas of the thin-wall surface is measured and the average of the test results is used to evaluate the final surface quality.
After cutting the thin-walled parts with a wire cutter, the samples were polished with sandpaper until they have the same scratch depth and direction. To better illustrate the quality of the parts, X-ray diffractograms (XRD) (D8, Bruker, Germany) was used to scan from 30° to 90° at a rate of 6 rad/min in 2θ range. The titanium alloy parts were then chemically etched with a mixture of 2 vol% hydrofluoric acid, 12 vol% nitric acid and 86 vol% water. The microstructure of cross-section parts was analyzed by Leica DM-2700M optical microscopy (Leica, Wetzlar) and JSM-IT500LA scanning electron microscopy (JEOL, Tokyo, Japan).
The Vickers hardness of the thin-walled part was measured using a Mitutoyo HM-210D (Mitutoyo, SanFeng, Japan) 10 s after the application of a 0.2 N load. A universal material testing machine (INSTRON 5982, Norwood, MA, USA) was used to test the tensile strength of the three groups of samples in the traveling direction and deposition direction, respectively. The tensile specimen fractures were observed using a JSM-IT500LA scanning electron microscope (JEOL, Tokyo, Japan).
Research results
Orthogonal test of single bead and deposition of Ti-6Al-4V thin-wall parts
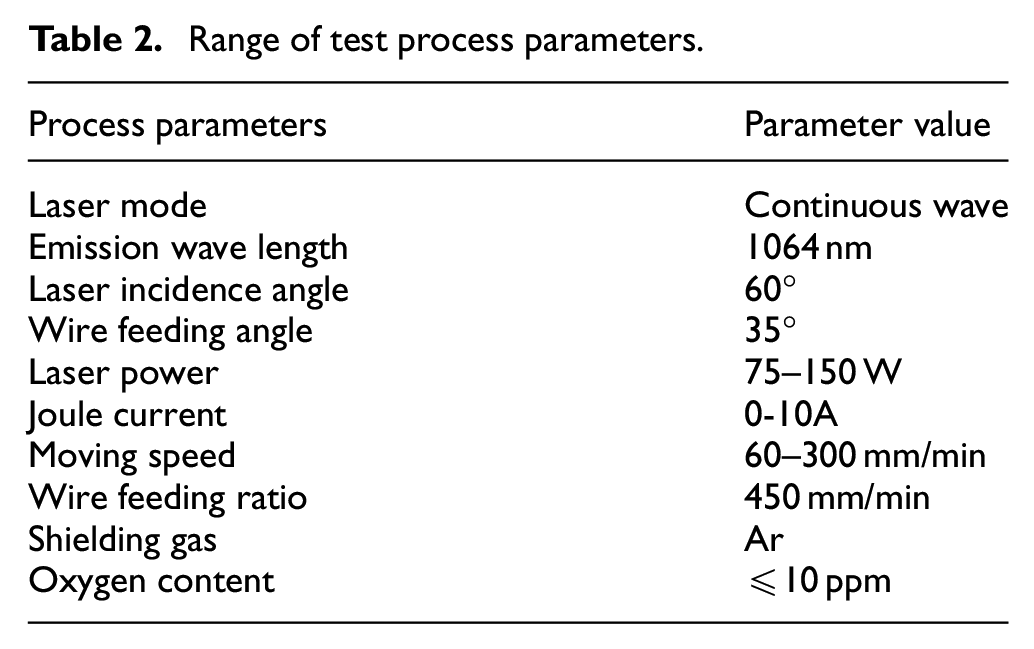
The quality of thin wall parts depends on whether the single welding track is smooth and continuous. The influencing factors of single bead deposition include laser power (P), travel speed (Vs), wire feeding speed (Vf), etc. Therefore, the orthogonal experiment parameters of P, Vf, and Vs were designed to study the main influencing factors of the geometrical characteristics of single pass forming, and the process parameters were optimized to obtain high quality single pass forming. Table 3 shows the orthogonal test table. Because the joule current entry reduces the dependence of single pass deposition on laser, and can’t actually affect the geometric characteristics of single bead, the joule current is set as the appropriate value of the test, and the blank processing is done. The length of single bead is 20 mm.
Orthogonal test process parameters.
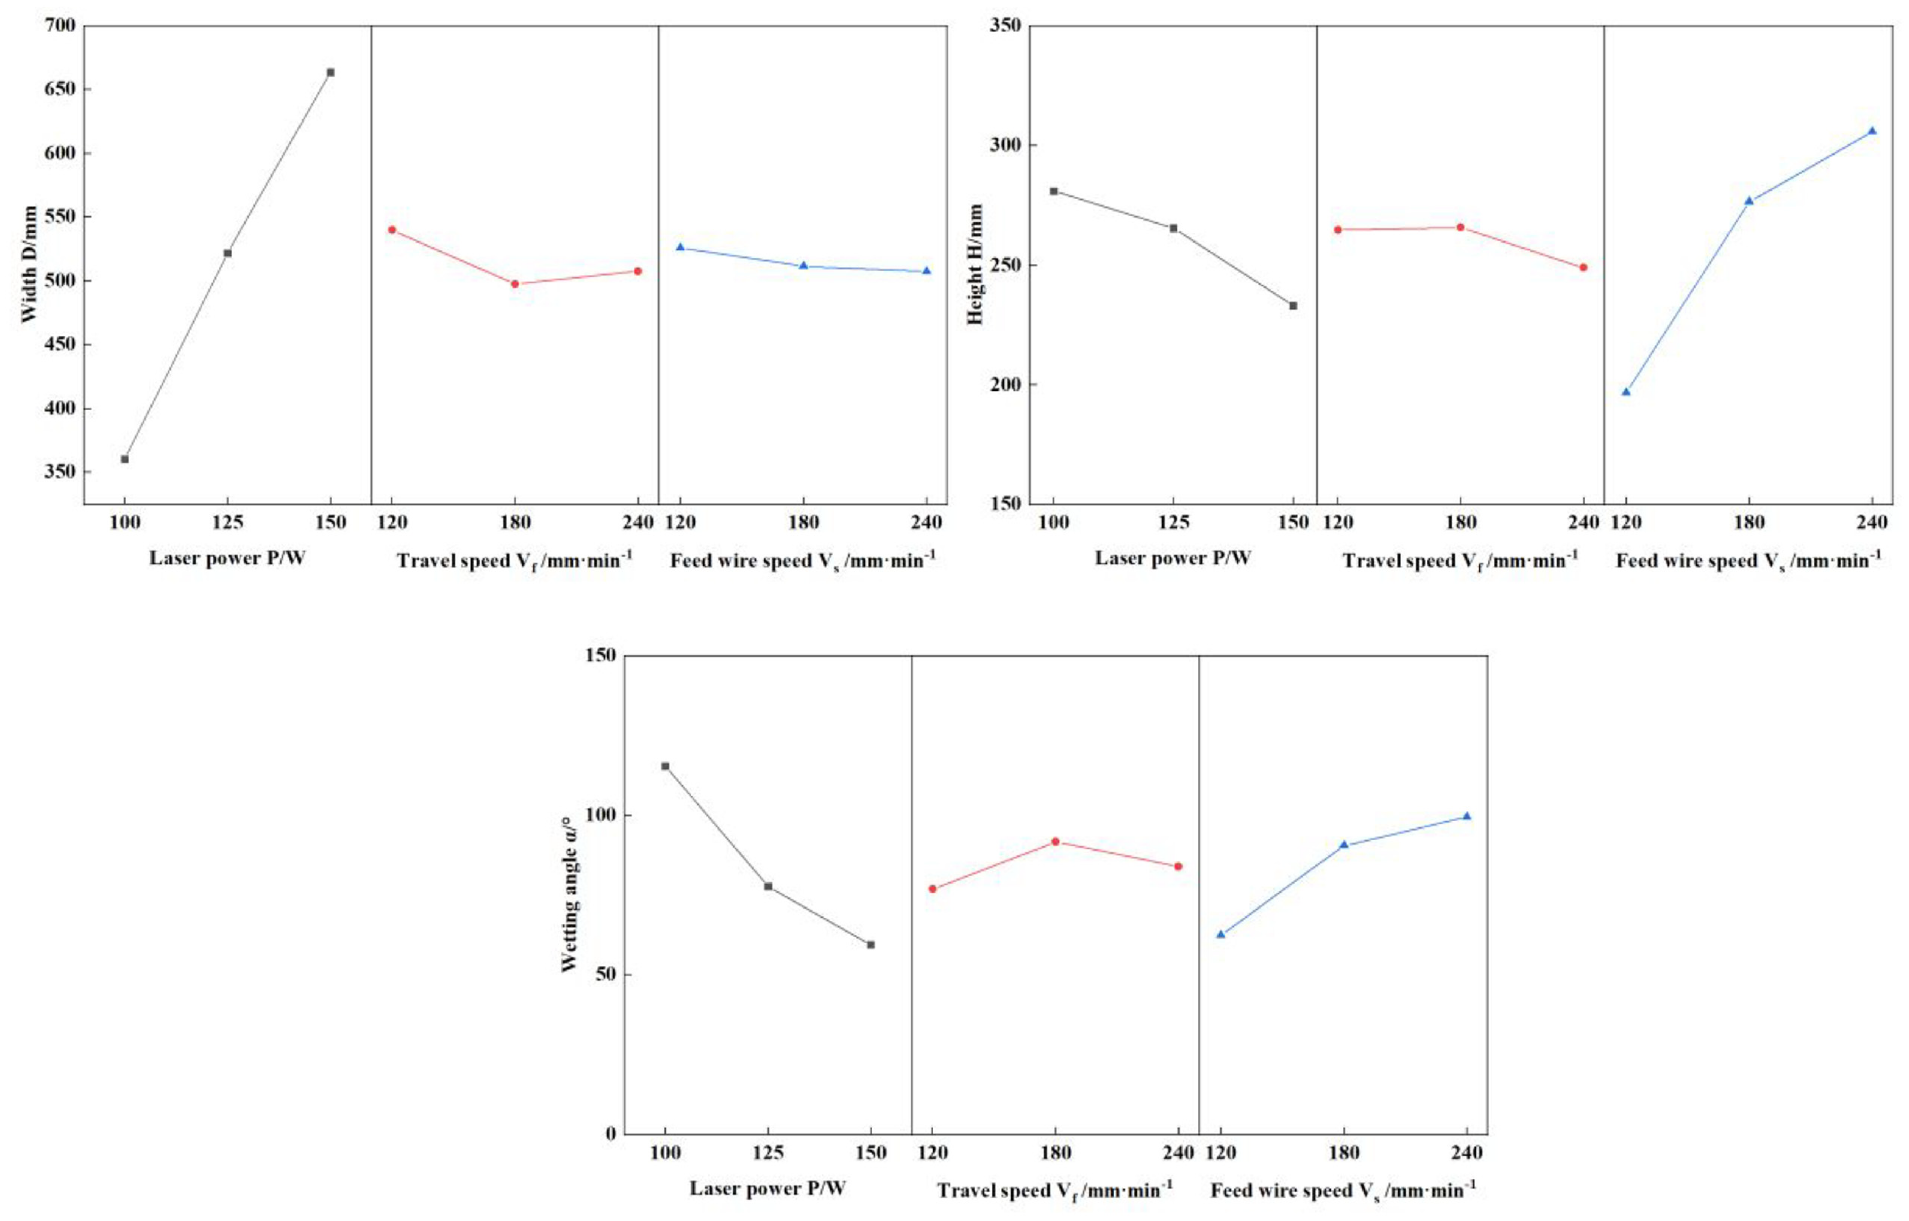
Table 4 shows the geometric feature sizes of 9 test samples. Anova test was conducted within 95% confidence level, and the mean value estimation graph shown in Figure 2 was obtained. It is found that the influence of laser power on the width and wetting Angle of single bead is significant, the influence of wire feeding speed on the wetting Angle is significant, and the influence of the height is the main effect, and the influence of moving speed on the forming geometric characteristics is the least. On this basis, the deposition quality of a single bead was observed, and its cross-section morphology was shown in Figure 3. It can be found that in test groups #2 and #3, the metallurgical bonding between metal wire and substrate is poor, which is easy to cause cracking and delamination. In addition, they are similar to #1 and #5 in that they have a large degree of wetting Angle, which will affect the surface roughness of the deposited parts and reduce the surface quality. From the perspective of the balance of single bead characteristics and energy use, too large melting width or too low melting height is not conducive to the preparation of single bead, while #4 has good metallurgical combination and moderate aspect comparison, which is conducive to the deposition of subsequent thin-walled parts. At the same time, the increase of the moving speed has little influence on the single bead. In order to improve the deposition efficiency, the maximum moving speed of 300 mm min−1 was used for the test.
The geometric characteristic size of the single bead deposition.
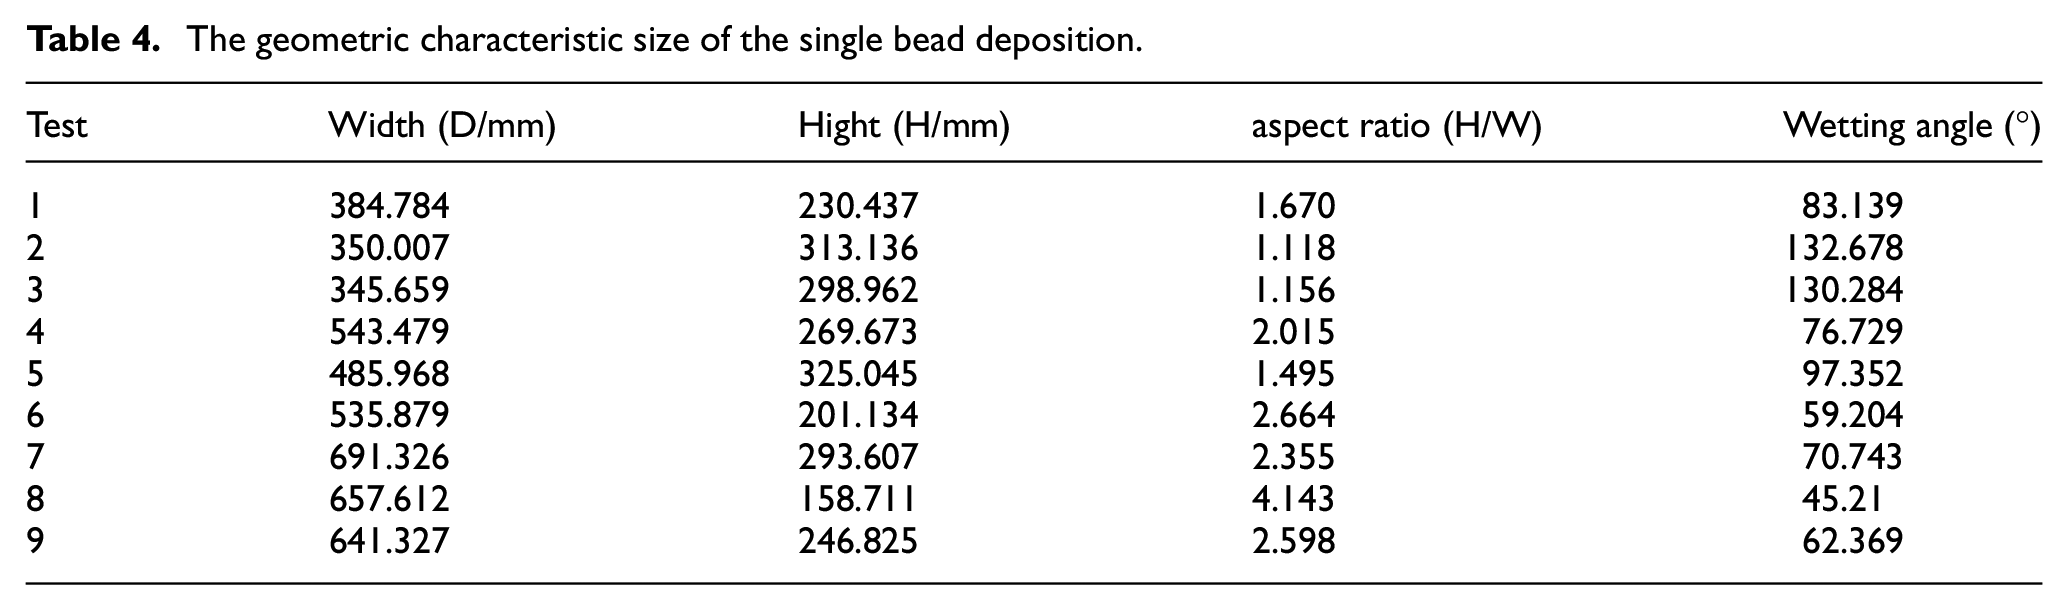
Mean estimation of the width, height, and wetting Angle of a single bead.
Cross section of single bead deposition.
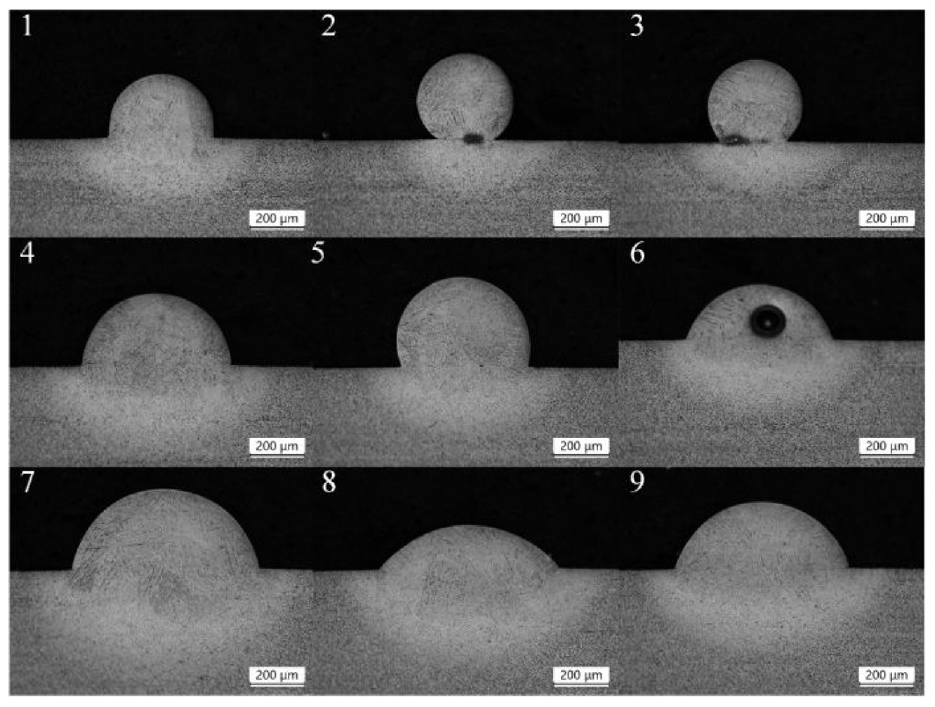
On the basis of good single bead deposition, the interlayer increment in the first few layers needs to be controlled in combination with the specific forming conditions. In order to ensure the deposition quality of the bottom layer, the output power of the laser needs to be properly amplified. With the increase of the number of deposited layers, the heat dissipation mechanism of thin-walled parts changes from three-dimensional heat dissipation to two-dimensional heat dissipation. In this process, a certain amount of heat accumulation will be generated. To ensure the stability of the deposition process, it is necessary to control the total heat of the molten pool at the end of the wire. The experiment adopted the method of gradually reducing the laser power and slowly increasing the joule current to achieve the purpose of energy saving. The thin-walled titanium alloy with 200 layers deposited is shown in Figure 4. The lengths at the fourth height of the thin wall were measured as 58.76, 58.52, 58.48 and 58.62 mm, respectively. The average value of 58.59 mm was taken as the length of the thin wall, and the maximum deviation was 0.28 mm. There were no defects such as collapse deformation at both ends of deposition, and the forming surface quality was good.
Thin-walled parts in Ti-6Al-4V titanium alloy: (a) front facing view and (b) side view.
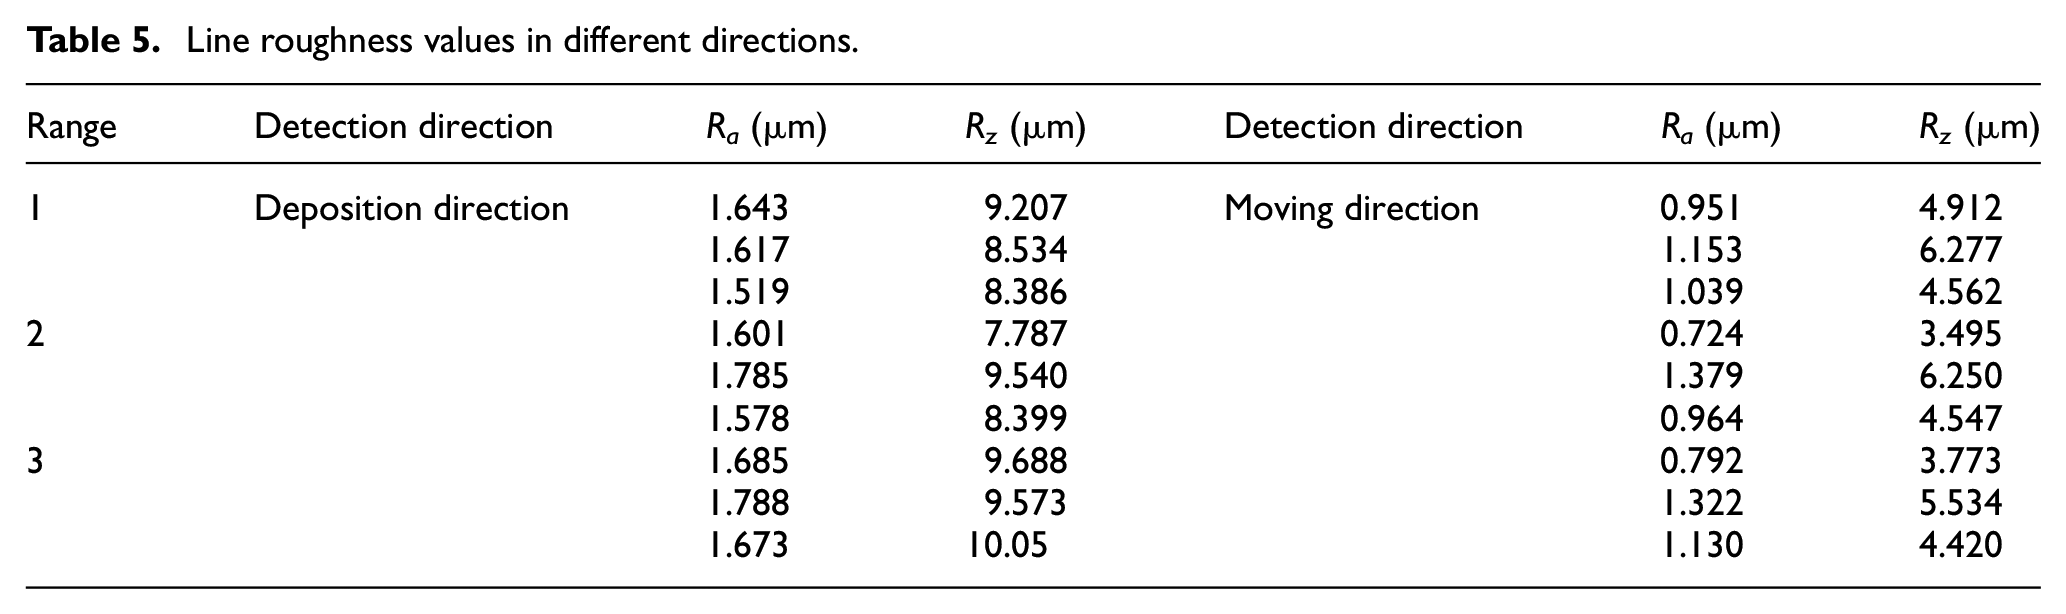
Surface roughness analysis
Three areas of thin-walled parts were selected for surface roughness Ra measurement. The average value of three test results of deposition direction and movement direction of each area was obtained. The specific measurement results are shown in Table 5 below. It can be seen from the measurement results that the average surface roughness Ra in the deposition direction is 1.65 μm. The average surface roughness Ra in the direction of movement is 1.05 μm. The results demonstrate that the surface roughness Ra of the thin-wall structure is good, the measured surface is flat and the surface quality is high. And the fluctuation range of surface roughness is small, there is no obvious “ladder effect.”
Line roughness values in different directions.
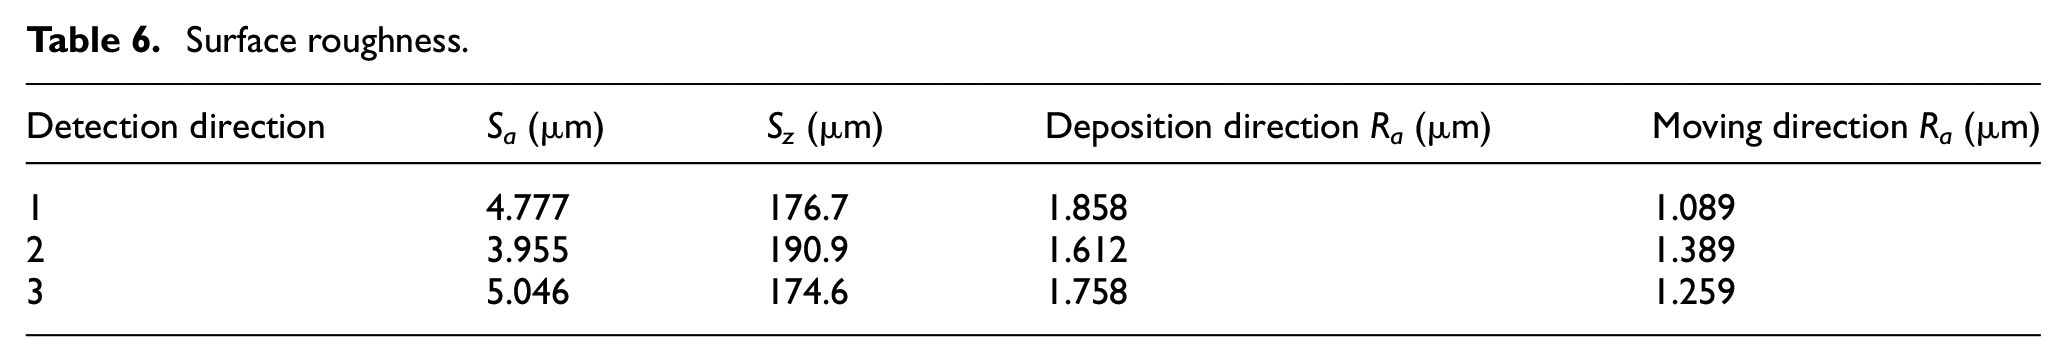
The previously measured areas were repeatedly selected for 3D topographic map scanning using confocal microscopy. In order to make the detection results more accurate, it is necessary to level and filter the image, and then select the horizontal and vertical midline of the topographic map to detect the surface roughness Ra value. Topographic maps and surface roughness Ra values of the three regions obtained are shown in Figure 5 and Table 6. The surface roughness Ra values in the deposition direction range from 1.612 to 1.858 μm, and the surface roughness Ra values in the moving direction range from 1.089 to 1.389 μm. However, the surface roughness Sa is between 3.955 and 5.046 μm, and the surface roughness is slightly higher than the linear roughness Ra, which may be because the existence of grain boundary affects the scanning of the surface. Compared with the results measured by mechanical method, it can be found that the surface roughness Ra values are almost the same, and the surface roughness in the deposition direction is slightly higher than that in the moving direction, which is determined by the unique process of wire feeding additive manufacturing.
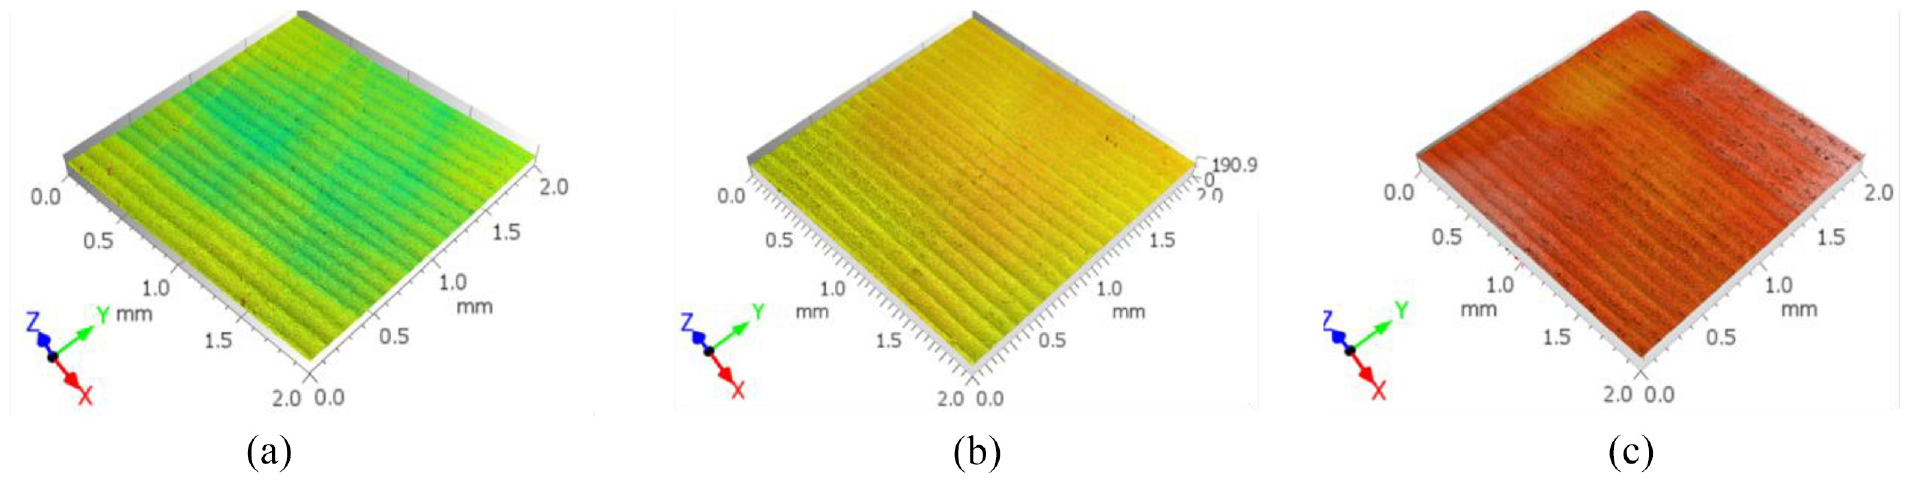
Surface morphology and profile and surface roughness detection based on ISO-25178 standard: (a) the first region, (b) the second region, and (c) the third region.
Surface roughness.
It can be found from the topographic map that there are a total of 18 clearly visible sedimentary profiles within the measured range, and there are no large protrusions or fluctuations in the direction of movement, and these profiles are consistent and uniform, indicating good stability in the middle height during the deposition process. Secondly, compared with other wire feeding processes, the “ladder effect” formed by metal fine wire deposition is more compact, and there is no splash bond produced by molten pool impact under high power. This shows that by controlling the laser energy to form a small molten pool and melt deposition of small diameter wire, the unique “ladder effect” of wire feeding additive manufacturing can be weakened to a certain extent, so as to improve the surface quality of deposited parts.
However, the surface roughness of thin-walled parts is affected by the deposition direction, and there is a unique “ladder effect” in the deposition direction. Therefore, the surface roughness Ra value in the moving direction is lower. The Ra values obtained by the two measurement methods have this characteristic, and the results are consistent, which proves that the data obtained is reliable.
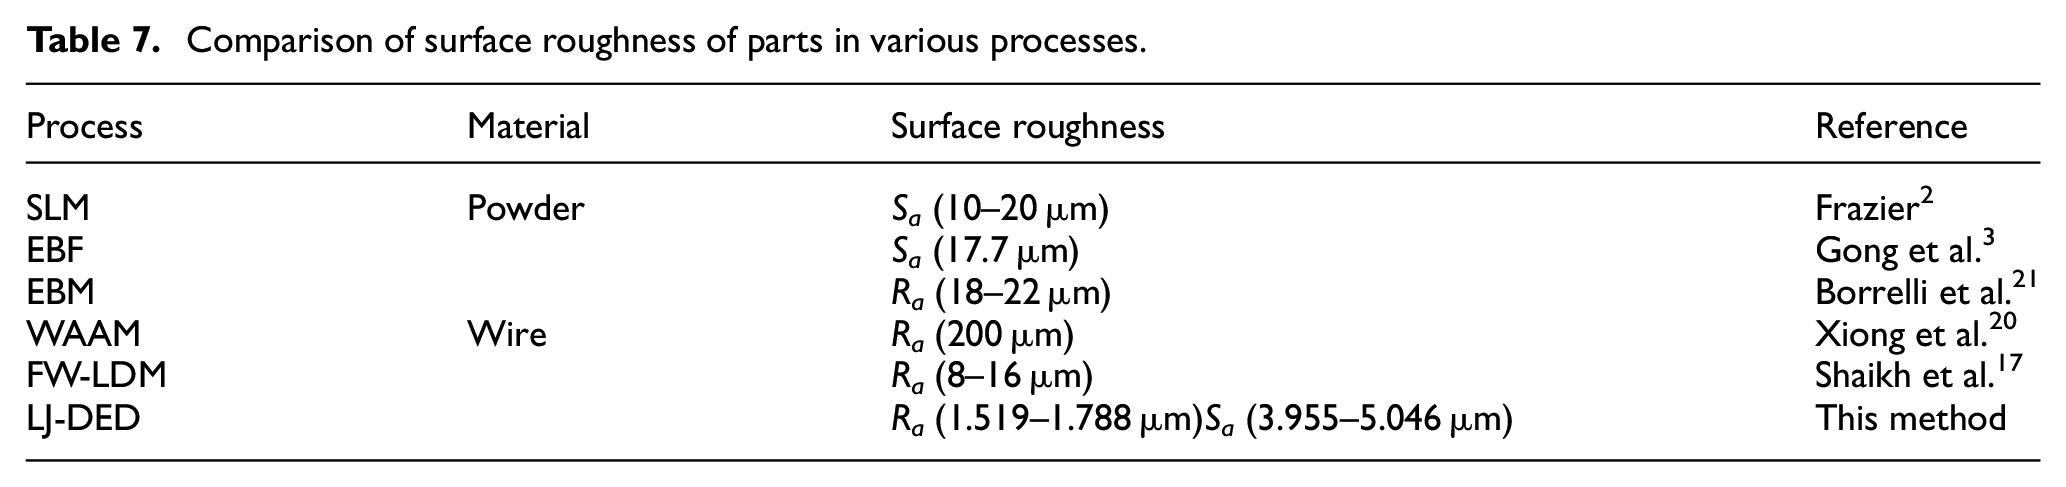
As shown in Table 7, the surface roughness of the deposited parts of this process is smaller than that of mature SLM process, and its surface quality is much higher than that of most existing wire feeding additive manufacturing processes, which can greatly reduce the process and time of post-treatment, and provide a certain process reference for the preparation of parts with high surface roughness.
Comparison of surface roughness of parts in various processes.
XRD characterization
Figure 6 demonstrates the microstructural constituents under this process measured via XRD analysis. It can be seen from this Figure that the α phase proportion of thin-walled titanium alloy samples under this process is the component phase with the highest content of thin-walled parts, and the diffraction peak has the highest three strong peak at 2θ values of 35.43°4, 40.51° and 70.95°. However, there is no obvious β-phase diffraction peak in the results, which may be because its content in the thin wall is too small to be detected by X-ray.
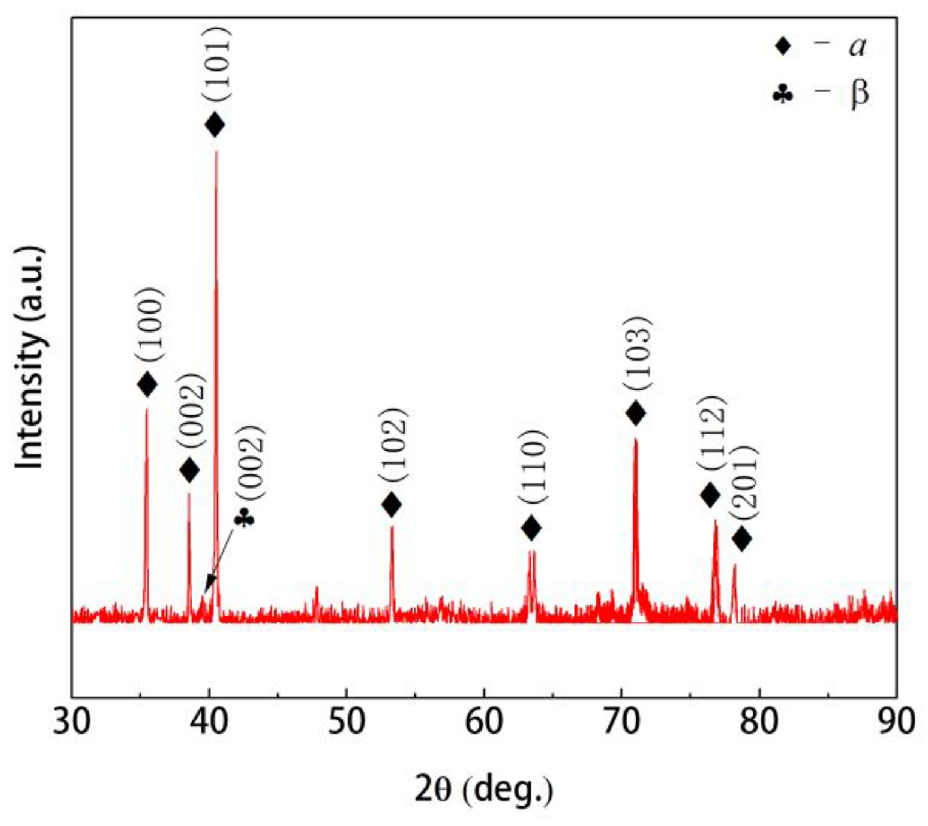
XRD of the TC4 thin-wall parts.
Organizational characteristics
Figure 7 shows the macro morphology of the formed thin-walled surface under OM. There are columnar grains penetrating the deposition direction on the surface of the thin wall, and the surface presents bright and dark luster. The stripes are evenly distributed and inclined at a certain angle with the moving direction. The size of columnar grains is mainly within 1–2 mm. Due to the influence of thermal cycle and unidirectional heat conduction in the middle layer during the deposition process, the fusion boundary is reheated, and the columnar grains in the lower layer will continue to grow with the temperature gradient, this is similar to the columnar grains produced by electron beam and arc fuse deposition processes.
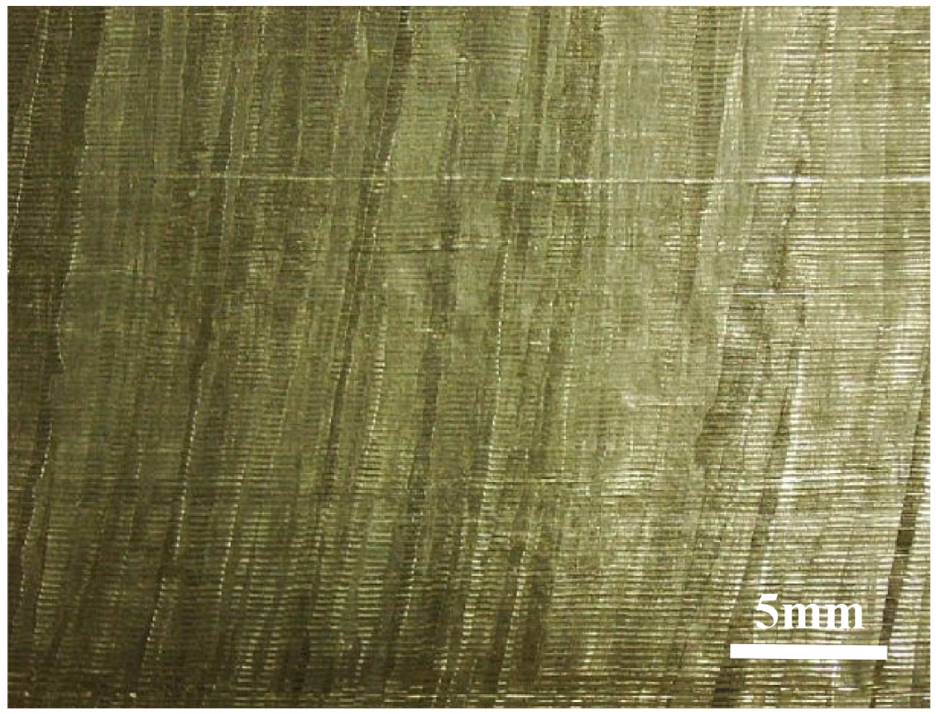
Columnar grains inclined along the deposition direction.
In order to comprehensively analyzes the microstructure of the thin wall of titanium alloy, the bottom, middle and top of the sample were selected for observation. Figure 8 is the sedimentary bottom observed by OM. The dark heat affected zone (HAZ) between the layers can be clearly seen in the bottom of the primary β crystal. The thickness of HAZ increases with the increase of the number of layers and gradually fades after the heat input is reduced. This process begins to generate heat accumulation, which increases the thickness of the HAZ. Secondly, excessive accumulation is easy to lead to the gradual increase in the width of the thin wall, and the heat input should be reduced to promote the balance between heat dissipation and accumulation, which is the HAZ gradually began to fade. Thirdly, with the increase of the number of layers and heat accumulation, the primary β crystals can grow upward under high temperature gradient.
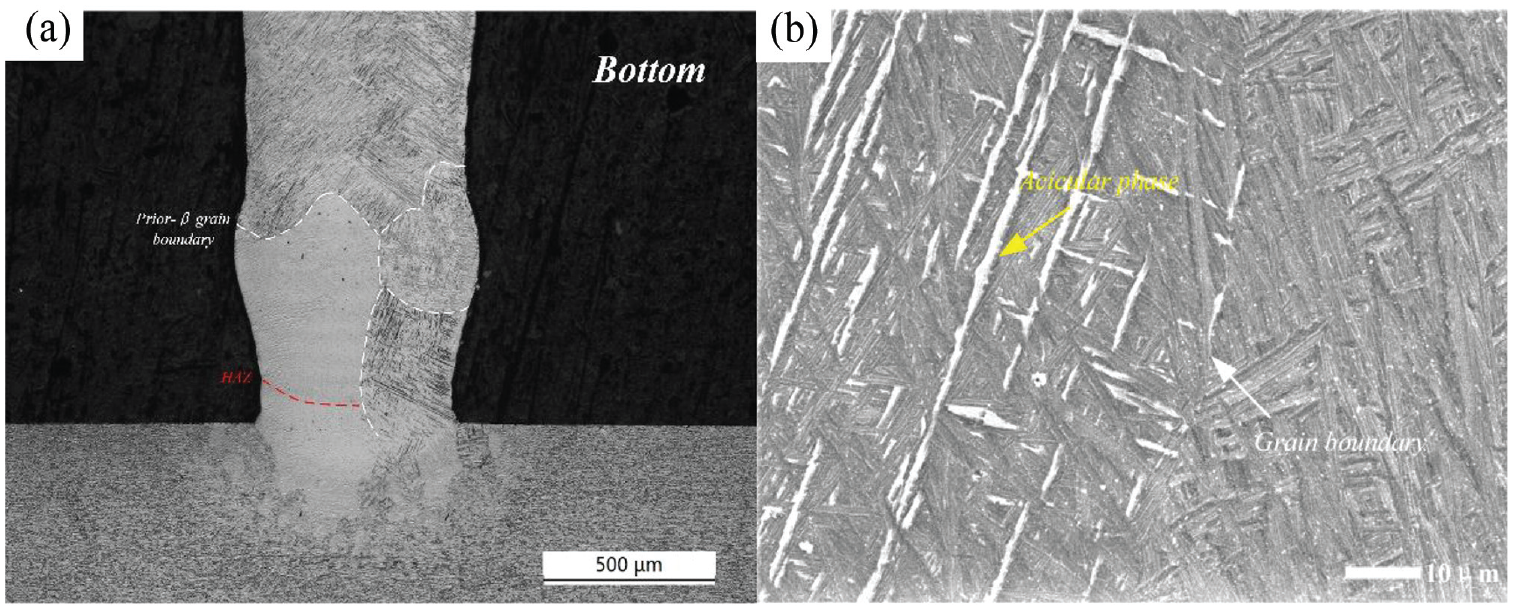
The bottom structure of a titanium alloy thin wall: (a) OM and (b) SEM.
Under the influence of multiple thermal cycles, a 55 μm acicular phase grew in the primary β crystal, as is shown in Figure 8. However, the number of spiculate phases near the grain boundary is small and the length is short. During the heating process, the needle-like α' phase occurring near the grain boundary will be transformed into α phase. At the same time, the nearby residual β phase will gradually grow and transition to α phase during the cooling process, so that the length of the needle α' near the grain boundary is reduced or interrupted. The microstructure outside the grain is more stable in the thermal cycle than the microstructure inside the grain, which is composed of α phase Weil’s microstructure.
Figure 9 shows the central organization under OM. The thin wall has a curved layer structure, which is caused by layer-by-layer deposition of HAZ. The microstructures in the middle of the thin-walled parts are mainly acicular α' and α phase with weak interlayer boundary. There are flaky primary α phases at both ends of the parenchyma, while the interleaved acicular α and martensitic α are the main structures inside the parenchyma. In the SEM of Figure 9(b), relatively dense flake tissue can be observed, and there is also newly generated secondary phases near the flake tissue, the size of which is much smaller than that of α phase in the net basket tissue. This phenomenon is that with the increase of the number of layers, gradually away from the substrate layer, the temperature gradient of the thin-walled structure decreases, and its heat conduction ability is gradually weakened, and the tissue grows gradually along the direction of heat flow, thus forming a needle bundle set. The cooling rate at the center of the parts is much lower than that of the two sides, and the residual β phase changes into the massive α through high temperature growth.
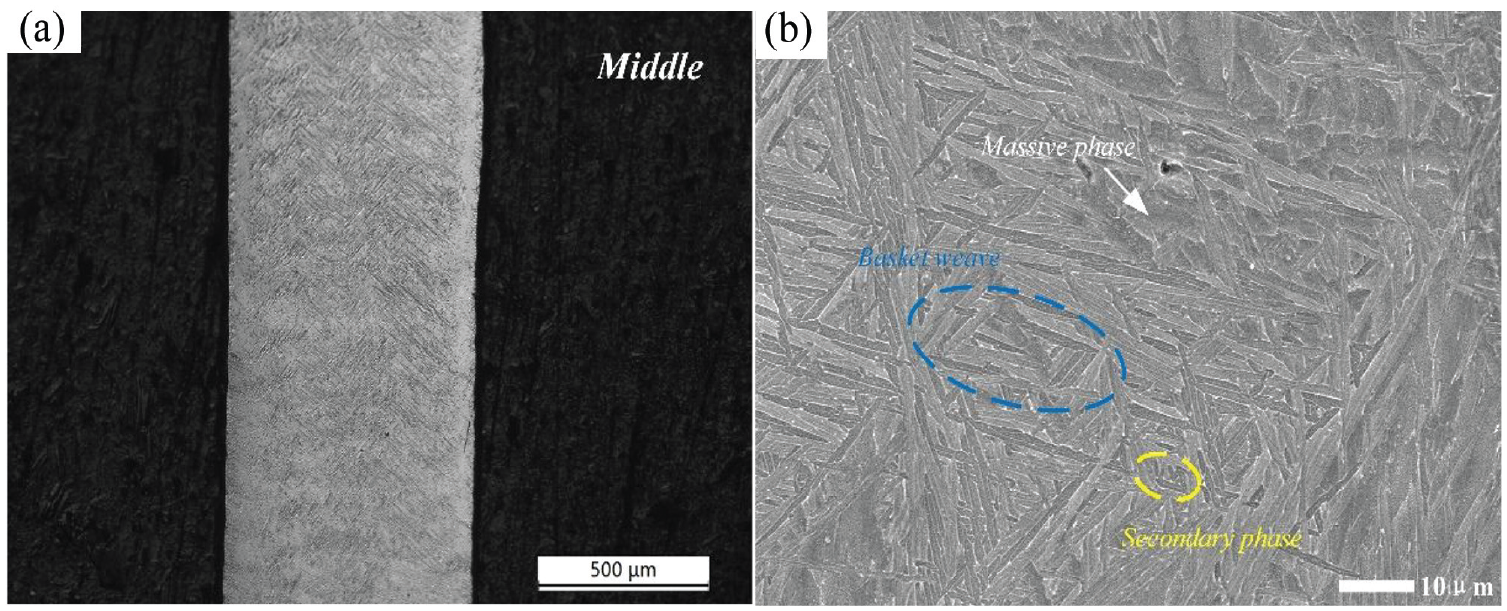
The middle structure of a titanium alloy thin wall: (a) OM and (b) SEM.
OM and SEM showed that the top of the thin-walled part is dominated by a reticular Widmanstädter structure, showing the interleaved distribution of elongated acicular martensite α' and acicular α, as is shown in Figure 10. The formation conditions of the top sedimentary layer and the previous tissue are not quite the same, mainly due to the transformation of the heat dissipation mode. In the process of the rapid change of extremely hot and cold temperature, there is a great degree of supercooling, so that the needle-like α phase transition finer, at this time the environment can’t make the α phase fully growth, resulting in fine needle-like α, accompanied by a large number of α points.
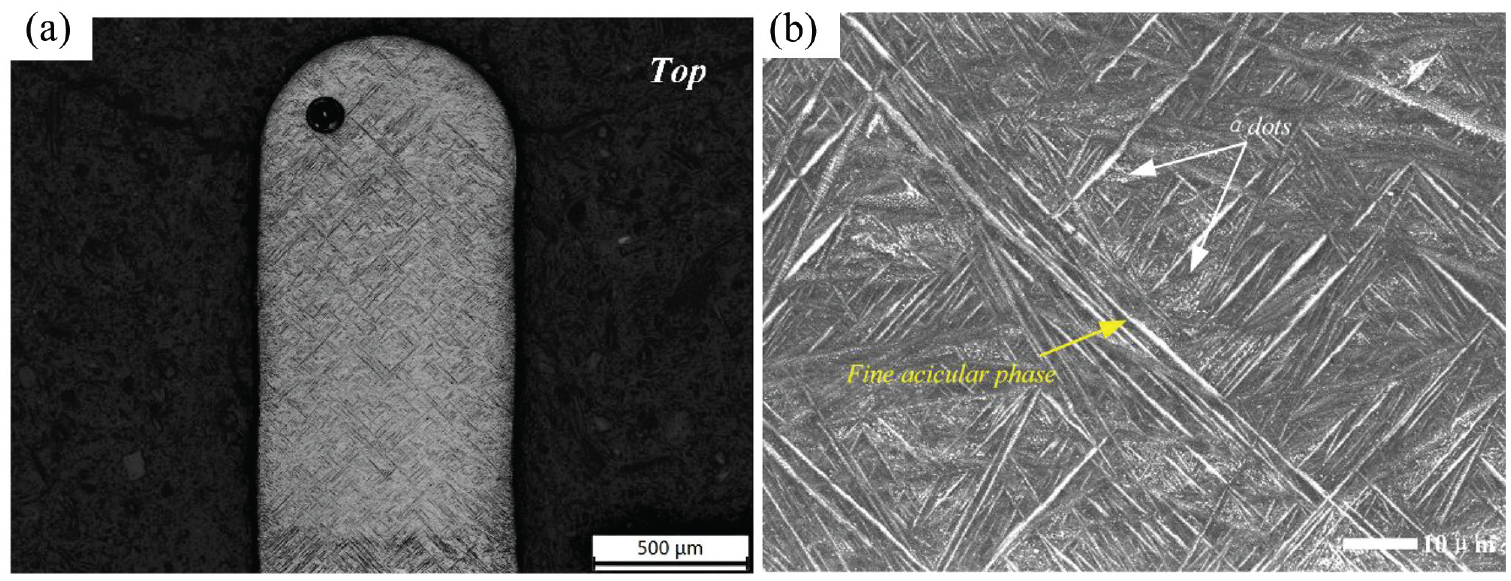
The upper structure of a titanium alloy thin wall: (a) OM and (b) SEM.
Hardness test
Figure 11 shows the microhardness in the thin-wall deposition direction. Under the condition of applying 0.2 N load with 10 s, take a point every 0.5 mm along the deposition direction to measure the microhardness of this position. The measurement results show that the microhardness of the bottom of the deposited thin wall is relatively uniform, and the microhardness shows an increasing trend, maintaining at about 337HV. When approaching the middle part, the microhardness fluctuates to a certain extent, and tends to be stable when approaching the top. The overall microhardness decreases slightly, this may be due to the dispersion of the basket structure in the middle of the thin-walled part, which makes the hardness have a small jump, and the point that has not completely transformed into the α phase weakens the hardness of the top region, but remains between 320 and 330 HV.
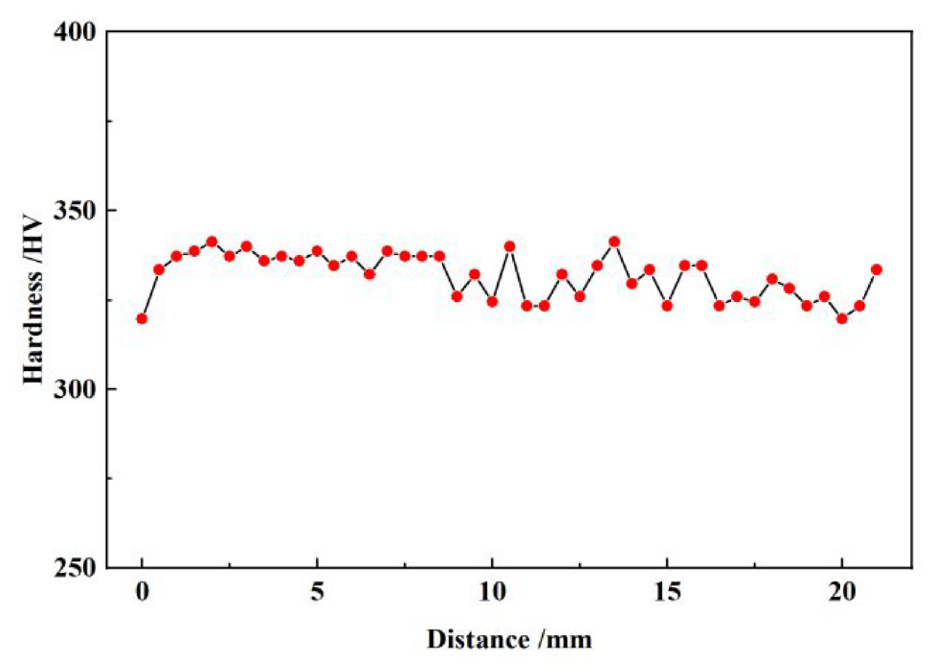
Microhardness distribution of Ti-6Al-4V thin-walled part.
Tensile test
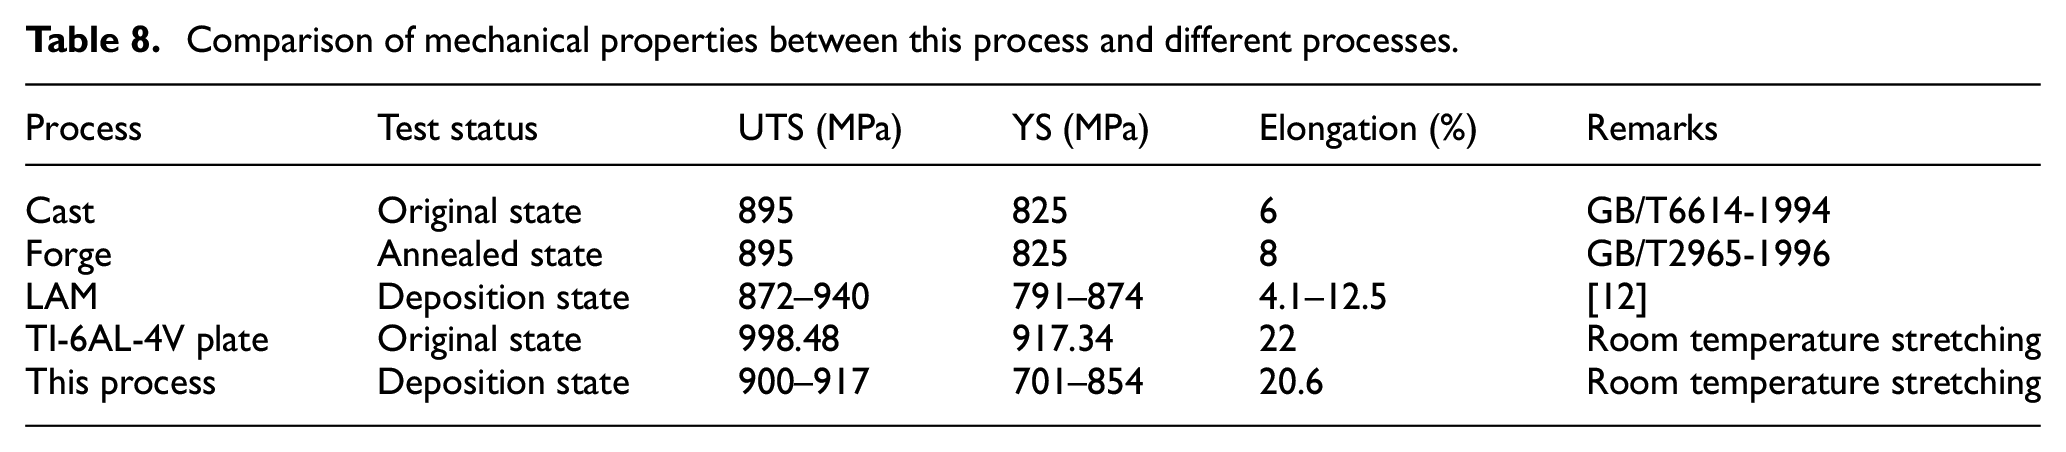
In this test, non-standard parts were used to make tensile samples due to the limitations of titanium alloy thin-wall deposition size, and two groups were tested in each direction. The specific sampling location and size are shown in Figure 1(d). At room temperature, the tensile property of the substrate material is 990.57 MPa, the yield strength is 987.95 MPa and the total elongation is 20%. The maximum ultimate tensile strength in the moving direction of the thin-walled specimen is 910.51 MPa, the elongation is 20.4%; The maximum ultimate tensile strength in the deposition direction is 917.56 MPa, the elongation is 20.6%. Stress–strain curves as is shown in Figure 12. The tensile strength in the moving direction is slightly higher than that in the deposition direction, but the yield strength is lower than that in the deposition direction. The mechanical properties of the formed titanium alloy thin wall are slightly lower than that of the substrate, which can be compared with forging and casting. The data are shown in Table 8.
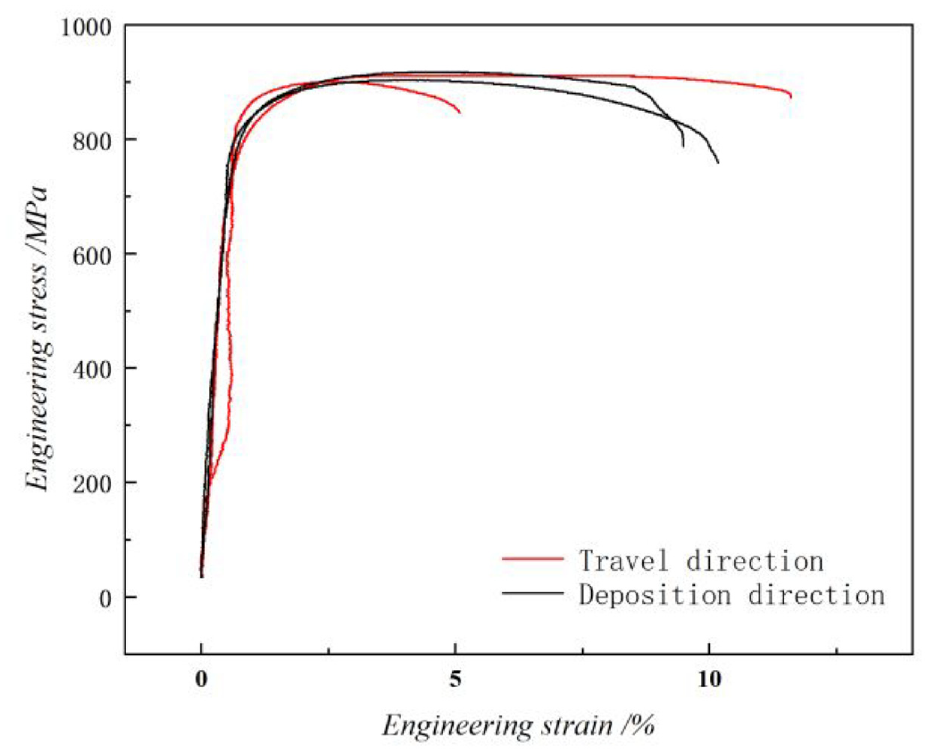
Stress–strain curves and size comparison before and after stretching.
Comparison of mechanical properties between this process and different processes.
The tensile fracture at room temperature was observed by JSM-IT500LA scanning electron microscope, as shown in Figure 13. The fracture surfaces in the deposited state have dimples of different sizes, indicating that the fracture mode is ductile fracture. The size of the fracture dimple in the deposition direction is larger and shallow, while the dimple in the moving direction is smaller and denser, and the mechanical properties of the sample are anisotropic, the performance in the deposition direction is higher than that in the moving direction, and the plasticity in the deposition direction is relatively poor.
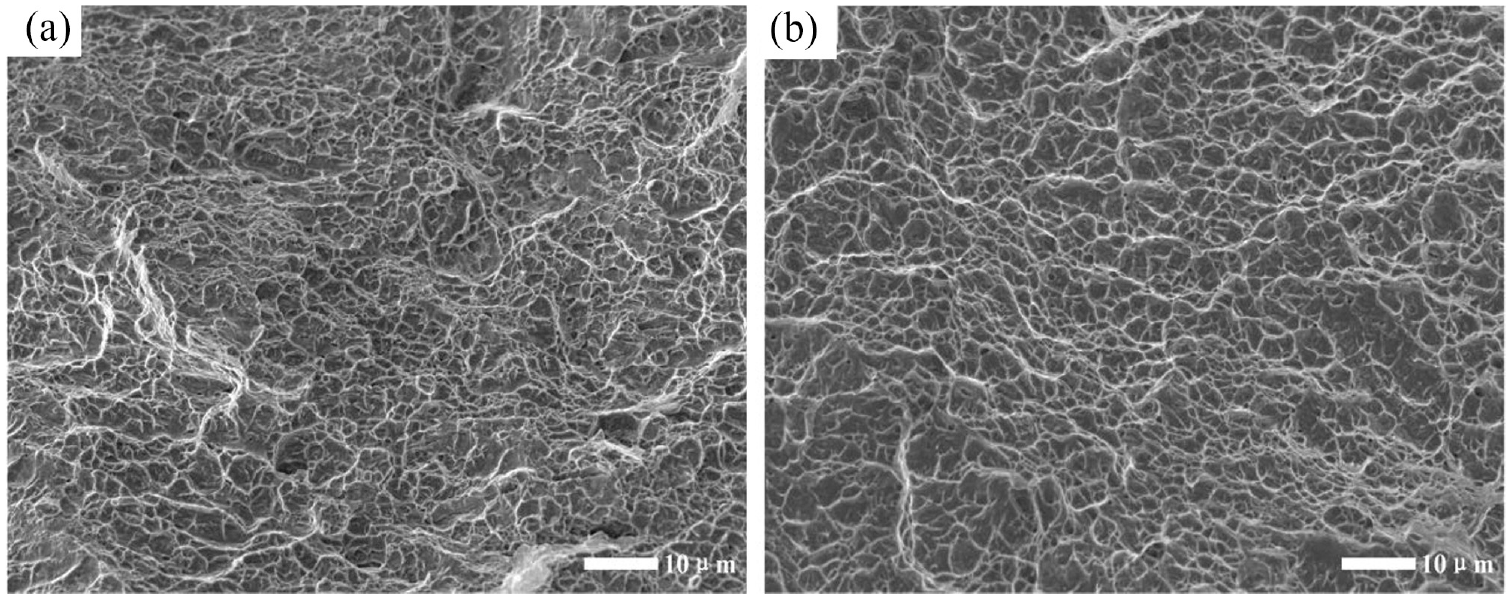
Fracture morphology: (a) deposition direction and (b) moving direction.
Conclusion
In this study, used Ti-6Al-4V titanium alloy wire with a diameter of 0.3 mm was deposited by laser and Joule heat as the composite heat source, and finally the thin-walled titanium alloy with high surface quality was obtained. The surface roughness, the dimensional accuracy, microstructure and mechanical properties were tested. From the analysis and experiment results, the conclusions are as follows:
The forming process of single bead was optimized by the method of variance analysis and visual analysis through orthogonal experiment, and it was found that the laser power had significant influence on the width and height of single bead, and the wire feeding speed had significant influence on the wetting Angle. By controlling the input laser energy to form a small molten pool, using the joule current to preheat the wire, the dependence on laser power can be reduced to obtain the thin-walled parts with high surface quality.
The forming size deviation of the thin-walled titanium alloy prepared by this process is less than 0.28 mm, which indicates that the roughness Ra is less than 2 μm. Under this process condition, the surface quality of the deposited state is better than that of the mature powder feeding process, which is much higher than that of the existing wire feeding additive manufacturing.
There are columnar grains inclined to the moving direction on the surface of the deposited thin wall, and the growth of columnar grains is mainly related to the temperature gradient. Through the microscope, it can be seen that the metallographic structure of the cross section has obvious arc-shaped layer structure. The microstructure is mainly Widmanstädter structure, and needle like structures of different sizes α, Acicular martensite α’ and α phase.
The hardness of titanium alloy thin wall is 320–330 HV, which is slightly different at different layer height, and the overall difference is less than 10 HV. The maximum ultimate tensile strength of the tensile sample is 917.56 MPa, the ultimate tensile performance in the deposition direction is better than that in the traveling direction. The elongation is 20.6%, the fracture is ductile fracture, and the mechanical properties are better than those of forging and casting.
Footnotes
Declaration of conflicting interests
The author(s) declared no potential conflicts of interest with respect to the research, authorship, and/or publication of this article.
Funding
The author(s) disclosed receipt of the following financial support for the research, authorship, and/or publication of this article: This research was supported by 173 Program. At the same time, thanks to National Innovation Institute of Additive Manufacturing (Xi’an) to provide support.