
Abstract
We propose a digital signal processing method based on variational mode decomposition (VMD) and wavelet thresholding, which is applied to time of flight (TOF) estimation in the detection of second-harmonic ultrasonic signals for internal material defects, aiming to achieve accurate condition assessment of the detected objects. This study is to address the key challenges: “noise masking of second-harmonic signals” and “difficulty in identifying echo onsets,” thereby enabling precise condition assessment of the detected mechanical structures. The hypothesis of this study is as follows: By adaptively decomposing echo signals and separating different frequency components via VMD, and combining wavelet thresholding to denoise and reconstruct the decomposed modal components, this method can effectively improve the signal-to-noise ratio (SNR) of the second-harmonic component in the echo and accurately locate the echo onset. Specifically, the echo signal is processed using the variational mode decomposition (VMD) method. The decomposed components denoised using a wavelet threshold technique, and the denoised components are subsequently reconstructed by summation to identify the echo’s starting point. The method’s efficacy is validated through experimental data obtained from a laser wire-cut aluminum plate with cracks, demonstrating its suitability for scenarios with unknown crack signal characteristics and low signal-to-noise ratios.
Keywords
Introduction
Ultrasonic testing has emerged as a cornerstone technique in non-destructive evaluation (NDE), with its widespread adoption across industrial sectors driven by exceptional accuracy, operational efficiency, and non-invasive characteristics.1–3 When the material is subjected to the strong amplitude excitation signal of the ultrasonic wave, the nonlinear effect will be generated inside the material, which is mainly caused by the change of material properties, such as stress change, the existence of small defects and other factors may cause this phenomenon.
Traditional ultrasonic detection technology relies on the linear characteristics of sound waves, such as reflection, scattering, and attenuation. 4 The nonlinear ultrasonic detection technology utilizes the interaction between ultrasound and microdefects in materials to produce nonlinear acoustic signatures, 5 and this technology can detect micro-defects. 6 When the defect is microscale, it is difficult for traditional detection methods to effectively identify it. Though the presence of incipient material damage, nonlinear ultrasonic testing (NUT) demonstrates exceptional sensitivity by exploiting defect-induced nonlinear elastic responses. These responses manifest as distinct waveform distortion phenomena, higher-order harmonic generation, and modulation sidebands localized at the defect site, as substantiated in prior studies. 7 Hu used nonlinear ultrasonic technology to measure materials containing defects, and analyzed the relationship between non-collinear measurement parameters with plastic strain and fatigue frequency, indicating that the technology can effectively evaluate the plastic deformation and fatigue damage existing in materials. 8 Morris et al. effectively detected the dislocation and cracks caused by fatigue damage in magnesium plate through the second harmonic signal. 9 Under second-order perturbation, Bermes et al. used waveguide excited modal analysis to study Lamb’s second-harmonics generation in layered planar structures with non-ideal interfaces. 10 The results indicate that Lamb wave second-harmonics generation efficiency is closely related to the interface stiffness constant, and this effect can be used to evaluate the interface conditions of layered planar structures. It can be seen that defects in materials can be identified by nonlinear ultrasonic technology. For microscale defects, the fundamental signal changes may not be obvious, and the second harmonic wave is more sensitive to the nonlinear changes caused by small defects, and can identify the existence of small defects more clearly. Compared with the fundamental wave, the second harmonics are less affected by grain scattering and other factors.11,12 The non-uniformity of the material microstructure greatly interferes with the fundamental signal, and it is easy to cover up the information of small defects, but the second harmonic can avoid these interferences to a certain extent and reflect the characteristics of small defects more accurately.13–18 In order to better process the collected defect signals, some scholars have also explored this issue. Lang et al. leveraged variational mode decomposition (VMD) and adaptively updated two key parameters—the number of modes (K) and the penalty factor (α)—via the matching pursuit algorithm. Compared with traditional methods such as multivariate variational mode decomposition (MVMD) and multivariate empirical mode decomposition (MEMD), this algorithm enhanced the robustness against noise and mode mixing in multivariate signals, leading to a significant reduction in decomposition errors. The effectiveness of the algorithm was validated using mechanical vibration signals. 19 To further improve the signal classification capability and the ability to analyze the complexity of time series, Li et al. incorporated dispersion entropy as a supplementary feature into the CEEMDAN energy entropy plane and proposed a 3D causal complementary complexity, expanding the representation space from 2D to 3D. Practical experiments demonstrated that the proposed 3D causal complementary complexity exhibited better performance in ship signal classification and bearing fault diagnosis. 20 Zhang et al. proposed a singular spectrum mode ensemble (SME) method, which utilizes high-order Hankel matrices and singular value decomposition (SVD), supplemented by the proposed fast singular spectrum decomposition (FSSD) and a grouping method based on the correlation between singular values and frequency bands. 21 This method achieved extremely high resolution in the frequency domain, facilitating the separation of mixed components in the frequency spectrum. Morante introduced variational latent mode decomposition (VLMD), a novel algorithm for extracting oscillatory modes and associated connectivity structures from multivariate signals. 22 This algorithm addresses the key limitations of existing multivariate mode decomposition (MMD) techniques by solving a constrained variational optimization problem that jointly enforces reconstruction fidelity, sparsity, and frequency regularization.
The standard time-of-flight (ToF) methods mainly include the pulse-echo detection method, the indirect ToF (iToF) method based on phase modulation, the linear guided-wave ToF method, and the signal-correlation method, etc.23–26 These methods generally rely on a linear propagation model and achieve distance measurement through threshold detection, peak identification, or phase-difference calculation. Compared with the method of this study, the traditional pulse-echo method has difficulty in extracting weak second-harmonic signals and has an insufficient signal-to-noise ratio. The iToF system may introduce harmonic distortion and aliasing due to square-wave modulation, resulting in non-linear measurement errors. The linear guided-wave ToF method ignores the non-linear propagation characteristics of the medium and cannot capture the specific interaction between the second-harmonic and the microstructure. This study effectively overcomes the above problems through non-linear signal modeling, improving the detection accuracy and stability of the second-harmonic echo. However, noise from environmental factors, data acquisition systems, and other sources often compromises the quality of ultrasonic signals in nonlinear detection, necessitating advanced signal processing techniques. Moreover, accurately extracting the echo starting point is crucial for early crack detection. The precise identification of the echo starting point directly determines the calculation accuracy of the time of flight (ToF) of the ultrasonic signal. Therefore, in order to accurately evaluate the crack location and size, it is necessary to de-noise the echo signal and determine the new starting point of the echo.
In view of the characteristics of second-harmonic signals in non-linear ultrasonic testing, such as low signal-to-noise ratio, complex frequency characteristics, sensitivity to tiny defects but being easily masked by noise, a combined processing framework of “targeted mode screening + adaptive threshold optimization” is proposed: (1) Mode screening mechanism: by calculating the correlation coefficient and energy proportion between each VMD decomposition component and the original signal, high-noise components are removed, addressing the problem that redundant modes in traditional VMD decomposition interfere with the extraction of second-harmonic. (2) Threshold parameter adaptation: according to the characteristics of second-harmonic signals, the combined effects of various threshold-estimation methods such as rigrsure and heursure and wavelet bases such as db5, coif2, and sym7 are compared. Finally, the soft-threshold processing of “rigrsure threshold + sym7 wavelet base” is selected to improve the signal-to-noise ratio of the second-harmonic. (3) Scene-specific application: this combined method is applied to the second-harmonic detection of cracks in laser-wire-cut aluminum plates for the first time, verifying its effectiveness in “low-signal-to-noise ratio” scenarios (relative error <1%), filling the gap in the fine processing of non-linear ultrasonic second-harmonics in existing methods.
The following text will be structured as follows: Chapter 2 elaborates on the denoising principle of VMD combined with wavelet thresholding in detail. This includes the variational decomposition model of VMD, its iterative optimization process, as well as the selection of basis functions for wavelet thresholding, threshold processing, and signal reconstruction steps. Chapter 3 introduces the hardware construction of the nonlinear ultrasonic testing system (such as the RAM-5000-SNAP device, KEYSIGHT oscilloscope) and experimental settings (parameters of the 6061 aluminum alloy specimens, crack processing methods, and calculation of ultrasonic propagation paths). In Chapter 4, key parameters of VMD (K, α) and wavelet thresholding (basis functions, threshold methods) are determined through experiments. The denoising effect of this method is verified and quantitatively compared with traditional methods such as EEMD, SSA, and STFT. Chapter 5 analyzes the processing results of echo signals under different transducer spacings (0.4–1.0 cm) to verify the consistency between the ToF estimated values and the theoretical values. Chapter 6 assesses the detection robustness of the method and its ability to detect micro-cracks through experiments on “asymmetric transducer arrangement” and “cracks of different depths (0.5–3 mm).” Chapter 7 summarizes the research conclusions and clarifies the application value of this method in SHG ultrasonic testing.
VMD combined wavelet threshold noise reduction principle
In the process of signal acquisition, the second harmonic noise in the echo signal makes it impossible to determine the echo starting point. In order to improve the signal to noise ratio of echo signal and obtain pure second harmonic ultrasonic signal echo signal, and further determine the echo starting point, it is necessary to de-noise the collected defect echo signal. Based on the echo signal obtained from aluminum plate with different depth cracks, the echo signal is decomposed by variational mode decomposition method, and the decomposed component is denoised by wavelet threshold, and then the denoised component is added to reconstruct.
Variational mode decomposition
As an adaptive variational mode decomposition method, VMD can decompose complex signals into intrinsic mode functions (IMFs) with well-defined central frequencies by solving a constrained optimization problem. It can effectively separate the frequency components of noise and is particularly suitable for dealing with the non-stationary characteristics of non-linear ultrasonic signals. VMD adaptively decomposes signals by solving a variational problem, yielding K intrinsic mode functions (IMF) with center angular frequencies


In equations (1) and (2),
In the variational structure, the Hilbert transform is utilized to calculate the phase information of each signal:

The obtained analytic signal is combined with the pre-estimated center frequencies to offset the spectrum of each mode towards the estimated center frequency:

The bandwidth of each modal signal is determined by the squared L2-norm of the signal gradient, resulting in a constrained optimization problem. The variational model is as shown in equation (5):
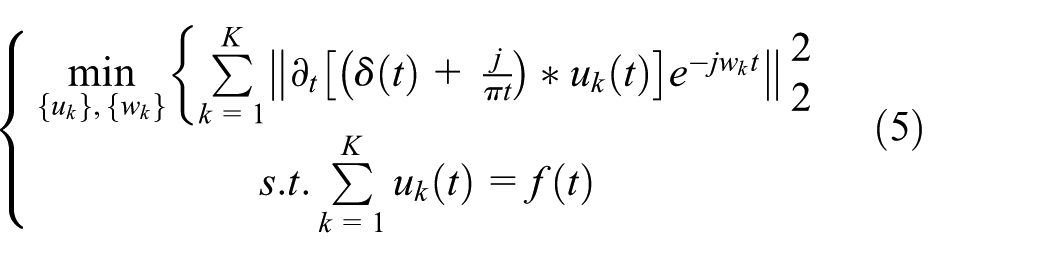
K represents the total number of modal components,
When solving the variational problem, the penalty factor

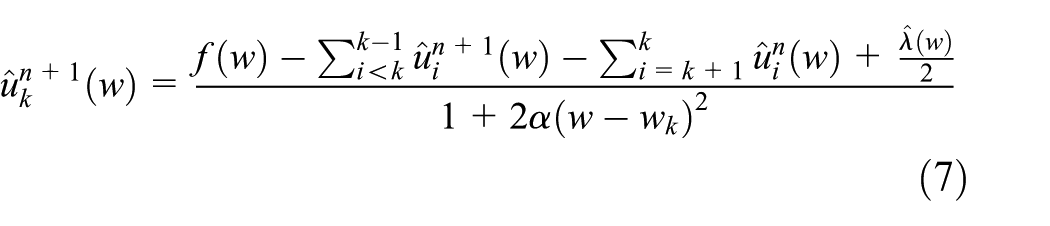
The iterative optimization of augmented Lagrange expression is carried out by using alternating direction method of multiplication operator. After initialization of


The signal is decomposed through the above steps, and signals of different frequencies are extracted for subsequent signal analysis.
Wavelet threshold
Wavelet transform analyzes the local parts of a signal by decomposing it into a superposition of a series of wavelet functions, which is more suitable for asymmetric and irregular signals. The wavelet decomposition process is shown in Figure 1. The signal is decomposed into low-frequency and high-frequency information, and a threshold is set to distinguish between the signal and noise. The main steps of wavelet threshold denoising are as follows: First, select an appropriate wavelet basis function and the number of decomposition levels, and perform wavelet transform on the noisy signal to decompose a series of wavelet coefficients. Second, process the wavelet coefficients with a threshold, removing the coefficients below the threshold to reduce noise. Finally, perform inverse wavelet transform using the processed coefficients to reconstruct the denoised signal.
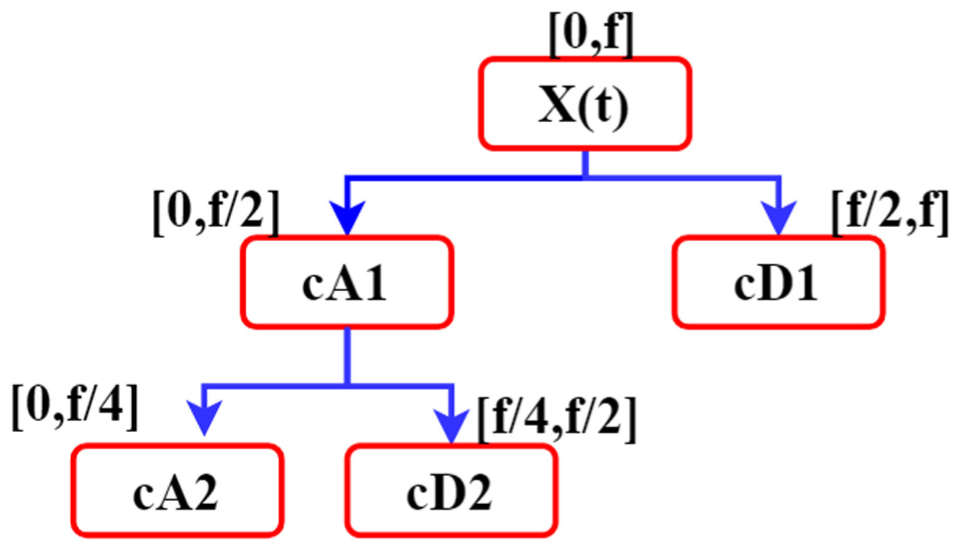
Schematic of the wavelet decomposition process.
Selection of wavelet basis function
The characteristics of the wavelet basis function directly determine the signal decomposition accuracy. It needs to match the characteristics of the ultrasonic echo signal, such as “approximate symmetry, non-stationarity, and transient mutation (e.g. the starting point of the echo).” An ideal basis function should satisfy orthogonality, completeness, and localization characteristics (time-domain/frequency-domain focusing ability), while also taking into account the ability to retain signal details. Considering the characteristics of the ultrasonic signal, the db (Daubechies), coif (Coiflets), and sym (Symlets) series of basis functions are preferentially selected. The waveforms of these three have a high degree of matching with the symmetric shape of the ultrasonic echo, and they have strong compact support (which can accurately capture the transient characteristics of the echo). In this study, further experiments are conducted for comparison to determine the optimal wavelet basis, laying the foundation for the subsequent calculation of the time-of-flight (ToF).
Threshold processing
Common threshold-estimation methods include rigrsure, sqtwolog, heursure, and minimax thresholds. After choosing a method to determine the threshold, wavelet coefficients are processed using threshold functions, mainly the hard- and soft-threshold functions. The hard-threshold function is simple, but the processed signal has poor continuity, while the soft-threshold function has good continuity at the threshold. Rigrsure threshold: By minimizing the risk-estimation function
Signal recombination
The variational mode decomposition (VMD) decomposition-reconstruction denoising method is used to reduce the noise of the signal. Selecting appropriate intrinsic mode function (IMF) components has a significant impact on the denoising effect. The method presented in this paper is to calculate the correlation coefficient and energy ratio between the original signal and the decomposed IMF components, and select the IMF components with high correlation coefficients and energy ratios for denoising reconstruction. Referring to the algorithm flow in Figure 2, the original signal is decomposed by VMD to obtain each IMF component. Then, calculate the correlation coefficient and energy ratio between each decomposed component and the original signal, so as to distinguish IMF components with high noise content from those containing both noise and effective signals. IMF components with a large amount of noise are directly removed, and those containing both noise and effective signals are further processed using wavelet-threshold denoising technology. The processed IMF components are added together for reconstruction to obtain the denoised signal. After denoising, the denoising effect is evaluated using the signal-to-noise ratio (SNR) and root-mean-square error (RMSE). The higher the SNR and the lower the RMSE, the better the denoising effect.

Flow chart of VMD combined with wavelet threshold denoising.
SNR can measure the relative intensity of the signal energy and the noise energy.
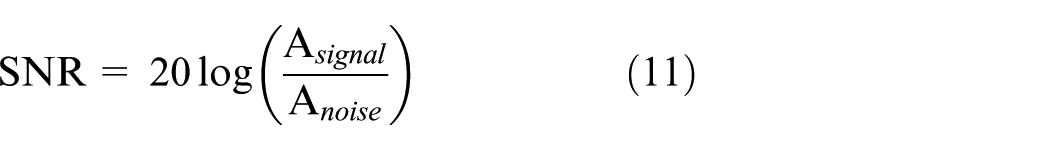
In the equation,
In ultrasonic testing, a high SNR indicates that the defect echo signal is clearly distinguishable, while a low SNR means that the signal is submerged in noise (such as material scattering noise, electronic device noise, etc.). The ultrasonic second-harmonic signal is usually two to three orders of magnitude weaker than the fundamental wave. Whether it can be accurately extracted or not, the SNR directly reflects the detection reliability of the harmonic signal.
RMSE quantifies the deviation between the denoised signal and the true signal, reflecting the degree of waveform distortion. The waveform shape of the ultrasonic signal (such as the slope of the rising edge, peak position) carries defect characteristics (such as crack depth, orientation). The smaller the RMSE, the higher the waveform fidelity during the denoising process. A low RMSE ensures accurate positioning of the echo starting point.

In the equation, yi is the ith sampling point of the original signal,
Therefore, in the evaluation of ultrasonic signal denoising, choosing SNR and RMSE as the core evaluation indicators has a solid theoretical foundation and physical significance, especially applicable to the scenarios of nonlinear ultrasonic testing.
VMD first separates the modes to reduce noise interference, and then the wavelet threshold method finely processes the remaining noise, forming a progressive logic of “coarse separation-fine purification.” This approach enables the efficient extraction of SHG signals in view of their particularities. In this part, the combined wavelet threshold method based on VMD has three important parameters that affect the quality of noise removal: the number of variational mode decomposition k, the penalty factor
Construction and experimental setting of nonlinear ultrasonic detection system
System construction
The experimental data were collected by RAM-5000-SNAP nonlinear ultrasonic device produced in the United States. A transducer with adjustable chip Angle (0°–90°) was used, the chip size was 13 × 13 mm, the waveform was a transverse wave, and the transmission frequency and reception frequency parameters of the transducer were 2.25 and 5.0 MHz, respectively. During the experiment, medical ultrasonic coupling agent was evenly coated between the transducer and the contact surface of the specimen. The oscilloscope model was KEYSIGHT InfiniiVision DSOX2022A, with a sampling frequency of up to 2 GSa/s and eight-bit resolution. When there is a defect in the material, the ultrasonic wave will interact with the material and generate ultrasonic echo. After receiving the pulse signal by the receiver end of the transducer, the signal separator will separate the fundamental signal and the second harmonic signal in the echo signal. The separated signals are transmitted to the system of the RAM-5000, and finally the acquired fundamental and second harmonic time domain signals are displayed by the oscilloscope. As shown in Figure 3.

Nonlinear ultrasonic testing system.
Experimental setup
A regular aluminum block (6061) was used as the data sampling specimen. The specimen dimensions of length, width and thickness were 25, 5, and 2.25 cm, respectively. Cracks were processed by laser cutting. The crack dimensions of length were 5 cm, width was 0.1 mm, and crack depth ranged from 0.5 to 3 mm in six different specimens. First, conduct experiments using specimens with a crack depth of 3 mm. The transmitting end of the transducer and the receiving end are placed in the middle of the aluminum block crack to ensure the shortest flight time of the ultrasonic signal from the transmitting end of the transducer through the crack to the receiving end of the transducer. When the transmitter and receiver of the transducer are too far apart, the echo signal at the defect will be embedded in the noise. The distance between the transducers is 0.4, 0.6, 0.8, and 1.0 cm, respectively, and the ultrasonic signal is collected.
Figure 4 shows the propagation path of ultrasonic signal. After the ultrasonic wave passes through the wedge and the specimen, it is reflected through the crack tip and reaches the receiving end of the transducer. 2S represents the distance between the beam positions of the two transducers, 2S“represents the distance between the front surfaces of the two wedges, and h represents the crack depth.”

The propagation path of ultrasonic signal in the specimen.
The wedge-shaped front surface used in the experiment was 4 cm away from the ultrasonic emission position of the transducer. Therefore,

The adjustment angle of the transducer is 30° (satisfying Snell’s law:
According to Figure 4, the propagation time of the ultrasonic signal reflected by the crack tip in the specimen can be expressed as:

In equation (14),

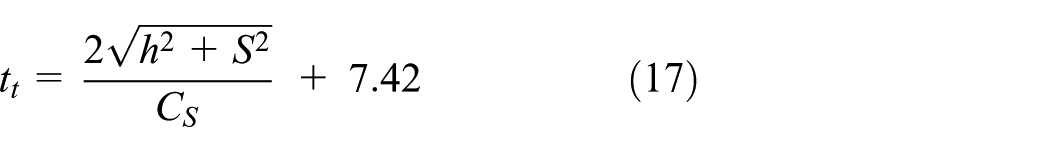
Since the ultrasonic signal generated at the transmitting end needs to pass through the transmitting end wedge, the specimen and the receiving end wedge successively, the total time from the transmitting end to the receiving end of the ultrasonic signal can be expressed as equation (16).

Where
A non-defective standard test block of Al 6061 with a known thickness of h = 22.5 mm was used. Transverse-wave metal straight transducers were symmetrically placed on both sides of the test block. Coupling agent was applied, and a 2.25 MHz transverse wave was emitted to collect the time-of-flight (ToF) of the ultrasonic signal. The measurement was repeated five times, and the average one-way propagation time was calculated. Let the measured value be
Given the sound velocity v = 4.5 mm/µs, the transmitting and receiving wedge-shaped transducers were placed on both sides of the test block, respectively, to collect the total tt. According to the equation
In literature, wavelet changes are used to determine the peak value of ultrasonic signals in the wavelet time scale, which in turn represents the arrival time of defect signals.28–33 In this experiment, contaminated echo points are extracted from ultrasonic signals. The echo signal is decomposed by variational mode decomposition method, and the decomposed component is denoised by wavelet threshold, and then the denoised component is added and reconstructed to determine the echo point.
Implementation and verification of noise reduction methods for ultrasonic echo signals
Select VMD combined wavelet threshold noise reduction parameters
The VMD algorithm in this paper is based on the open-source implementation of Dragomiretskiy and Zosso, and the Wavelet threshold uses MATLAB Wavelet Toolbox. Using a 3 mm cracked aluminum plate as an example, the noise reduction process employs VMD and wavelet thresholding, with the mode parameter K determined via center frequency analysis. The waveform diagram of the second harmonic signal containing noise in time domain and frequency domain is shown in Figure 5.

Second harmonic signal. (a) Time domain signals; (b) signals in the frequency domain.
According to the data information in Table 1, in the process of implementing VMD decomposition for second harmonics, when the number of modes is set to 6, the analysis finds that the two components with center frequencies of 4.518 and 4.604 MHz, respectively, have relatively small frequency intervals between them, and the situation that the frequencies are similar is highly likely to cause alialiation.
Center frequencies for different K values of second harmonics.

To ensure the scientific nature and reproducibility of parameter selection, we conducted a complete grid-search experiment with K ranging from 3 to 6 and α taking values of 500, 1000, 1500, 2000, 2500, and 3000. The objective was to “maximize the signal-to-noise ratio of the second-harmonic,” while imposing constraints on waveform distortion (RMSE ≤0.012) and the overlap of IMF bandwidths (OI ≥0.2). Six sets of valid parameters from the experiment were selected, as shown in the Table 2. In view of this, the mode number K is selected as five to ensure the reliability and stability of the decomposition effect when the second harmonic is decomposed into VMD. Figure 6 illustrates the central frequency distribution of each IMF component.
Screening of effective candidate parameters.

Center frequency plots of each IMF component of the second harmonic for different values of K. (a) Plot of center frequency of each component when K = 5. (b) Plot of center frequency of each component when K = 6.
We calculated the (estimated) bandwidths of IMF2 and IMF3 when K = 6. The difference in their center frequencies is only Δf = |4.604–4.518| = 0.086 MHz. Our calculation shows that Δf is much smaller than the sum of the bandwidths of these two modes (e.g. the bandwidth of IMF2 is ∼0.12 MHz, the bandwidth of IMF3 is ∼0.11 MHz, and the total is 0.23 MHz). According to the principle of VMD, when the difference in the center frequencies of modes is less than their bandwidths, the algorithm has difficulty stably separating them, resulting in mode splitting and unstable decomposition results. In contrast, under K = 5, the center-frequency intervals of each IMF are much larger than their own bandwidths, and the mode separation is good. This quantitatively confirms the rationality of choosing K = 5 to avoid mode splitting.
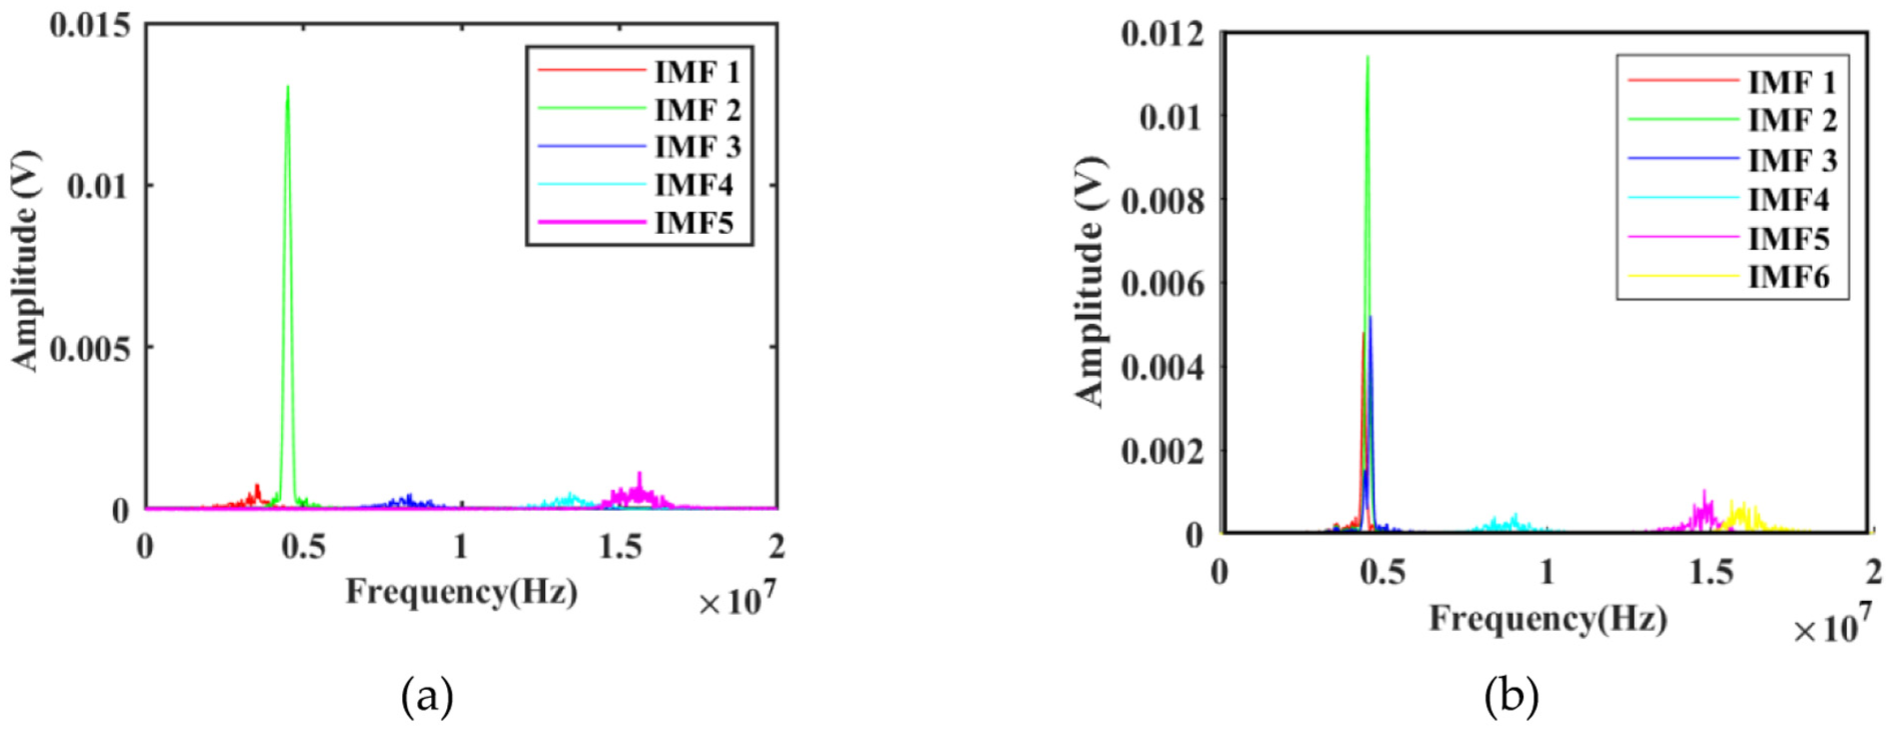
The penalty parameter alpha = 2000 was preliminarily selected to ensure that the main information was retained and the denoising effect was achieved. 20 K = 5 decomposed the second harmonics, and the time domain and frequency domain diagrams of each component were obtained after decomposition, as shown in Figure 7.

Time-frequency domain diagram of each component when α = 2000 and K = 5 second harmonics are used for VMD decomposition. (a) Time domain of each component after VMD decomposition. (b) The frequency domain of each component after VMD decomposition.
When the second harmonic is decomposed, it is found that, as shown in Figure 8, the IMF2 component is highly correlated with the original signal, with a correlation coefficient of 0.9775, while the IMF component of the third layer is only 0.0869. It is speculated that the difference of correlation is obvious because the unavoidable noise is mixed in the second harmonic signal collection. For each IMF after VMD decomposition with K = 5 (Figure 6(a)), its power spectrum is calculated through the fast Fourier transform (FFT). Then, the energy

Correlation coefficients of IMF components.
Analysis of IMF components.

IMF: intrinsic mode function.
In order to optimize the quality of defect echo signal, multiple wavelet threshold denoising operations are implemented. Considering that the hard threshold processing is easy to cause the signal oscillation problem, and the compromise processing is similar to the soft threshold function, the soft threshold function is finally selected after weighing. Finally, db5, coif2, and sym7 wavelet bases were used for denoising.
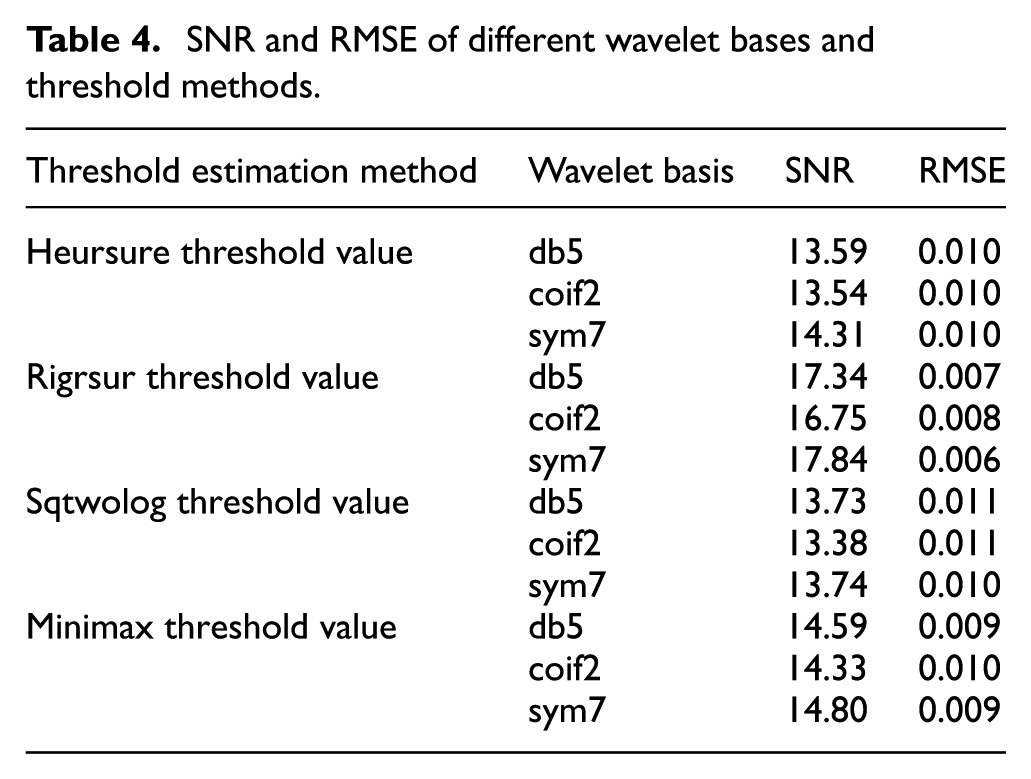
The denoising results of different threshold-estimation methods and wavelet bases are detailed in Table 4. The time-frequency diagram after noise reduction and reconstruction is shown in Figure 9. The signal noise in time domain and frequency domain is obviously lower, and the starting point of the echo signal can be determined by the time-domain signal amplification diagram.
SNR and RMSE of different wavelet bases and threshold methods.

Time-frequency diagram after noise reduction and reconstruction. (a) Time domain signal after noise reduction. (b) Frequency domain signal after noise reduction. (c) Starting point of defect echo.
Through the analysis of the data in the table, it can be seen that different threshold estimation methods have significant effects on the denoising results. In contrast, the three wavelet bases show relatively little difference in denoising effect. After comprehensive evaluation, the soft threshold denoising method combined with rigrsure threshold and sym7 wavelet basis is better, which achieves the highest signal-to-noise ratio and the lowest root-mean-square error, and has the best performance in denoising effect. Meanwhile, when ultrasonic waves encounter defects such as cracks, the reflected waves will form approximately symmetrical waveforms, as shown in Figure 9(a). Sym7 belongs to the Symlets wavelet family and has approximate symmetry (semi-orthogonality), and its waveform is closer to a symmetrical form in the time domain. This symmetry enables Sym7 to capture the symmetrical features of the echo more accurately when decomposing the ultrasonic signal, reduce phase distortion, and thereby improve the accuracy of identifying the echo starting point (such as in flight time measurement). Based on the above analysis results, this paper finally decides to adopt the method of one-layer decomposition, and uses the soft threshold method combining rigrsure threshold and sym7 wavelet base to de-noise the signal, in order to obtain the ideal de-noising effect.
Comparative analysis with other noise reduction methods
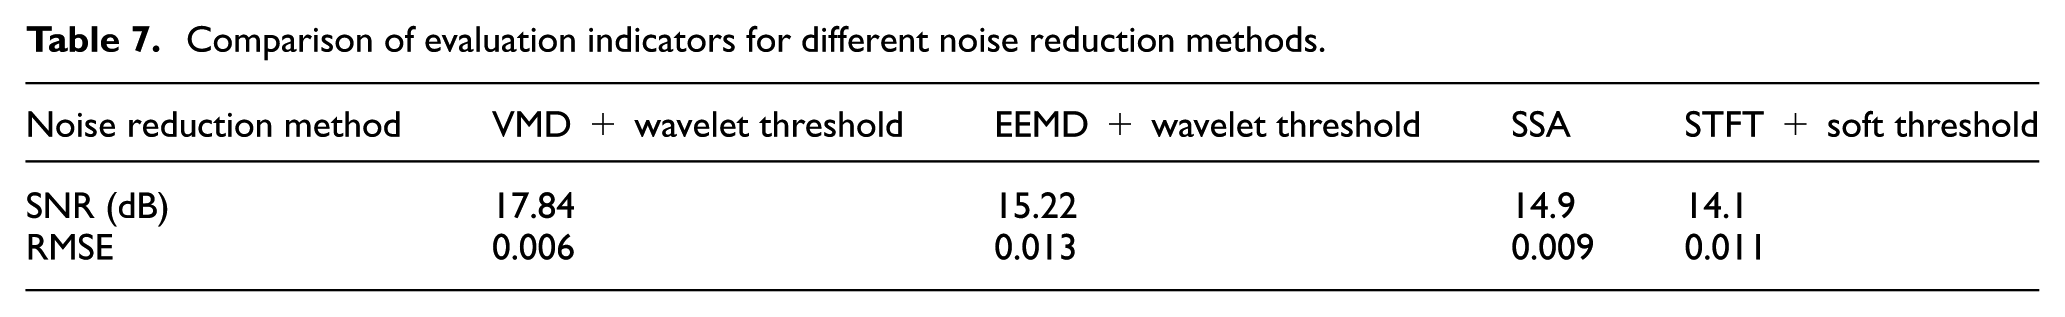
To verify the rationality and advantages of the VMD combined with wavelet threshold method proposed in this paper, this section selects three commonly used methods in ultrasonic testing: ensemble empirical mode decomposition (EEMD), singular spectrum analysis (SSA), and short-time Fourier transform (STFT), and conducts a comparison from the aspects of principle adaptability and experimental performance,34–37 as shown in the Table 5.
Introduction to the core principles of the four methods.

Taking the echo signal of the 3 mm aluminum plate with a crack depth in the above text as an example, the four noise reduction methods, VMD, EEMD, SSA, and STFT, are compared. The key parameter Settings in ultrasonic signal processing are as follows: When the VMD setting encounters the above situation, the number of modes K = 5 and the penalty factor α = 2000. The signal is adaptively decomposed through the variational model. For each mode component after decomposition, the sym7 wavelet basis is adopted, combined with the hierarchical noise reduction of the wavelet threshold. The EEMD sets the collection times to 100 times and the noise intensity to 0.2 times the signal standard deviation, and suppresses mode splitting by adding white noise multiple times. The embedding dimension of SSA is taken as 1/3 of the signal length N, and the principal components are extracted through matrix singular value decomposition. STFT adopts a 256-point Hanning window and a 50% overlap rate to segment the echo signal into short-time segments for Fourier transform, and combines a soft threshold to achieve noise reduction. For quantitative comparison, SNR and RMSE are adopted as evaluation indicators.
Ultrasonic echo signals (especially the second harmonic) have the characteristics of strong nonlinearity, non-stationarity, and multi-component time-frequency overlap (e.g. the fundamental wave and the second harmonic overlap in the time domain but the frequency bands are separated). It can be known from this that VMD adaptively divides the bandwidth of the IMF through the variational model and can accurately separate the harmonic components of different frequency bands. However, due to the principle limitations of EEMD/SSA/STFT (such as the empirical nature of EMD, the stationary assumption of SSA, and the fixed window of STFT), as well as the comparison of the final results of SNR and RMSE, it can be known that in ultrasonic signal denoising, VMD combined with wavelet threshold denoising is superior to the other three methods.
Echo signal processing and analysis
Using the nonlinear ultrasonic device described in Section 3, the echo signal is acquired to the distance between the two transducers takes different values. The proposed method is used to reduce the noise of the echo signal. Then the echo starting point of the crack tip is identified to better evaluate the crack depth.
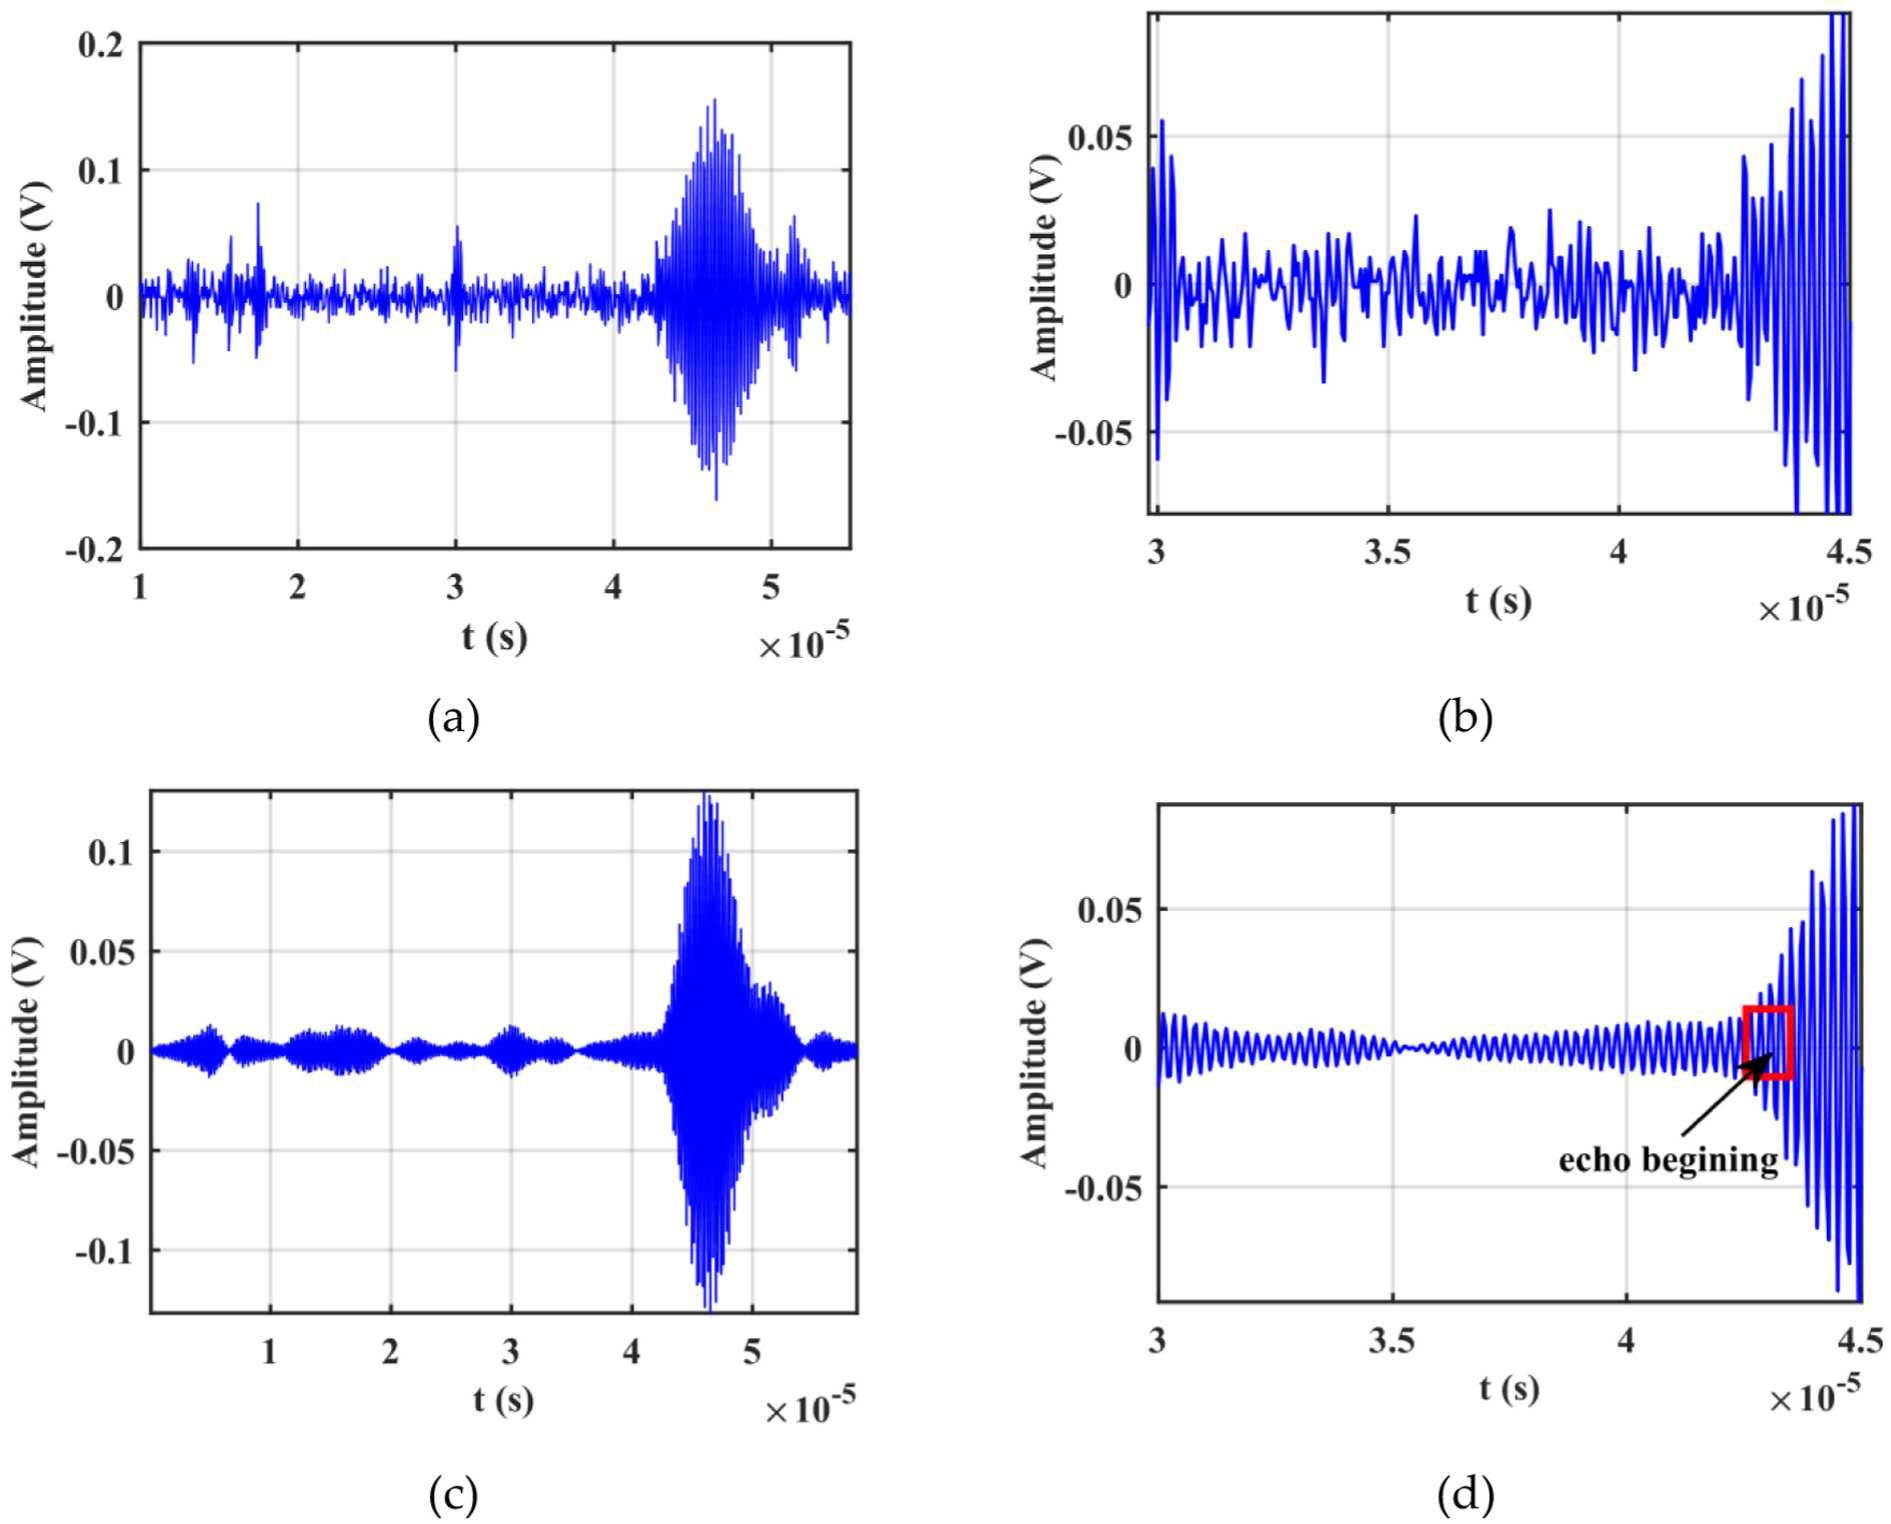
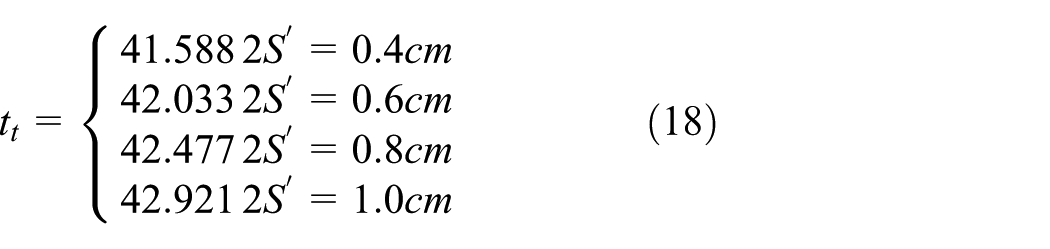
Figure 10 shows the signal acquired at 2S′ = 0.4 cm and the signal after noise reduction. It can be concluded from Figure10(a) and (b) that there is a large amount of noise in the signal. After the signal is denoised by the method proposed above, the denoised signal and its change rate are obtained, as shown in Figure 10(c) and (d). The noise is significantly reduced and the starting point of the echo signal of the crack tip is more easily identified. The starting point corresponds to the time point 41.588μs, which is the total flight time (the delay time included in the wedge) from the transmitting end to the crack tip to the receiving end.
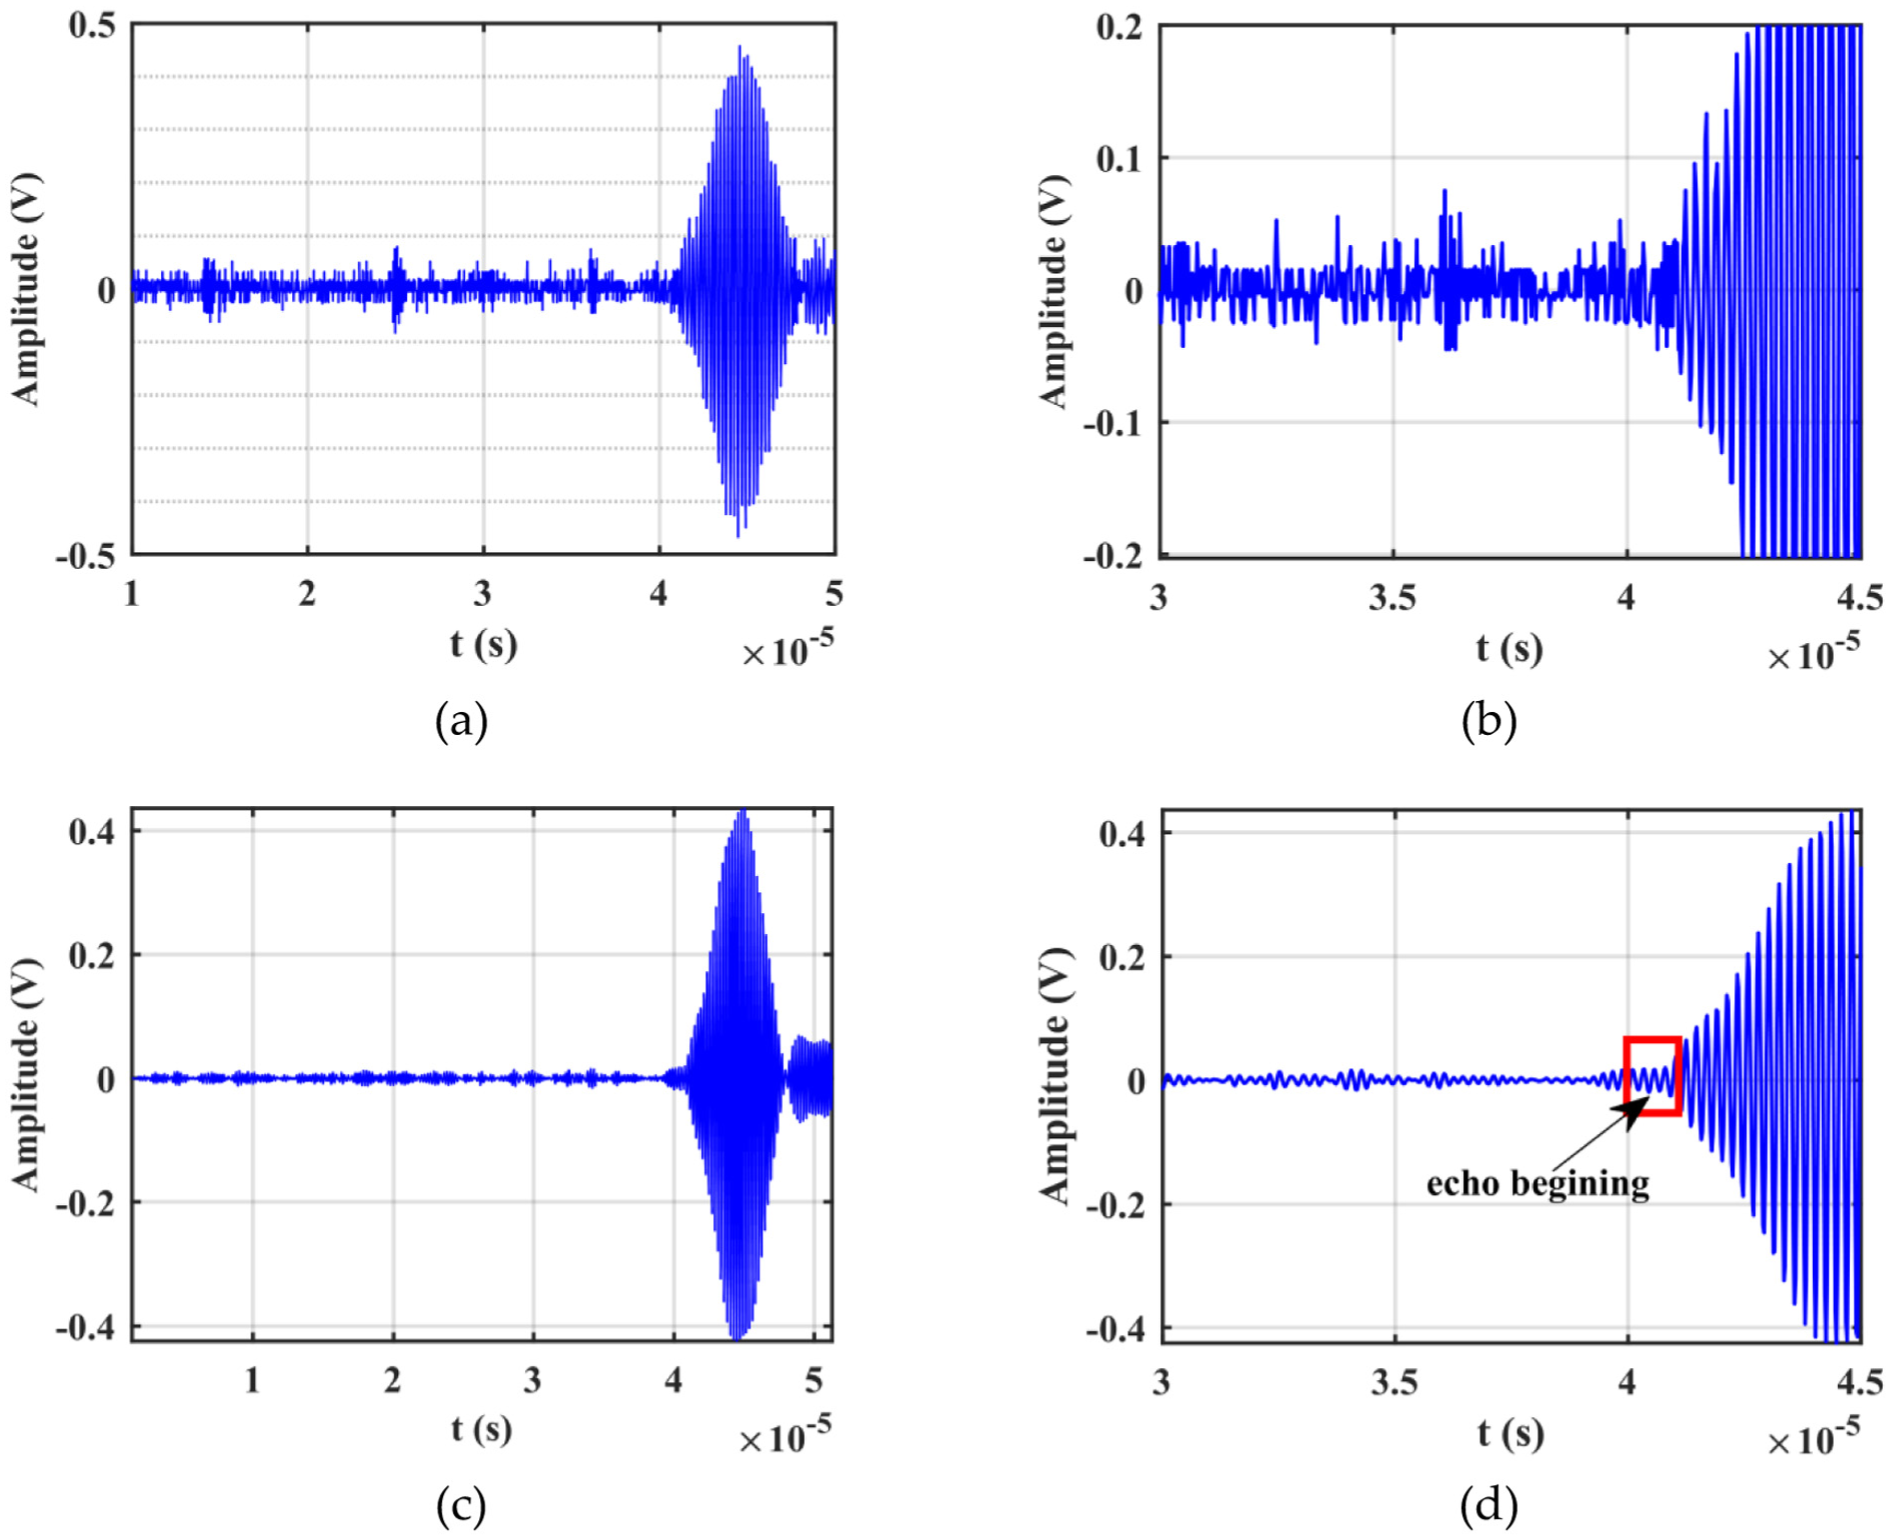
Time-frequency signal diagram when the distance between sensors is 0.4 cm. (a) Raw signal, (b) local zoom image, (c) signal after noise reduction, (d) zoom map after noise reduction.
Figure 11 shows the signal collected at 2S′ = 0.6 cm and the signal after noise reduction. Figure 11 shows the signal after noise reduction. As can be seen from the original signal such as Figure 11(a) and the local zoom signal in Figure 11(b), there is a lot of noise in the signal. Compared with Figure 10, when the distance between the transducers is larger, the amplitude of the signal reflected back from the crack tip decreases, and the signal-to-noise ratio is lower than that in Figure 10. The signal and local zoom diagram after noise reduction are shown in Figure 11(c) and (d), and the noise is significantly reduced. The echo start time is 42.033μs.

Time-frequency signal diagram when the distance between sensors is 0.6 cm. (a) Raw signal, (b) local zoom image, (c) signal after noise reduction, (d) zoom map after noise reduction.
Figure 12 shows the ultrasonic signal acquisition and noise reduction results when 2S′.= 0.8 cm is displayed. The raw signal and local zoom are shown in Figure 12(a) and (b). Due to the increasing distance between the transducer, compared with the Figures 11 and 12, the echo signal amplitude of the crack tip is lower. The proposed method is used to reduce the noise in the collected ultrasonic signal. The signal after noise removal and local amplification are shown in Figure 12(c) and (d). The noise is obviously reduced, and the start time of echo signal is 42.477μs.
Time-frequency signal diagram when the distance between sensors is 0.8 cm. (a) Raw signal, (b) local zoom image, (c) signal after noise reduction, (d) zoom map after noise reduction.
Figure 13 shows the ultrasonic signal acquisition and noise reduction results when 2S′= 1 cm is displayed. The original signal and partial amplification are shown in Figure 13(a) and (b). As the distance between the transducers is further increased, the amplitude of the echo signal at the crack tip is lower than that in Figures 11 to 13. The method proposed above is used to reduce the noise in the signal. The signal after noise removal and local amplification are shown in Figures 13(c) and (d). The noise is obviously reduced, and the start time of echo signal is 42.921μs.

Time-frequency signal diagram when the distance between sensors is 1 cm. (a) Raw signal, (b) local zoom image, (c) signal after noise reduction, (d) zoom map after noise reduction.
Crack depth is determined using the echo point time in this experiment. In order to prove the accuracy of the proposed method in obtaining the starting point of the echo at the crack tip, the results of the denoised signal are compared with those of the theoretical calculation. According to equation (15), the theoretical flight time of ultrasonic signal can be obtained, that is, the time required to pass through the wedge block and sample from the transmitting end to the crack tip and then to the receiving end.
The experimental and theoretical values of the arrival time of the second harmonic signal after processing are given in Table 6. The experimental value is obtained by averaging the estimated arrival time of three repeated data samples. As can be seen from Table 7, the relative error between the time of flight obtained from the analysis of experimental data and the time of flight obtained from the theoretical calculation is within 1%, indicating that the proposed method is effective in removing noise in the echo and identifying the starting point of the reflected ultrasonic echo, and the flight time of the echo signal can be obtained from the collected ultrasonic data. consequently, the crack depth can be accurately obtained by the distance between the transmitter and receiver transducers and the propagation speed of the ultrasonic wave in the specimen.
Experimental and theoretical results show the total flight time of the ultrasonic signal.

Comparison of evaluation indicators for different noise reduction methods.
Measurement performance evaluation
In the experiment, the crack is set in the middle of two transducers for test analysis, and when the crack defect location is unknown, the transducer may not be placed symmetrically around the crack. Therefore, an experiment in which the transducer is placed asymmetrically around the crack is designed to verify the detection effect.
In this test, the distance between the two transducers is always 2S, and the two transducers are placed at the distance

Average relative error (%) for estimating total flight time at different transducer positions.

Among them,
The average relative error is shown in Table 9, from which it can be seen that the maximum average error is 6.2%. Therefore, the proposed method can be used to accurately estimate the arrival time of the echo signal even if the two transducers are placed unsymmetrically around the crack.
Maximum error and average error of estimated arrival time of different crack depths.

In order to investigate the effect of crack size on the accuracy of echo signal arrival time, ultrasonic signals of six specimens with crack depth ranging from 0.5 to 3 mm were collected. The transmitting and receiving probes were fixed on the surface of the specimen. For repeated signal acquisition without moving the probes, a pre-load of 50 N was applied through a spring bracket to ensure that the probes and the thickness of the coupling agent (<0.1 mm) were completely fixed. Keeping the experimental environment (temperature of 25 °C and no electromagnetic interference) unchanged, ultrasonic signals were collected continuously for five times with an interval of 10 s each time. The signals collected were denoised using the proposed method, and their arrival times were calculated. The time obtained by data analysis is compared with the arrival time obtained by equation (17). The relative error obtained is shown in Table 9, and the maximum error is 6.4%. The mean error decreased from 3.3% for the 0.5 mm crack specimen to 1.3% for the 3 mm crack specimen, as shown in Table 8. The above results show that the proposed method can detect small cracks.
Conclusion
Method innovation: A combined processing strategy of “VMD mode screening + wavelet threshold optimization” for nonlinear ultrasonic second-harmonic was proposed. Adaptive mode screening was achieved through correlation analysis, and optimal parameters were determined through experiments on multiple threshold-wavelet basis combinations. This addressed the problem of insufficient extraction accuracy of the second-harmonic by traditional methods under low signal-to-noise ratios.
Application value: In the crack detection of laser-wire-cut aluminum plates, the adaptability of this method to cracks of different depths (from 0.5 to 6 mm), different sensor spacings (from 0.4 to 1.0 cm), and asymmetric placement scenarios was verified. It provides a practical solution for the nonlinear ultrasonic detection of unknown crack characteristics in engineering.
Technical breakthrough: The advantages of this method in terms of improving the signal-to-noise ratio of the second-harmonic signal and the identification accuracy of the echo starting point (relative error <1%) were quantitatively verified for the first time. It provides a reliable signal-processing tool for the nonlinear ultrasonic evaluation of micro-defects.
Footnotes
Handling Editor: Ka-Veng Yuen
Funding
The authors disclosed receipt of the following financial support for the research, authorship, and/or publication of this article: National Natural Science Foundation of China (grant 51775390), Science and Technology Project of Jiangxi Provincial Department of Education (grant GJJ2202902).
Declaration of conflicting interests
The authors declared no potential conflicts of interest with respect to the research, authorship, and/or publication of this article.