
Abstract
To address the compromised connection independence and structural integrity in module division due to multi-criterion correlation, ambiguous and missing information in complex products, a similarity model based on optimal path weighted resource allocation (oWRA) and closeness centrality (oWRA-CC) was proposed in this article. This model extended the reliable path weighted resource allocation (rWRA) to oWRA by considering the weights of high-order paths and the importance of source and target nodes, and the explicit and implicit relationships between parts were comprehensively quantified by introducing adjustment parameters combined with closeness centrality. The oWRA-CC similarity model was applied to the spectral clustering algorithm to obtain the optimal partition scheme. Finally, taking the tunnel boring machine segment erector as an application object, the traditional spectral clustering algorithm (SC) and the similarity model based on equivalent capacitance method (EC) and the oWRA-CC similarity model in module division were compared. The results show that the modularity of the oWRA-CC similarity model is 9.92% and 7.67% higher than that of the traditional SC algorithm and the EC similarity model, respectively, and the closeness (C i ) value is the highest, indicating that the network community structure divided by his model is more refined and the node correlation is stronger within the module.
Introduction
Complex products are composed of multiple components or systems, and the connections between these components jointly form a complex network structure.1,2 Utilizing the network analysis to identify boundaries for module division can enhance design efficiency, shorten development cycles, and facilitate rapid responds to market demands-thereby enabling the customization of products that meet individual customer needs. Traditional module division methods, such as hierarchical clustering, 3 K-means, 4 and spectral clustering algorithms, 5 mainly relied on explicit relationships between parts. The explicit relationships were constructed based on human experience or automation technology, which suffer from information fuzziness and loss, resulting in low intra-module cohesion and high inter-module coupling in the module division of complex products.6,7 Perfecting component relationships by mining implicit relationships and capturing the potential relationship between components can improve the accuracy of module division. Therefore, mining and utilizing implicit relationships is crucial for optimizing the module division of complex products.
Currently, the method mining of implicit relationships based on node similarity has attracted much attention due to its wide application in network analysis. It is mainly categorized into local information-based methods and path-based methods. CN index 8 was proposed by considering the common neighbor of the node pair. Salton 9 proposed the Salton index by punishing the degree of nodes at both ends on this basis. Further, Adamic and Adar 10 proposed AA index, and Ou et al. 11 proposed Resource Allocation (RA) index, both of which consider the influence of common neighbor node degree. However, these methods based on local information only use the description of a single node information, which is not enough to comprehensively reflect the similarity between nodes. For example, Liu et al. 12 considered the contribution of neighbor nodes on the basis of local similarity to improve the accuracy of mining unexplored structural information in the network. Liu et al. 13 proposed a link prediction algorithm, which quantifies node initial information using nodes’ the topology information and adjustable parameters, based on the contribution of node initial information, to solve the problem that traditional ignore the size of node initial information. Wang et al. 14 considered the local and global structure of the network fully by combing the node degree and link clustering coefficient to mine the implicit relationship in complex networks. Zhao et al. 15 proposed the “reliable path method,” which extended the local similarity index of unweighted networks to weighted networks. Wu et al. 16 used the important ranking of common neighbors as the contribution of common neighbors to solve the problem of ignoring the influence of real nodes in implicit relationships mining. Ahmad et al. 17 comprehensively evaluated the similarity between nodes by combining common neighbors and centrality. Although these methods improve the accuracy of implicit relationship mining, they are mainly aimed at common neighbors and tend to ignore high-order path information between nodes. Therefore, Zhou et al. 18 proposed the Local Path (LP) index by considering the factors of the second-order path and the third-order path. Katz 19 proposed the Katz index based on global topological information by considering the number of all paths between nodes and giving a larger weight to shorter paths. Li et al. 20 proposed a new similarity index by considering the contribution of the path and integrating the contribution of the end node itself to distinguish the contribution of different paths. Zhou et al. 21 found that, by incorporating third-order paths on the basis of second-order paths, the third-order path algorithm achieves higher mining accuracy than the second-order path algorithm in certain specific networks. Kumar et al. 22 proposed a similarity calculation method based on the clustering coefficient of secondary nodes to enhance the accuracy of implicit relationship mining. Xia et al. 23 proposed a similarity index based on Dempster–Shafer theory and the exponential importance of higher-order paths to improve the accuracy of implicit relationship mining by penalizing neighboring nodes and considering information of the whole network and each node. Chen et al. 24 introduced a network similarity comparison method based on high-order structure by constructing distributions of higher-order clustering coefficients and node distances, then using Jensen–Shannon divergence to measure similarity more accurately between networks. Agostinelli et al. 25 proposed two novel dissimilarity measures—Hyper NetSimile and Hyperedge–Portrait Divergence—designed for hypergraph comparison, effectively capturing multi-node interactions and outperforming pairwise-based metrics.
Although previous methods have significantly improved the accuracy of implicit relationship mining, most studies on high-order paths failed to account for the influence of edge weights on node relationships, leading to imprecise path selection. In addition, these methods primarily emphasized the importance of intermediate nodes along the path, while overlooking the significance of the source and target nodes. To address these limitations, this article proposes a similarity model based on oWRA and closeness centrality (oWRA-CC). Built upon the traditional long-path Weighted Resource Allocation (lWRA) approach, the proposed model incorporates the influence of high-order path weights as well as the importance of both the source and target nodes. By introducing an adjustment parameter and integrating closeness centrality, the model comprehensively quantifies both explicit and implicit relationships among components. This method not only enhances the rationality of path selection but also enables more accurate identification of node information characteristics within complex networks through improved similarity measurement.
The main contributions of this work are as follows:
A comprehensive Design Structure Matrix (DSM) is constructed by integrating connection relationships, assembly strength, and contact correlations, which is then transformed into a complex network model.
A novel oWRA-CC similarity model is proposed, which incorporates high-order path weights and the importance of both source and target nodes, thereby improving the accuracy of similarity measurement.
The proposed similarity model is combined with spectral clustering to achieve an optimal module partitioning scheme.
A quantitative evaluation method is developed based on intra-module cohesion, inter-module coupling, and cohesion dispersion, enabling rigorous assessment of clustering results.
Node similarity model and module division model
The oWRA-CC similarity model
The length of the path (i.e., the number of intermediate nodes passed through) could be used to measure the strength of implicit relationships. Generally, shorter paths mean stronger associations, while longer paths may suggest weaker connections. The “Six Degrees of Separation Theory” 26 was applied to comprehensively consider the similarity influencing factors in the range of six-order and below-six-order paths when calculating the optimal number of paths in this article.
It is very important to determine the most reliable path from the source node to the target node in the reliable path problem. The experimental results
15
showed that the reliable path weighted resource allocation index (rWRA:
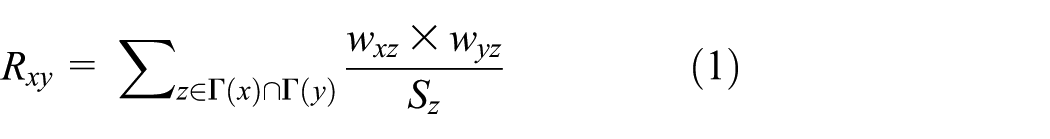
Where w xz is the weight between node x and node z, w yz is the weight between node y and node z, s z is the strength of neighboring node z, which is the sum of the connection weights to its neighboring nodes.
The long path weighted RA (lWRA:
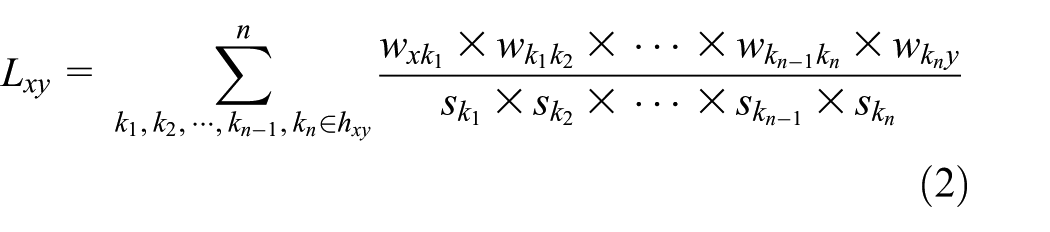
Where h
xy
is the path between node x and node y, k1, k2, k3, …, k
n
are the nodes that the path passes through,
However, the rWRA index considers only the common neighbors between the source and target nodes, making it insufficient to capture the broader topological information of the network. The lWRA index, on the other hand, focuses solely on the importance of intermediate nodes along a single optimal path, while neglecting the roles of the source and target nodes themselves. To address these limitations, this article proposes the oWRA method. It enhances the representational capability of path weights by summing the weight products of all optimal paths between the source and target nodes and incorporating the importance of both intermediate and endpoint nodes. Furthermore, to mitigate the dominant influence of high-strength nodes, the model introduces the product of the strengths of all nodes along the path—including the source and target nodes—to improve the distinctiveness of the result. The algebraic formulation of the similarity between nodes x and y (oWRA: O xy ) is as follows:

Where S x denotes the strength of the source node x, and S y denotes the strength of the target node y.
Node centrality reflects the topological importance of nodes within a network. In undirected graphs, node centrality is primarily measured by two dimensions: closeness centrality and betweenness centrality. Closeness centrality represents the average shortest path distance between nodes, while betweenness centrality measures a node’s role as an intermediary in information transmission. A node has high betweenness centrality if many shortest paths between other nodes pass through it. In this study, closeness centrality is selected as a parameter for mining implicit relationships. For a network with N nodes, the closeness centrality between nodes x and y, denoted as CC(x, y) 17 :

Where N is the number of nodes in the network, and l xy is the minimum value of the optimal path between node x and node y. If the edge weight is a similarity weight, then l xy = 1/w xy ; if the edge weight is a dissimilarity weight, then l xy = w xy .
The node similarity was initially calculated based on the explicit relationships to effectively integrate the explicit and implicit relationships between components. Then, the similarity between node pairs was comprehensively evaluated by introducing an adjustment parameter and combining the closeness centrality of nodes. The similarity calculation formula (

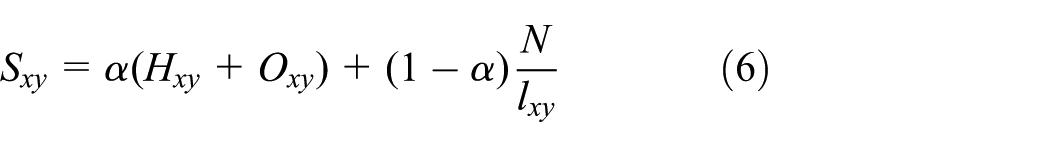
Where α is the adjustment parameter, which is used to adjust the weight of the optimal path number and the centrality, and the value range is (0,1).
Evaluation index of similarity model
In order to evaluate the accuracy of the implicit relationships mining, the known edge set E was randomly divided into a training set E
T
and a test set E
P
, where ET ∪ EP = E and ET
The Area Under the Curve (AUC) index was used to measure the probability that the similarity score of the edges in the test set is higher than the similarity score of the edges in the non-existent edge set U-E. The specific calculation method was as follows: in n independent comparisons, it is recorded as the similarity score of the edges in the test set is greater than the similarity score of the non-existent edges; it is recorded as 0.5 if they were equal. The calculation formula is as follows27,28:

Where
Module division model
Spectral clustering identifies node similarities by analyzing the feature vectors of the Laplacian matrix of the network, thereby enabling community partitioning and efficiently handling large-scale networks.29,30 The oWRA-CC similarity model was applied to spectral clustering algorithms in this article to achieve more efficient community detection and better division results in complex product module division. The accuracy of similarity measurement is enhanced by mining the implicit relationship between nodes, thereby optimizing the precision of community division. The algorithm is shown on Figure 1.

The module division algorithm flow of the oWRA-CC similarity model.
The specific steps are as follows:
(1) The comprehensive DSM of the parts is constructed and mapped into a complex network.
(2) The Depth-First Search (DFS) algorithm is used to search for all optimal paths from the source node to the target node.
(3) The similarity O xy of the implicit relationship and H xy of the explicit relationship between nodes are calculated according to equations (3) and (5) respectively.
(4) The closeness centrality CC(x, y) of the nodes is calculated based on the minimum value of the optimal path l xy for each node pair according to equation (4).
(5) The similarity S xy between nodes is calculated according to equation (6) by determining the optimal α value through the AUC index.
(6) The spectral clustering algorithm is used for module division of the network after removing the edge with the smallest similarity (if multiple edges had the same similarity, then randomly selected one to remove).
(7) The modularity of the original complex network is calculated under the current partition.
(8) All edges are removed sequentially to obtain the community structure of the complex network by repeating Steps (6) and (7). The module division concluded when the constraint was satisfied if there was a specific modularity constraint.
Evaluation index for module division scheme
The traditional methods typically employed modularity as an evaluation index to evaluate the quality of community detection schemes, where larger modularity values indicate more reasonable module division schemes. 31 In order to ensure the connection independence and structural integrity of the modules and achieve the division principle of “strong cohesion within modules and weak coupling between modules,” a quantitative evaluation method based on the average cohesion within modules, the average coupling between modules, and the dispersion of module cohesion was established to realize the comprehensive evaluation of the division scheme. 32
Modularity:
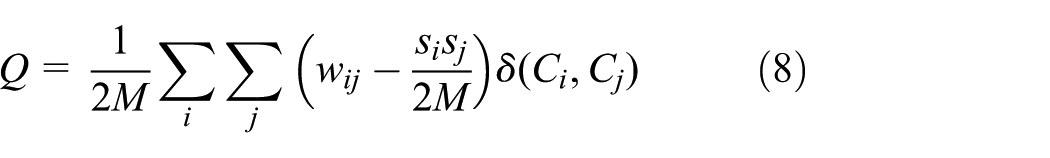
Where M is the sum of the edge weights in the complex network, s i and s j are the strengths of nodes i and j, which are the sums of the weights of all the edges connected. C i and C j are the communities to which are the nodes i and j belong. The function δ(C i , C j ) = 1 if nodes i and j are in the same community; the function δ(C i , C j ) = 0 if they are in different communities.
Average cohesion within modules:

Where n1, n2, …, n
n
are the number of parts in each sub-module,
Average coupling between modules:

Where r(M x , M y ) is the total correlation between any two sub-modules.
Dispersion of module cohesion:

The quality of the partition results was quantitatively evaluated after calculating the values of D1, D2, and S. Specifically, the larger D1, the smaller D2, and the smaller S indicate higher cohesion within the module, lower coupling between the modules, and the smaller dispersion in the correlation among parts-thus indicating a higher the quality of the division scheme. The Technique for Order Preference by Similarity to Ideal Solution (TOPSIS) multi-attribute decision-making method was used to calculate the distance between each alternative solution and the positive ideal solution and negative ideal solutions to select the best solution in view of the fact that these three evaluation indexes are not all maximization indexes. 33
(1) A positive matrix

(2) A standardized matrix

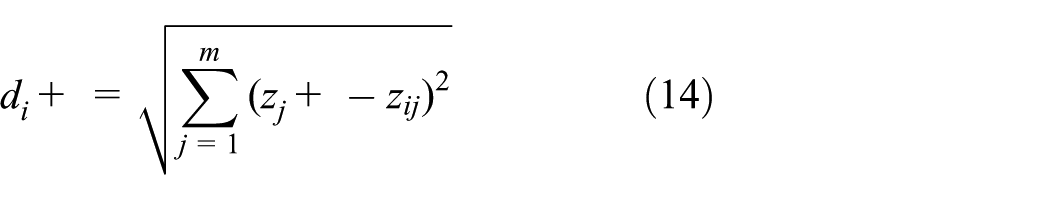
(3) The maximum value z+ and the minimum value z− were selected for each index in the division scheme, and the distance between each division scheme and the maximum value and the minimum value was calculated. 34

(4) The relative closeness C i of each evaluation index was calculated for each division scheme to the optimal value. The larger the value of C i , the closer the evaluation object was to the optimal value, meaning that the scheme is better.

Constructing component association relationships based on structural correlations
Construction criteria
The module division of complex products was based on determining the relationship between parts. Since determining these relationships involves multiple criteria and relies on knowledge and experience, it was necessary to analyze the relationships under each criterion separately subsequently, the module division model was constructed based on comprehensive relationships. The design of correlation weights was based on commonly used disassembly difficulty evaluation principles from the Mechanical Design and Assembly Handbook, and drew upon existing studies that assign weights to connection and assembly types (e.g., welding, bolting, and meshing) according to actual engineering experience and the typical disassembly difficulty of structural forms. These weights reflect the ease of disassembly and the degree of structural coupling for different connection types in real-world products. 35 In addition, expert experience was incorporated to validate the subjective assessments of connection types and assembly strength, ensuring that the weight assignments are both engineering-reasonable and interpretable.
(1) The correlation between connections among parts was weighted based on the difficulty of disassembly. For example, they were assigned a higher weight due to the difficulty of disassembly if two parts were connected by welding. The specific definition is shown in Table 1.
(2) The assembly strength and contact correlation between parts were weighted based on the degree of assembly tightness, stiffness characteristics and contact mode. For example, they were assigned a large weight if the two parts with tight assembly, high stiffness and multi-surface contact. The specific definition is shown in Table 2.
Evaluation criteria for relevance of part connections.

Evaluation criteria for assembly strength and contact relevance of parts.

Construction of the comprehensive design structure matrix
There were many connections between product parts when constructing the DSM. The relevant DSM of different design attributes were constructed to accurately describe these relationships, and the comprehensive DSM was obtained through weight analysis. Specifically, the comprehensive DSM was constructed from two aspects: structural connectivity, assembly strength and contact relevance in this article.

Where PDSM is the comprehensive DSM among product parts, PDSM1 is the DSM related to structural connections, PDSM2 is the DSM related to assembly strength and contact, w1 and w2 are the corresponding weight values. According to the factor analysis method, w1 = 0.52 and w2 = 0.48.
Module division of the tunnel boring machine segment erector
Dataset construction
As the key piece of equipment in the tunnel boring engineering, the design complexity of the segment erector was not only reflected in the connections and structures of individual parts, but also in the difficulty of capturing the implicit relationships among various parts directly through the traditional assembly relationship diagrams or structural matrices. Design efficiency and product quality could be enhanced by mining the implicit relationships between system performance and design and achieving the module division of tunnel boring segment erector. Taking the three-dimensional assembly model of the tunnel boring segment erector as an example, the structural information such as part IDs and names was extracted by traversing the model tree method, as shown in Table 3. The comprehensive DSM of the segment erector was then constructed according to the relationship evaluation criteria in section “Construction criteria,” as shown in Figure 2(c).
Information on partial parts of the segment erector.


DSM of partial parts of the segment erector: (a) Structural connectivity DSM; (b) Assembly strength and contact relevance DSM; and (c) Comprehensive DSM.
Module division method
The spectral clustering method identifies the similarity between nodes by analyzing the eigenvectors of the Laplacian matrix of the network, thereby enabling community detection. Traditional spectral clustering requires the number of clusters to be specified in advance. In this study, a SC-based approach is adopted, where high-dimensional data is mapped into a low-dimensional feature space through spectral embedding, and an adaptive clustering method is applied to automatically determine the optimal number of clusters, enabling product module division. The similarity model based on the EC aims to quantify the similarity between nodes by simulating the behavior of an equivalent capacitance network. It considers the contributions of paths of order three or lower to capture indirect connections between components, and incorporates both direct and indirect relationships in module division to improve its accuracy. The similarity model based on oWRA-CC enhances the representation of latent associations between nodes by integrating high-order path weights and node importance. This model is then applied to the spectral clustering algorithm to improve the rationality and effectiveness of community division.
Taking the tunnel boring machine segment erector as the application object, the traditional SC algorithm and the EC similarity model and oWRA-CC similarity model were used to the module division in this article. Additionally, the module division results obtained by each method were presented in detail.
Method 1: The traditional SC algorithm. The traditional SC algorithm was used for initial module division according to the comprehensive DSM, and the division scheme with the largest modularity was obtained as shown in Figure 3(a). The modularity of this scheme is 0.383.

Module division results of different methods: (a) SC algorithm; (b) EC similarity model (The black lines represented explicit relationships, and the red lines represented implicit correlation relationships).
Method 2: The EC similarity model. The relationship between parts was analogized to capacitors in the capacitance network, where each part corresponded to a node, and the relationship between parts corresponded to the capacitance between nodes. The similarity between nodes was calculated based on the EC similarity model. The SC algorithm was then used for module division after removing the edges with the minimum similarity sequentially, and the division scheme with the largest modularity was obtained as shown in Figure 3(b). The modularity of this scheme is 0.391.
Method 3: The oWRA-CC similarity model. Firstly, the comprehensive DSM of the parts was constructed and mapped into a complex network. The DFS algorithm was used to systematically traverse all possible paths from the source node to the target node, capturing all potential connection paths between parts so as to ensure no existing paths were missed, as shown in Figure 4(a). Secondly, an adjustment parameter α was introduced. To determine its optimal value, this study employed a grid search method with a step size of 0.1 within the interval (0, 1), ensuring the stability of parameter selection and avoiding reliance on empirical settings. The AUC metric was used to evaluate the effectiveness of node similarity calculations under different α values, and the optimal α was identified to more accurately reflect the strength of association between nodes, as shown in Figure 4(b). Then, the oWRA-CC similarity model was used to calculate the similarity between nodes, comprehensively quantifying both explicit and implicit relationships among parts, providing a foundation for the module division and optimization of complex products. The calculation results are shown in Table 4.
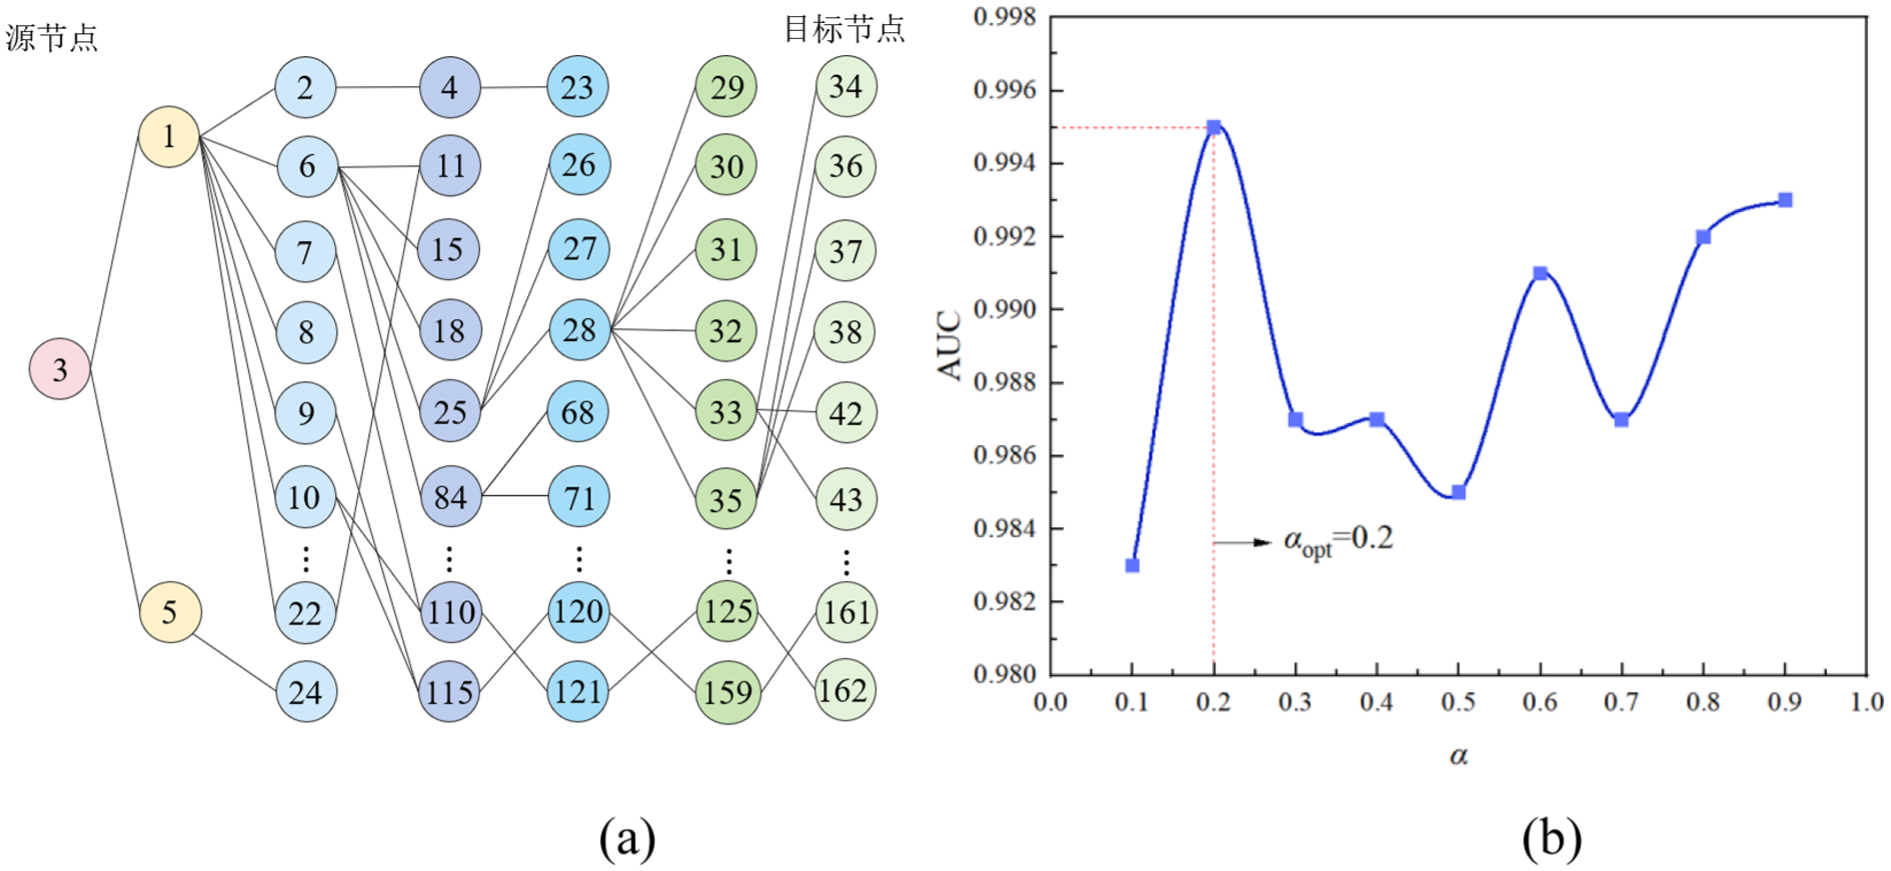
Determination of the optimal path and the best α value: (a) The DFS algorithm was used to determine the optimal path; (b) The best α value was determined by AUC index.
Node similarity.

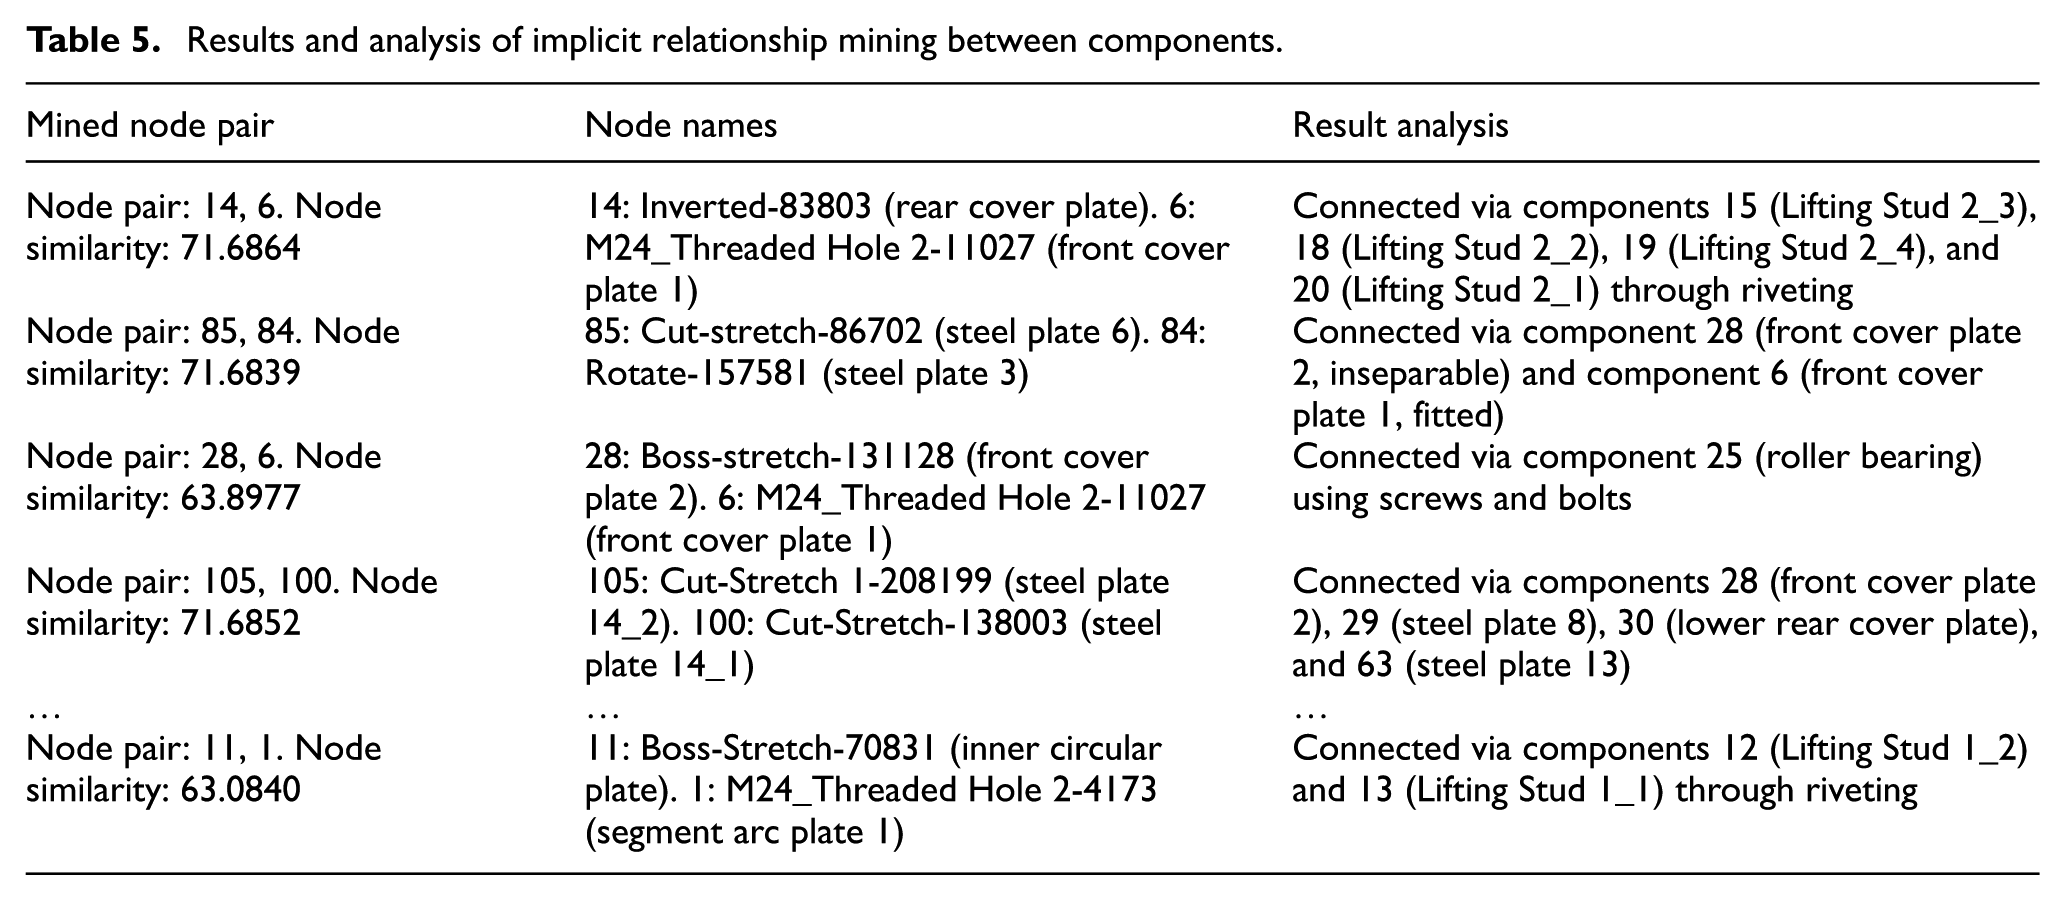
Based on the 3D model of the tunnel boring machine segment erector, the implicit associations between node pairs were analyzed. Taking components 6 (Front Cover Plate 1) and 14 (Rear Cover Plate) as an example, these components are connected via components 15 (Lifting Stud 2_3), 18 (Lifting Stud 2_2), 19 (Lifting Stud 2_4), and 20 (Lifting Stud 2_1). Therefore, components 6 and 14 exhibit design synergy to ensure structural stability, as shown in Figure 5. The analysis results are stored as structured data in an Excel spreadsheet, as presented in Table 5. The extracted implicit relationships are integrated into the original knowledge base to enrich the correlation information of complex products, which in turn provides reliable data support for module division. The explicit and implicit knowledge base of the segment erector is illustrated in Figure 6.

Analysis of the implicit correlation between components 6 and 14.
Results and analysis of implicit relationship mining between components.

Knowledge base of explicit and implicit relationships for selected segment assembling machine components.
Finally, the SC algorithm was then used for module division after removing the edges with the minimum similarity sequentially, the largest modularity was obtained as shown in Figure 7(a) and the division scheme is shown in Figure 7(b). The modularity of this scheme is 0.421.
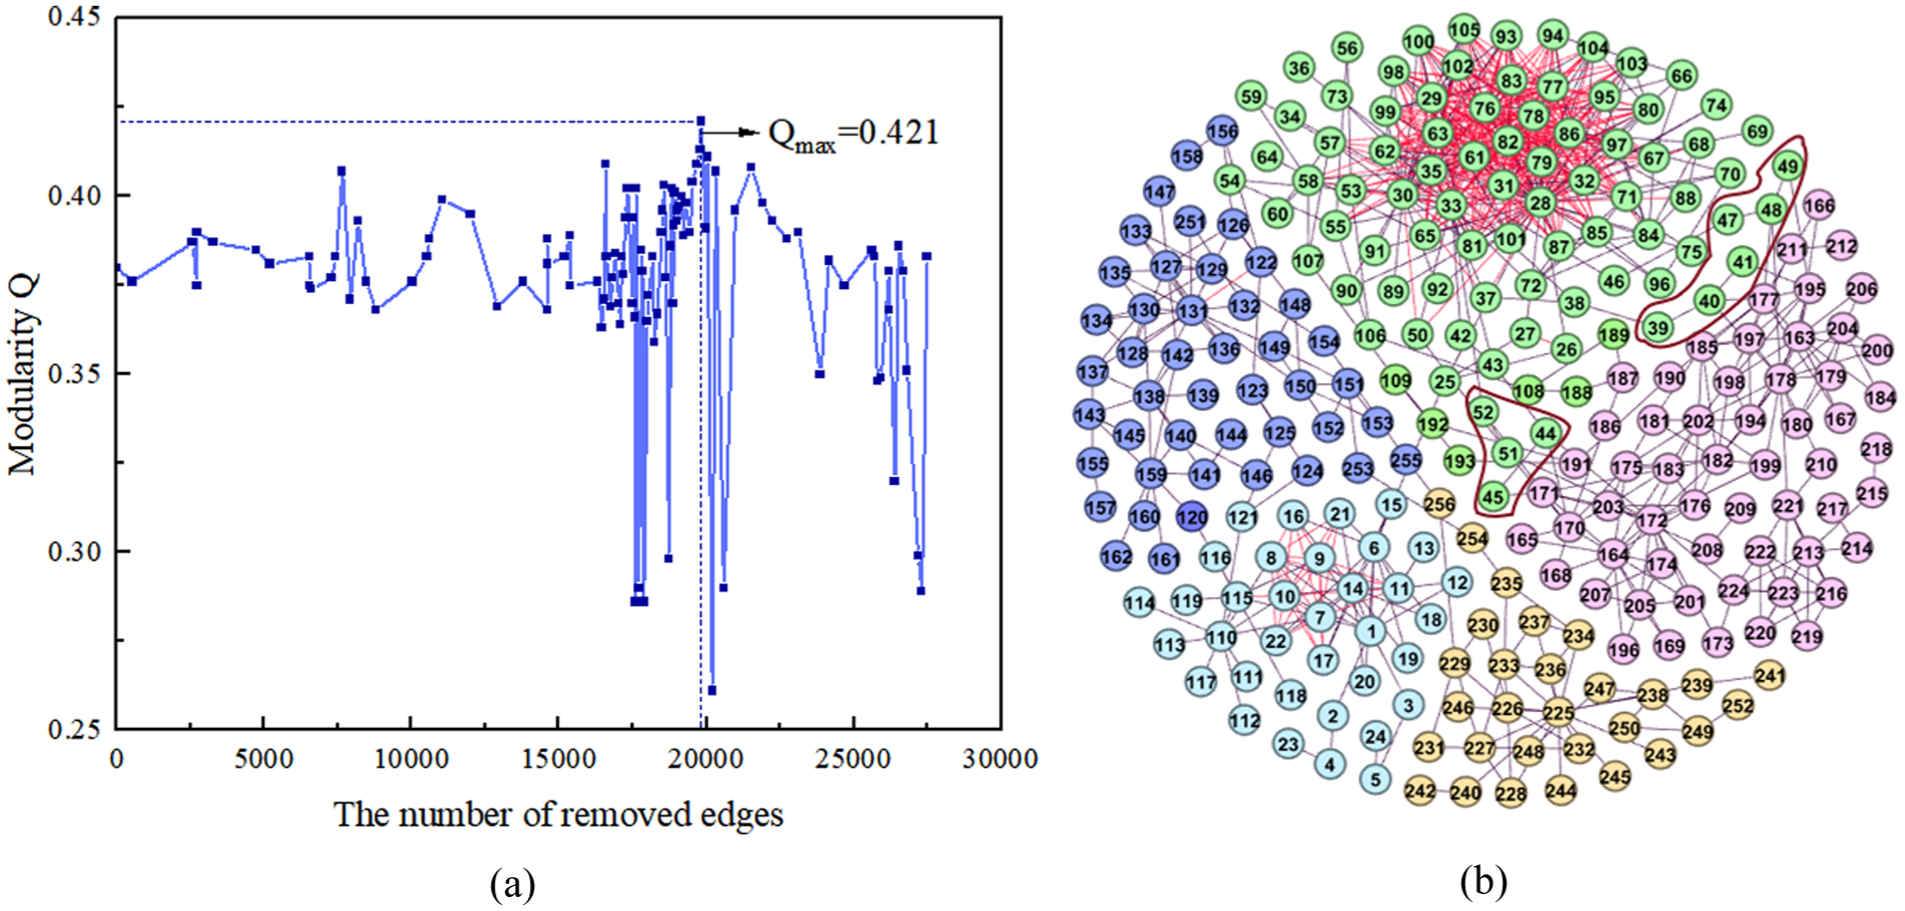
The optimal module division scheme of the oWRA-CC similarity model: (a) The optimum modularity after removing the edges with the minimum similarity sequentially; (b) The optimal division scheme (The black lines represented explicit relationships, and the red lines represented implicit correlation relationships).
Comparative analysis of division schemes
Taking the tunnel boring machine segment erector as the application object, three modular division schemes were generated using the traditional SC algorithm, the EC similarity model, and the proposed oWRA-CC similarity model. The results of the SC and EC-based schemes are shown in Figure 3(a) and (b), respectively, while the oWRA-CC-based result is presented in Figure 7(b). The modularity values obtained from each method are shown in Figure 8, and the closeness C i values were calculated using the TOPSIS method based on the D1, D2, and S indicators (see Table 6).

The comparison of modularity between the three algorithms for the module division scheme.
Evaluation index results of the three division schemes.

Among the three schemes, the oWRA-CC model achieved the highest modularity—9.92% and 7.67% higher than that of the SC and EC models, respectively—and also obtained the highest C i value. These results indicate that the oWRA-CC model produces a more refined community structure with stronger intra-module cohesion and lower inter-module coupling.
Furthermore, in all three schemes, Part 38 is assigned to Module M2 (translation mechanism), and Part 195 to Module M3 (main suspension beam). According to the local exploded view of the 3D model (Figure 9), Parts 38, 39, 40, and 41 are sequentially fixed-connected, while Part 41 connects to Part 195 via a sliding joint. From the perspective of assembly and hierarchical structure, assigning Parts 38–41 to Module M2, as done by the oWRA-CC-based scheme, results in a tighter and more functionally reasonable module division than schemes that separate them. This highlights the practical advantage of the oWRA-CC similarity model in capturing real-world structural relationships.

Local exploded view of the tunnel boring segment erector.
The oWRA-CC similarity model was used to divide the tunnel boring machine segment erector, resulting in the optimal division scheme consisting of five modules: M1 rotary lifting mechanism, M2 translational mechanism, M3 main suspension beam, M4 yoke and M5 gripping head, as shown in Figure 10. Specifically, M1 is responsible for precise rotation and lifting the segments, ensuring its height and angle adjustment during the assembly process; M2 enables flexible movement of the segments between different positions through the horizontal movement, providing the necessary spatial positioning for assembly; M3 serves as the core structural support, not only bearing the weight of each module but also ensuring the stability and rigidity of the entire system; M4 plays a key role in connecting and fixing the components, enhancing the integrity and coordination of the system; M5 directly contacts the segments and is responsible for grabbing and releasing them, acting as the final executor of the assembly operation. Based on the division results, designers can quickly replace parts within the modules to generate new module instances, thereby meeting new requirements. The segment erector products that meet the new requirements can be generated, thus responding to market demand during the product configuration process.
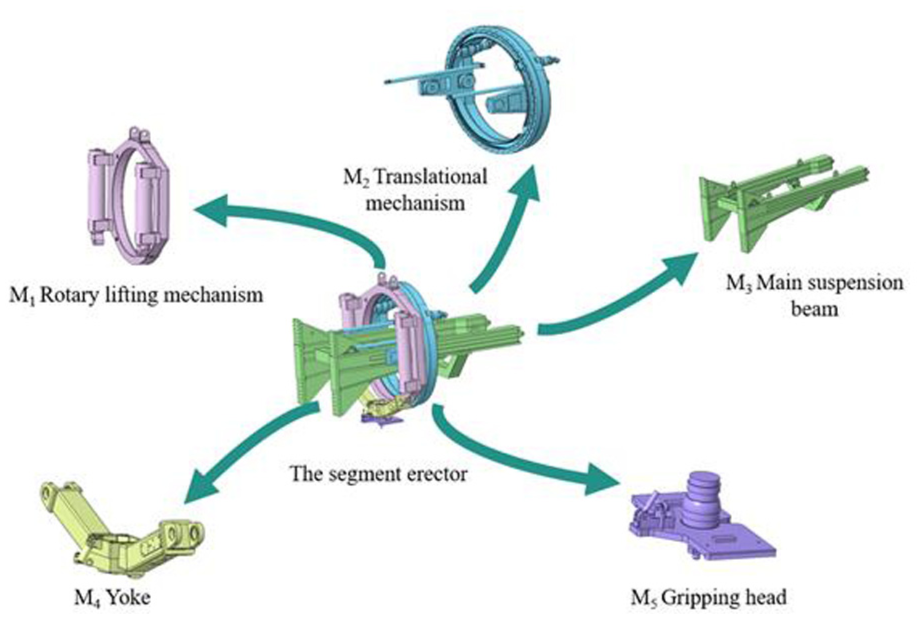
Division results of the 3D model of the segment erector.
Conclusion
(1) The oWRA-CC similarity model was applied to the spectral clustering algorithms for optimizing the process of module division of complex product parts. The explicit and implicit relationships between parts were comprehensively quantified by analyzing the network paths between parts and by mining implicitly unlabeled or unrecorded relationships. It is not only improving the accuracy of implicit relationship mining but also optimizing the precision of module division, resulting in a solution that satisfies the principle of “strong cohesion within modules and weak coupling between modules.”
(2) Taking the tunnel boring machine segment erector as application object, the traditional SC algorithm and the EC similarity model and the oWRA-CC similarity model was used in module division. The modularity of the optimal division schemes is 0.383, 0.391, and 0.421. The D1 values are 0.0474, 0.0471, and 0.0421. The D2 values are 0.0003, 0.0004, and 0.0004. The S values were 0.0879, 0.0874, and 0.086.
(3) A comparative analysis of the division schemes obtained from the traditional SC algorithm, and the EC similarity model, and the oWRA-CC similarity model shows that the modularity of the oWRA-CC similarity model is 9.92% and 7.67% higher than that of the traditional SC algorithm and the EC similarity model, respectively. Meanwhile, its closeness C i value is the highest, which indicates that the network community structure divided by the oWRA-CC similarity model is more refined and the node correlation within modules is stronger.
Footnotes
Handling Editor: Chenhui Liang
Funding
The authors disclosed receipt of the following financial support for the research, authorship, and/or publication of this article: This work was supported by the 2023 Annual Basic Research Project of the Key Scientific Research Project Plan of Colleges and Universities in Henan Province (Project No. 23ZX013), the 2024 National Natural Science Foundation of China (Project No. 52375034), and the 2025 Annual Science and Technology Innovation Talents in Colleges and Universities in Henan Province (Project No. 25HASTIT035).
Declaration of conflicting interests
The authors declared no potential conflicts of interest with respect to the research, authorship, and/or publication of this article.