
Abstract
This study quantifies and predicts the pressure drop (ΔP) of membrane-based energy recovery ventilator (ERV) cores using a controlled dataset comprising nine cores with three face sizes (150, 250, and 350 mm) and three channel heights (H c = 1.8, 2.0, and 2.6 mm), evaluated at 61 operating points spanning 56–547 m3 h-1 (Re = 94.8–1604.9) at 25°C and 50% RH. The cores were constructed with a 0.033- mm cellulose membrane and a 0.06- mm spacer and were tested using a ±1% differential pressure sensor (expanded uncertainty U ≤ 5.0 Pa at 95% confidence); pointwise repeatability (standard deviation) was 0.16–4.54 Pa. Measured ΔP ranged from 18.1 to 296.3 Pa. To remove length effects, we used the equivalent pressure drop P e = ΔP/L and developed two closed form multivariate polynomial correlations: Case 1 based on opening ratio (OR) and channel velocity (u c ), and Case 2 based on OR and Reynolds number (Re). Across the full dataset, both predictors showed high fidelity (R2 = 0.996 and 0.991), with maximum absolute errors of 12.19 and 16.23 Pa, respectively. In our judgment, OR and u c are the primary design variables for accurate, low- bias ΔP prediction in ERV cores. Therefore, we recommend adopting the Case 1 correlation particularly for ΔP < 100 Pa and selecting cores with larger H c , where thermal efficiency targets permit, to reduce fan power. Overall, the dataset and equations provide practical guidance for blower sizing, core selection, and rapid design stage evaluation of ERV pressure losses.
Keywords
Introduction
Efficient energy use in buildings is a critical pathway to reducing operating costs and achieving carbon and peak load targets. As envelopes become more airtight under passive house and nearly zero energy building standards, mechanical ventilation is mandatory to maintain indoor air quality; however, the associated fan power and ventilation loads can erode energy savings if pressure losses are not carefully controlled. Energy recovery ventilators (ERVs) mitigate sensible and latent loads by exchanging heat and moisture between supply and exhaust streams, yet the blower power scales with the pressure drop (ΔP) across the exchanger core and ducts. Accordingly, reliable, design- ready prediction of ΔP over residential flow ranges is essential for right sizing fans, meeting efficiency targets, and minimizing life- cycle costs.
In South Korea, measures to improve building insulation and airtightness are being employed due to the rise of policies promoting passive house and zero-energy buildings. Ensuring proper ventilation is critical in modern, airtight buildings to maintain indoor comfort and air quality because people spend considerable time indoors during the day. Technologies are required to ensure good indoor air quality in spaces such as offices, homes, and schools as people living in large cities spend most of their time in such spaces. Indoor air quality directly affects the health of occupants. Ventilation is an active control strategy that can address indoor air pollution and allow spaces to be habitable. 1 Across 56 offices, outdoor air volume emerged as a primary driver, along with HVAC system settings, set points, and lighting—reaffirming the connection between ventilation and fan power (ΔP). 2 Ventilation is the process of replacing polluted indoor air with fresh air from the outside. The heating and cooling loads of buildings can drastically increase during summer and winter due to major temperature differences between internal and external spaces. 3
Although increasing the ventilation improves indoor air quality, the heating and cooling loads of buildings increase rapidly. 4 According to a study conducted by Laverge and Janssens, infiltration and exfiltration account for up to 50% of total heat loss in well-insulated buildings in moderate climatic conditions in Europe. 5
Therefore, developing facilities that can reduce the heating and cooling loads and maintain comfortable indoor air environments is crucial. 6 A PCM-integrated ERV showed up to |ΔT| ≈ 9.5 K and higher sensible effectiveness with minor flow penalty. 7 The PCM-integrated HRV performance was verified in situ under dynamic driving conditions. The temperature difference (ΔT) was approximately 9.52 K in summer and 9.41 K in winter. The maximum efficiency reached 50% under peak conditions; however, the impact of the pressure difference (ΔP) was limited. 8
A heat recovery ventilator is a device that expunges air from the inside of a building and fetches fresh air from the outside. 9 It is an effective device that delivers fresh air to rooms and decreases the heating and cooling energy from the ventilation load by recovering energy through heat exchange between the incoming outside air and outgoing indoor air.10–13 A coupled heat–mass transfer model (LMTD–Nu–Sh, Le ≈ 1) for membrane cross-flow energy recovery ventilators (ERVs) was validated using CFD simulations and experimental data. The results indicate that lower airflow rates increase both sensible and latent effectiveness, with latent effectiveness being more sensitive to membrane mass diffusivity than to thermal conductivity. 14
Energy recovery ventilators (ERVs) have been widely used in Asian and European countries to meet construction requirements. 15 Studies have investigated the effects of ERVs on building energy performance. The efficiency of decreasing required heating and cooling energies because of ventilation loads varies depending on local climatic parameters, such as outdoor air temperature and humidity. This in turn substantially affects ERV efficiency. Liu et al. 16 reported that an ERV with 75% efficiency may reduce the required heating energy by 20% during summer in five Chinese cities. Rasouli et al. 17 demonstrated that depending on the climate and system efficiency, operating ERVs under proposed optimal conditions could save up to 20% of the required cooling energy per year. Zhong and Kang 18 investigated the suitability of ERVs in various climate zones in China and developed suitable heat exchangers.
Quasi-counterflow membrane exchangers demonstrated approximately 5% higher sensible and latent effectiveness compared to cross-flow designs. Variations in microstructure and surface characteristics primarily influence transfer coefficients and frictional pressure drop (ΔP). Additionally, effectiveness decreases as face velocity increases. 19 A hollow-fiber membrane core with climate-aware control achieved latent heat recovery of approximately 74.9% in summer and sensible heat recovery of approximately 80.1% in winter. Pore size, membrane thickness, and diffusion resistance primarily influence latent heat transfer. 20
In airtight, well-insulated buildings, ERV/HRV design aims to balance high effectiveness (ε) with low pressure drop (ΔP). Recent studies approach this as a multi-objective optimization problem involving ε, ΔP, and airflow.
A serialized cross–counterflow model coupled with the ε–NTU method and a comprehensive ΔP formula (including friction, acceleration, entrance, and exit losses) was developed, providing a ΔP-constrained, minimum-volume design procedure that leverages the counterflow advantage. 21 A mesh-net turbulator increased the Nusselt number (Nu) by up to 75% and the heat transfer coefficient (U) from 24 to 36 W m−2 K, albeit at the expense of increased pressure drop (ΔP) and pumping power. However, the overall economics can remain favorable when considering electricity prices and the coefficient of performance (COP). 22 CFD analysis demonstrated that the supply and exhaust layout, as well as the placement of objects within a cryogenic chamber, significantly influence the cooling rate (35%–79%) and energy consumption (20.9%–47.7%). 23
Figure 1 shows a typical heat recovery ventilator. The ventilator core is the primary component of heat recovery ventilators, and heat exchange occurs within it. Figure 2 shows the schematic of the ventilator core.

Typical heat recovery ventilator.
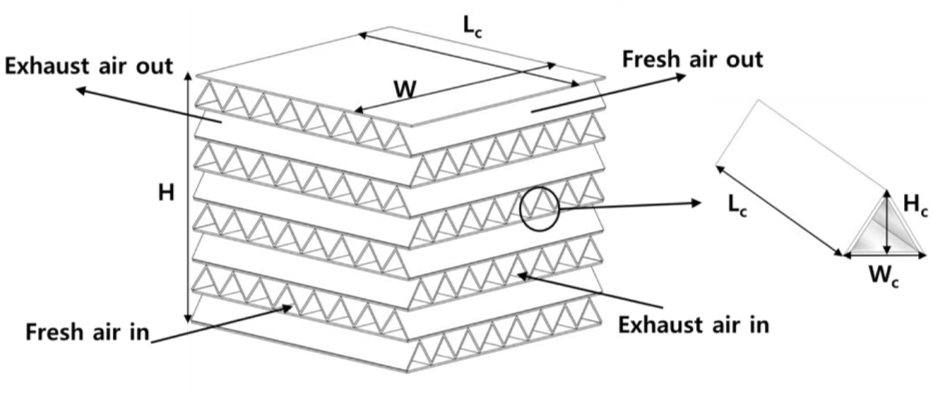
Schematic of the ventilator core.
Studies on heat recovery ventilators have examined the performance of the ventilator core under certain temperature and humidity conditions. Numerous tests have been conducted to study the performance of the ventilator core.24–26 Engarnevis et al., 27 Papakostas and Kiosis, 28 Siegele, 29 and Gao et al. 30 experimentally analyzed the energy efficiency performance of membrane-based ERVs (MERVs).
Zhang, 31 Siegele and Ochs, 32 and Qiu et al. 33 compared the energy efficiency performances of MERVs through experimental methods and based on effectiveness and number of transfer units. Zhang et al. 34 and Kwak and Bai 35 experimentally investigated the energy efficiency and pressure-drop characteristics of MERVs.
Song et al. 36 investigated the pressure-drop characteristics of the ventilator core based on its size, air volume, and opening rate. However, most studies on MERVs have focused on analyzing their energy exchange efficiency performance.
Al-Waked et al.37,38 demonstrated that the intersection direction of the cold and hot sides of the MERV core results in a pressure drop difference of up to 20%. Furthermore, they confirmed that the channel velocity exerts a dominant effect on the pressure drop at the same hydraulic diameter.
Zhang 39 and Liu and Niu 40 corroborated that when the Reynolds number of the ERV core is less than 1000, the friction factor declines precipitously with an increase in the Reynolds number, and the decline becomes more moderate when the Reynolds number exceeds 1000. Zhang 41 conducted experiments and analyses on a quasi-counter flow parallel-plates total heat exchanger and confirmed that the volumetric airflow rate and pressure drop are proportional. Similarly, Koester et al. 42 analyzed the pressure drop in relation to variations in the Reynolds number under quasi-counter flow conditions and confirmed that the Reynolds number and pressure drop are proportional.
Liu et al. 43 conducted an analysis of the pressure drop in relation to variations in the Reynolds number under quasi-counter flow conditions similar to those described by Koester et al. 42 Their findings confirmed that the Reynolds number and pressure drop tend to be proportional.
Furthermore, Liu et al. 43 conducted an analysis of the pressure drop and friction factor over a wider Reynolds number range than that considered by Koester et al. 42 Their results demonstrated good agreement with the experimental values, as evidenced by the correlation equation between Reynolds number and friction factor.
In a study conducted by Jafarizave et al., 44 the friction factor values for four distinct geometries of MERV core spacers (circular, curved, triangular, and parallel plates) were compared. The findings confirmed that circular ducts exhibited the highest friction factor, while parallel plate ducts demonstrated the lowest friction factor.
When the ERV is operated under conditions characterized by significant differences in temperature and humidity between the indoor and outdoor environments, condensation forms within the MERV core. This condensation results in an increase in pressure drop across the MERV core. Abadi et al. 45 measured the pressure drop in the MERV core, where condensation occurs. It was confirmed that after condensation begins, the pressure drop gradually increases in line with the increase in condensation amount. After a certain period, the pressure drops stabilizes and reaches a steady state. Effective condensation management is a crucial factor in maintaining the efficiency and performance of ERVs.
Nasr et al. 46 employed four methods (visual inspection, pressure differences, effectiveness, and temperature difference) to identify the formation of frost within the MERV core under conditions of low ambient temperature. The efficacy of these detection methods was then evaluated. Of the four methods employed, pressure differences and temperature differences were identified as the most reliable and practical. It was confirmed that the formation of frost within the MERV core results in a narrowing of the flow path within the channel, leading to an increased pressure drop. If the increase in pressure drop can be measured in real time to detect frost formation early, it can be reflected in the operating conditions to enhance the efficiency of the ERVs.
In their study, Engarnevis et al. 47 conducted dust acceleration experiments using ISO A3 dust with the objective of analyzing the performance changes of the MERV core resulting from contamination. Their findings confirmed that as the dust load increases, the pressure drop caused by dust contamination on the MERV core also increases proportionally.
In a performance analysis comparing MERV cores with planar surface geometry to those with complex surface geometry, Al-Zubaydi and Hong 48 confirmed that while MERV cores with complex surface geometry exhibited higher heat exchange efficiency, they also experienced a significant increase in pressure drop.
Zhang 49 conducted experiments on energy efficiency and pressure drop for two types of MERV cores: paper-fin and paper-plate, as well as paper-fin and CSLM (composite supported liquid membrane) plate. The results demonstrated that the paper-fin and CSLM-plate exhibited a 60% greater latent effectiveness compared to the paper-fin and paper-plate. The pressure drops across two MERV cores with identical thickness and geometry should be the same. However, the results of the experiment demonstrated that the pressure drop across the paper fin and the CSLM plate was greater. The paper explains that this discrepancy can be attributed to the membrane having a rougher surface than the paper, which creates increased resistance to airflow.
Feng et al. 50 demonstrated through experimentation and analysis that the Nusselt number exhibits a notable increase when an appropriate baffle is positioned within the MERV core channel. Furthermore, the relationship between the Nusselt number and the friction factor based on the baffle’s position was analyzed using CFD. It was confirmed that as the Nusselt number of the MERV core increases, the friction coefficient also rises. However, it was also demonstrated that the PEC (Performance Evaluation Criteria) value, which represents the comprehensive performance of heat transfer and flow, has been shown to increase even more in the case where the Nusselt number increases.
Woods and Kozubal 51 conducted an experiment to measure the friction factor of the MERV core, altering the shape of the spacer in order to confirm whether this would affect the efficiency and friction factor of the MERV core. Their findings indicated that both of these factors can be significantly influenced by the shape of the spacer.
In their study, Lee et al. 52 evaluated the efficiency and pressure drop of the MERV core by varying the height of the MERV core spacer (2.0 and 2.6 mm). The results demonstrated that the pressure drop increased significantly when the spacer height was set to 2.0 mm in comparison to 2.6 mm.
In a comparative experiment conducted by Zhang, 53 the efficacy of sinusoidal and triangular spacer geometries of MERV cores was evaluated. It was observed that while the friction factors of the two geometries exhibited similarity in the region where the Reynolds number was below 500, the triangular spacer geometry demonstrated a markedly lower friction factor in the region where the Reynolds number exceeded 500.
The blower fan is the largest energy-consuming component of an MERV, and predicting pressure drops in the MERV core is critical in designing the blower fan; however, limited studies have focused on predicting the differential pressure in the MERV core. A pressure-drop prediction equation for the MERV core was proposed in a study; however, it was only applicable to a specific element size and airflow range, limiting its universality. In the present study, the size of the MERV core and experimental airflow rate were set considering the full range applicable in residential buildings. Further, based on experimental results, data analysis was performed to identify parameters that are effective in predicting pressure drops.
Methodology
The number of air-change instance was set to 1 per hour, and the experimental air volume was adjusted between 22 and 220 m2 to cover a wide range of floor areas. Further, three sizes of MERV cores were selected based on the volume range of MERV cores and actual air volume used by ERVs. Finally, three sizes of cells present in the MERV cores were selected based on sizes frequently used in actual ERVs. Thus, nine ventilator cores were tested based on the shape and size (Figure 3).

Nine ventilator cores used in the experiments (length of the ventilator core = 150, 250, or 350 mm; cell height = 1.8, 2.0, or 2.6 mm).
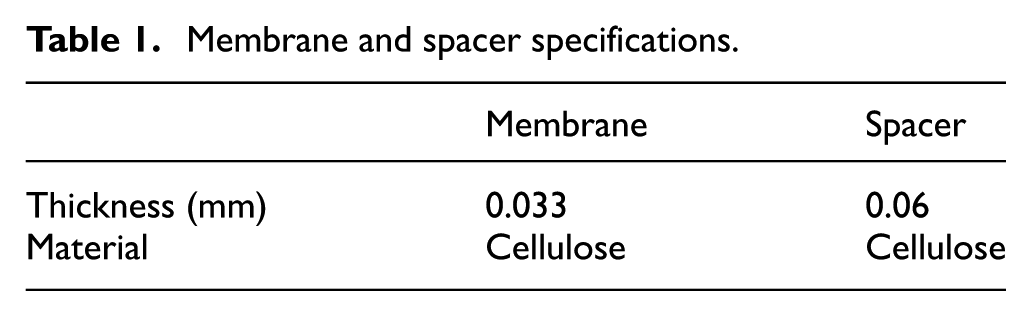
The base paper used in the experiments was the same as that used in high-efficiency heat recovery ventilators, and the material, membrane thickness, and spacer thickness were the same for all the nine ventilator cores (Table 1). Table 2 lists the external dimensions of the nine ventilator cores along with the core sizes used in the experiments.
Membrane and spacer specifications.
Dimensions of tested ventilator cores.

A differential pressure sensor (Manufacturer: Beck (Germany), Model: 984A.543, Accuracy: ±1%) was used to monitor pressure drops, and the value measured by the sensor was inputted to a PC in real time through a data logger (Manufacturer: Keysight Technologies, USA; Model: DAQ970A). Further, a self-made multinozzle fan tester (Figure 4) was used to measure the airflow across the ventilator core. The EJA110A (Manufacturer: Yokogawa Electric (Japan), Model: EJA110A, Accuracy: ±0.065%) differential pressure transmitter was used to measure the differential pressure before and after the fan tester’s nozzle.

Multinozzle fan tester and differential pressure transmitter.
The storage and testing of the ventilator core were conducted under conditions of 25°C, 50% relative humidity, and atmospheric pressure. Figure 5 shows the experimental setup used for measuring pressure drops in the ventilator core. In the experimental setup, the length of the ventilator core and the lengths of the upstream and downstream ends were identical. Pressure drops at the front and back of the ventilator core were measured after starting the blower, and airflow through the ventilator core was stabilized.
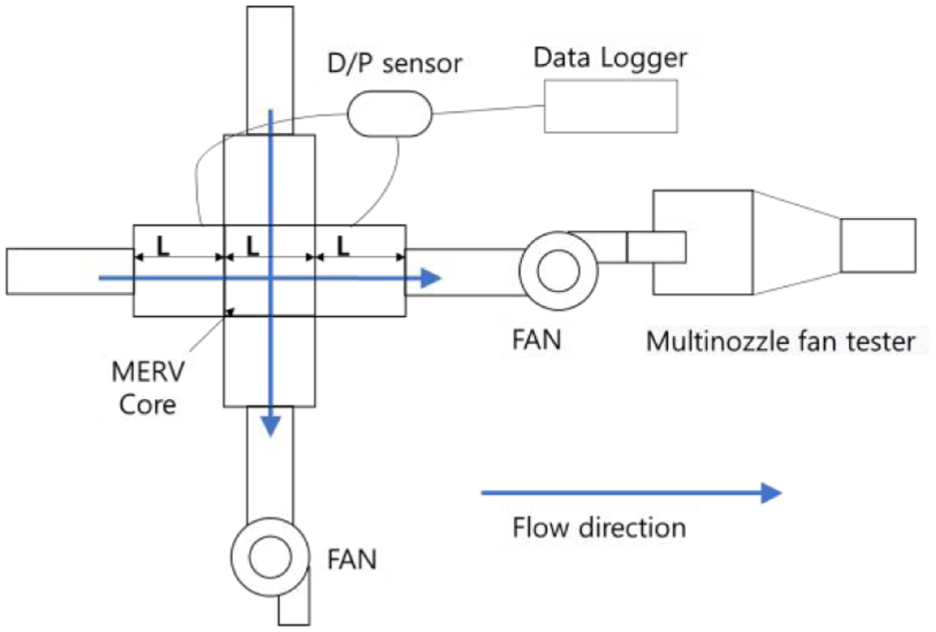
Schematic of the experimental setup used for measuring pressure drops.
Nine ventilator cores were tested in the airflow range of 56–547 CMH. Table 3 lists the experimental volumetric airflow rates set for each ventilator core.
Volumetric airflow rate under test conditions.

The average airflow velocity in each channel within the core is necessary for computing the Reynolds number (Re) in the cores. As expressed in equation (1), the airflow velocity in front of the core (u), which is the average ventilator core inside the channel, is determined using the observed airflow rate (V) divided by the cross-sectional area of the ventilator core. The ventilator core is a stacked structure composed of a membrane and spacer, with intersecting hot and cold sides. Because the airflow space on the hot and cold sides is 50% each, half of the front part of the ventilator core is blocked. The real flow space is <50% of the shear area of the ventilator core because of the thickness of the spacer and membrane. Equation (2) expresses the ratio of the effective flow space to the shear area of the ventilator core.
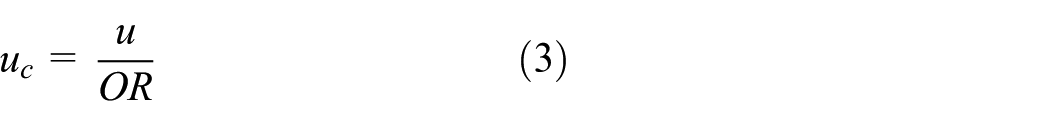
The airflow velocity in the shear area of the ventilator core and the effective opening ratio (OR) inside the ventilator core were used to calculate the effective channel velocity (uc) inside the core (equation (3)):

where H is the height of the ventilator core (mm) and L is its length (mm).

where W c is the width of the flow channel cross-section (mm), T m is the thickness of membrane (mm), H c is the height of the flow channel cross-section (mm), and T s is the thickness of the spacer (mm).
The hydraulic diameter of the internal channel of the ventilator core is obtained using equation (4).39,40,50,54,55 The Re of the channel inside the ventilator core is obtained using uc obtained from equation (3) and the hydraulic diameter obtained from equation (4), as expressed in equation (5).

where D h is the hydraulic diameter (m), V m is the volume of a flow unit (m3), and A m is the surface area of a flow unit (m2).

where ρair is the air density (kg/m3) and μair is the dynamic viscosity of air (kg/m s).
Table 4 presents the Re obtained from equation (5) for the experimental conditions for each ventilator core; it ranged from 94.8 to 1604.9.
Reynolds number under different test conditions.

Case study and results
Experimental test and uncertainty
Herein, 61 pressure-drop experiments were conducted for each airflow condition for the nine ventilator cores (Table 2). Table 5 summarizes the experimental results as per the shape and airflow rate of the ventilator core.
Experimental data.

According to Gao et al. 30 and Qiu et al., 33 measurement uncertainty can be assessed using Type A (statistical methods) and Type B (probability distributions). Repeated measurements can be described by a normal distribution, and instrument-related uncertainty can be described by a uniform distribution. Type A and Type B uncertainties are calculated using equations (6) and (7), respectively.

Here, n is the number of measurements (n = 5 in this study), x
j
is the jth measured value (j is from 1 to 5), and
Type A and Type B are synthesized with the standard uncertainty u c as in equation (8). The standard uncertainty of the directly measured variable pressure drop can be calculated through partial differentiation as in equation (9).


The expanded measurement uncertainties (U) of P (pressure drop) can be calculated using equation (10). Herein, K (coverage factor) was set as 1.96, obtaining a confidence level of 95%. 56

Accordingly, the maximum expanded U of P was found to be 5.0 Pa. Figure 6 shows the experimental results summarized in Table 5 and the uncertainties of individual experiments.

Pressure drop versus airflow rate for each ventilator core.
Across the cores, the pressure drop (ΔP) increases monotonically with the volumetric flow rate, and the curvature indicates an approximately quadratic dependence on the channel velocity (u c ), as expected from the Darcy–Weisbach equation in equation (11), assuming the friction factor (f) varies slowly with the Reynolds number (Re). For the same flow rate, cores with a larger cell height (H c = 2.6 mm) exhibit noticeably lower ΔP than those with H c = 1.8 or 2.0 mm, consistent with their higher opening ratio (OR), which reduces viscous and minor losses.
Figure 7 show the plot of pressure drop versus Re. Under the same Re condition, the pressure drop clearly increased as the channel size increased. Because of a low cell height (H c ) in the channel, the pressure drop clearly increased with decreasing OR. The size of each cell within the MERV core and airflow velocity within the cell vary depending on the orientation and design conditions of the ventilator cores. For most airflow ranges under which ERVs are used, the results shown in Figure 7 can be utilized to estimate the approximate pressure drop in the MERV core.

Pressure drop versus Reynolds number for each ventilator core.
Friction factor and equivalent pressure drop
Using D h obtained from equation (4) and uc obtained from equation (3), the friction factor (f) of the core can be determined (equation (11)).39,43,50,54,55f can be further expressed in terms of the pressure drop (equation (12)) as well as equivalent pressure drop, which is pressure drop divided by the channel length (equation (13)).
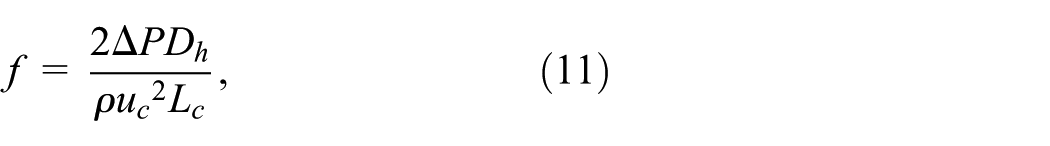
where ΔP is the pressure drop (Pa) and L c is the length of the flow channel cross-section (mm).


where Pe is the equivalent pressure drop (Pa/m).
When D h and internal flow velocity of each channel are determined based on the design conditions, and f is necessary to predict pressure drops. Figure 8 shows the variation of f with respect to Re. Zhang 53 analyzed the relationship between Re and f for specific ventilator geometries, which were similar to the geometries employed herein. They demonstrated that f decreased rapidly when Re was <1000 and the f values converged when Re was >2000. The results of the present study show similarity with the aforementioned results, and the correlation between Re and f also demonstrates a similar trend.

Friction factor versus Reynolds number for each ventilator core.
Figure 9 shows the relationship between u c and pressure drop. Smaller H c of the core and higher H lead to larger pressure drop for the same u c . For a fixed u c , ΔP is higher when H c is smaller (i.e. lower OR) and when the face size H is larger, indicating that both the channel geometry and core scale contribute to losses. This supports the use of the equivalent pressure drop Pe to normalize length effects.

Pressure drop versus channel velocity.
Figure 10 shows the relationship between uc and the equivalent pressure drop. For cores with the same H c , the equivalent pressure drop changed almost similarly with increasing u c even if L differed considerably. After converting to the equivalent pressure drop Pe, the curves for cores with the same H c nearly collapse despite differences in L. This demonstrates that Pe eliminates length effects and provides a geometry-centric descriptor that is transferable across core sizes. Designers can therefore compare different lengths (L) using Pe without re-testing each length.

Equivalent pressure drop versus channel velocity.
Figure 11 shows the relationship between Re and equivalent pressure drop. Cores with the same H c showed almost same values, and the distinction among cores with different H c became clearer. Pe versus Re groups distinctly according to H c , enhancing the separation among channel heights observed in Figure 7. This confirms that H c (and the derived OR) is the dominant geometric factor influencing ΔP at a constant Re.

Equivalent pressure drop versus Reynolds number for each ventilator core.
Analysis of prediction results
Equivalent pressure drop was determined based on the experimental results shown in Table 5, and multivariate polynomial regression analysis was conducted for the variables related to pressure drops. The variables used in the multivariate polynomial regression were the OR, u c , and Re of the core. Table 6 summarizes the two regression cases.
Regression cases.

By performing a multivariate polynomial regression analysis, the predictive equation for the equivalent pressure drop was expressed as shown in equation (10); the values of the coefficient

Results of determining

OR can be calculated from the shape and thickness of the membrane and spacer (equation (2)), u c at an arbitrary airflow rate can be calculated using equations (1) and (3), and Re can be calculated using equations (4) and (5). Furthermore, pressure drop can be calculated by multiplying the predicted equivalent pressure drop with L c . Thus, only L and the airflow rates are required to predict the pressure drop in the ventilator core. The multivariate polynomial regression analysis was performed using PIDOTECH’s PIAnO 2021 Metamodeler.
Equations (15)–(17) can be used to calculate the coefficient of determination (R2) between the predicted and experimental values obtained from equation (14). Table 8 summarizes the R2 values and maximum errors of the predictions performed herein.
Coefficient of determination (R2) and maximum errors in each regression case.

The R2 value is similar for both the cases; however, the maximum error is slightly higher in Case 2 than in Case 1. Figures 12 and 13 present a comparison of predicted values derived from the multivariate polynomial regression with the experimental values. In Case 1, the experimental values are distributed within 3% of the predicted values in most areas. However, in Case 2, the error between the experimental and predicted values increases considerably when the pressure drop is <100 Pa.

where SSerr is the sum of squared errors and SStot is the total sum of squares.
where y
i
is the ith measured value,

Comparison of pressure-drop values between experimental and predicted values (Case 1: opening ratio vs channel velocity).

Comparison of pressure-drop values between experimental and predicted values (Case 2: opening ratio vs Reynolds number).
In Case 1 (opening ratio vs channel velocity), measured points lie close to the 1:1 line over the full range, with most within ∼±3% as noted in the text. Residuals are approximately homoscedastic above ∼100 Pa and fan out slightly at the low-ΔP end, which is expected given the 5 Pa measurement uncertainty and the higher relative influence of entrance/exit losses at low u c . This pattern supports the robustness of the OR–u c correlation for design sizing.
In Case 2 (opening ratio vs Reynolds number), accuracy remains high overall; however, the scatter below 100 Pa is greater than in Case 1. Since Reynolds number does not uniquely capture the combined effects of opening ratio and local minor losses at low velocities, the OR–Re model underestimates the sensitivity of ΔP in that regime. For ΔP ≥ 100 Pa, the two models perform comparably, suggesting that Reynolds number becomes a sufficient surrogate only after the flow develops and the contributions from minor losses diminish.
Results and other discussions
This study corroborates the findings of Al-Waked et al.37,38 that channel velocity exerts a predominant influence on pressure drop at a given hydraulic diameter. Additionally, the results align with those of Zhang 39 and Liu and Niu. 40 The friction factor tends to decrease rapidly with an increase in Reynolds number when the Reynolds number of the MERV core is less than 1000, and the decrease becomes moderate when the Reynolds number is more than 1000.
The results of the present study are largely consistent with those of previous investigations examining the relationship between Reynolds number and friction factor.50,53 However, in the case of the previous study, experiments and CFD were conducted on a single MERV core size, and a prediction formula for the friction factor was derived based on the results. As a result, it is challenging to apply the relationship formula presented in the paper under conditions where the size of the MERV core is variable. In this study, the experiments were designed to reflect both the size of the MERV core and the actual volumetric airflow rate range that can be applied to the actual ERV. The objective was to derive an equation that can predict the pressure drop of the MERV core in the entire range of the MERV core size and volumetric airflow rate range applied to the actual ERV.
The geometry of the channel inside the MERV core has been the subject of study by a number of researchers, including Jafarizave et al., 44 Lee et al., 52 Zhang, 53 and others. A comparison of the previous studies reveals numerous similarities with the present study in regard to the effect of changes in cell height on pressure drop. However, in the case of the aforementioned studies, the experiments were conducted on MERV cores of a uniform size. As a result, it is challenging to apply the pressure drop prediction equation presented in the paper to conditions where the size of the MERV core and the cell height of the MERV core are variable. In this study, the experiments were designed to reflect both the size of the MERV core and the change in cell height of the ERV core. A relationship expression that can predict the pressure drop of the MERV core was derived by reflecting the MERV core size and cell height conditions inside the MERV core applied to the actual ERV. Furthermore, a comparison was performed to determine which combination of key variables that are highly correlated with pressure drop best predicts pressure drop.
Conclusions
This study focused on the prediction of differential pressure of MERV cores, which is a crucial indicator of their performances. Nine ventilator cores were developed with different configurations (H c = 1.8, 2.0, or 2.6 mm and ventilator core size = 150, 250, or 350 mm), and pressure-drop experiments were conducted with changes in the airflow rate. The sizes of the ventilator core and the ventilator core cell were chosen considering those primarily used in heat recovery ventilators. The base paper used in the experiments is the same as that used in high-efficiency heat recovery ventilators, and the material, membrane thickness, and spacer thickness were the same for all the nine cores (Table 1). The external dimensions of the nine ventilator cores used in the experiments and the dimensions of the core cells are listed in Table 1.
To predict the pressure-drop characteristics of the ventilator core, the equivalent pressure-drop value reflecting the channel length of the core in the pressure-drop experimental value was determined for each experimental case. The OR of the ventilator core as well as uc and Re inside the core were used to predict the pressure-drop characteristics. In Case 1, multivariate polynomial regression was performed to predict pressure drops based on OR and uc inside the core. In Case 2, the regression was performed to predict pressure drops based on OR and Re inside the core.
The R2 values of the prediction equations calculated through multivariate polynomial regression in Cases 1 and 2 were 0.9964 and 0.9910, respectively, which did not differ considerably. Both the cases demonstrated high prediction performance over the entire experiment data.
The maximum error between the experimental and predicted values in Cases 1 and 2 was 12.19 and 16.23 Pa, respectively. Moreover, for s pressure drop of <100 Pa, Case 2 exhibited a larger error.
The findings revealed that OR and uc inside the ventilator core are the primary variables capable of predicting pressure drops. The prediction equations derived herein are applicable for predicting pressure drops in ventilator cores with varying sizes, H c , cell widths, and airflow rates. The equations can also be applied to rectangular cores, which are commonly used in most commercial ERV ventilator cores in Korea. The ventilator core in which the experiment was performed in this study is a cubical in shape, but since the pressure drop is proportional to the length of the flow channel as in equation (12), it can also be applied to a case where the ventilator core is rectangular in shape. However, if the shape of the core is not right angles, direct application is difficult. Therefore, further research is necessary to predict differential pressures in ventilator cores with various shapes.
Footnotes
Handling Editor: Ahmed Al-Sammarraie
Author contributions
All authors contributed equally in the preparation of this article.
Funding
The authors disclosed receipt of the following financial support for the research, authorship, and/or publication of this article: This study was supported by the National Research Foundation of Korea (NRF) grant funded by the Korea government (MSIT) (RS-2024-00350135).
Declaration of conflicting interests
The authors declared no potential conflicts of interest with respect to the research, authorship, and/or publication of this article.