
Abstract
The lubrication performance of cylindrical roller bearings is directly linked to their operational accuracy and lifespan. Therefore, experimental testing is essential before deployment. However, lubrication analysis is often carried out on individual cylindrical roller bearings, ignoring the effect of the tester. Therefore, based on computational fluid dynamics (CFD), a simulation model for oil jet lubrication of cylindrical roller bearings is established in single bearing system and tester system. The effects of different oil supply speeds, rotational speeds, and radial loads on the lubrication characteristics of bearings in the two systems are investigated in this paper. The accuracy of the simulation method is verified by comparison to the experiment. The research shows that when the oil supply speed increases, the average oil volume fraction inside the bearings in the tester system is higher than that in the single bearing system. The bearing temperature shows a linear decrease in the two systems. As the speed increases, the decreasing trend of the average oil volume fraction in the tester system differs from that in the single bearing system. The bearing temperature rises and exceeds that of the single bearing system. When the load increases, the temperature rise of the cylindrical roller bearings in the tester system is greater than that in the single bearing system.
Keywords
Introduction
Cylindrical roller bearings operating under extreme conditions generate significant amounts of heat. Poor lubrication conditions may result in the overheating of raceways and rolling bodies, which may lead to failure. The use of oil injection lubrication could effectively improve the bearing lubrication status. Using computational fluid dynamics (CFD) and experimental testing methods, many scholars have investigated the effects of various oil-jet parameters and operating conditions on oil and temperature field distributions.
Pinel et al.1–3 conducted parametric tests on angular contact ball bearings using a high-speed, high-temperature test rig. Their comparison of oil mist and oil jet lubrication showed that oil jet lubrication yielded lower bearing temperatures. Farrall et al.4,5 developed a two-phase numerical model to predict air-oil droplet behavior in oil jet lubricated bearing cavities, demonstrating that initial droplet size distribution significantly affects oil deposition patterns. Adeniyi et al. 6 employed CFD to analyze oil-air flow between aero-engine bearing cages and inner rings, investigating lubricant distribution characteristics and their impact on performance, thus providing theoretical guidance for bearing design optimization. Feldermann et al. 7 established a CFD model for cylindrical roller bearings incorporating adjacent structural effects on flow fields. Their analysis revealed that approximately two-thirds of power losses occur at rolling elements, with the inner raceway accounting for the remaining one-third. Peterson et al. 8 combined CFD and experiments to investigate fluid drag losses in lubricated rolling bearings, evaluating the effects of lubricant properties, rotational speed, and geometric parameters. Kruisbrink et al. 9 through a series of experiments and analyses, the impact of splash characteristics on lubricant capture was investigated, revealing a close correlation between skimming efficiency and the splash criterion. Aidarinis et al. 10 investigated oil-jet lubrication in aero-engine bearing chambers using CFD and LDA measurements, quantifying the effects of key parameters including air and oil mass flow rates and shaft speed. Bossmanns and Tu 11 developed a finite-difference thermal model for high-speed spindles, analyzing thermal effects of speed, preload, and lubrication with experimental validation. Kim et al. 12 calculated the bearing frictional torque and performed thermal analysis using the finite element method (FEM). Experimental measurements of both frictional torque and bearing temperature were conducted, with the temperature results compared against simulation data to validate the effectiveness of the FEM approach. Takabi and Khonsari 13 built a thermal network model for deep-groove ball bearings including housing and spindle to predict transient temperature distributions, validating its accuracy experimentally while analyzing the effects of radial load, speed, and lubricant viscosity. Kerrouche et al. 14 integrated Harris’ friction theory with SKF’s power loss model to analyze cylindrical roller bearing losses in aero-engines, developing an Ohm’s law-based thermal network for temperature prediction. Yan et al. 15 established a five-degree-of-freedom dynamic model for rolling bearings with local defects based on isothermal elastohydrodynamic lubrication (EHL) theory. The variations in oil film stiffness, comprehensive stiffness, and vibration characteristics of the rolling bearings under different rotational speeds and loads were investigated. Kang et al. 16 analyzed the consequences of slip phenomena among internal components by considering the interaction forces between the raceway and rolling elements, as well as the cage, under EHL conditions. Gao et al. 17 introduced the sliding friction force acting on the rolling elements under EHL into a multi-fault dynamic model of the bearing. The effects of the angle between local defects and the number of local defects on the vibration response characteristics were examined. Li et al. 18 incorporated the influences of friction, centrifugal force, and oil film traction force in the bearing model. The study focused on whether damage size and rotational speed affect the vibration characteristics of the bearing. Wen et al. 19 developed a multi-degree-of-freedom dynamic model for bearings with local defects. The impact of lubrication and dry friction conditions on collisions between rolling elements and the cage was analyzed, along with whether the lubricant traction force is affected when rolling elements pass over local defects.
In summary, existing research on oil-jet lubrication for rolling bearings has primarily focused on individual bearing systems, while comparative studies on bearing lubrication characteristics in tester systems remain limited. Therefore, focusing on cylindrical roller bearings, this study conducts a comparative investigation of lubrication performance between the single bearing system and the tester system. The differences in lubrication characteristics between the two systems are analyzed to provide a theoretical basis for the optimized design of rolling bearings.
The analysis of flow and temperature fields in single bearing system
Theory of computational fluid dynamics
The computational fluid dynamics (CFD) method is predicated on the utilization of the continuity, momentum and energy equations in order to establish a correlation between field variables at discrete points. The approximation of these variables is achieved through the process of iteration. In the context of a lubricating flow field under a ring of a rolling bearing, the fluid flow problem is governed by the laws of conservation of mass, momentum, and energy. These conservation laws can be expressed in the form of a system of partial differential equations, and the continuity, momentum, and energy equations of the fluid are derived by discretization.
Continuity equation
Based on the law of mass conservation, the following partial differential equation governing fluid flow continuity is derived:

Where ρ is the fluid density, t denotes time, u, v, and w are the velocity components of the fluid in the x, y, and z directions, respectively.
Momentum conservation equations
Based on the law of conservation of momentum, the governing equations for momentum conservation of a fluid element in the x, y, and z directions are expressed as follows:

Where p is the pressure acting per unit fluid volume;
Energy conservation equation
When heat transfer is involved in fluid flow processes, the law of energy conservation is generally obeyed. The total energy within the fluid is equal to the sum of its internal energy, kinetic energy, and potential energy. Accordingly, the following equation is derived based on the energy conservation principle:

Where
Modeling of lubrication in single bearing system
This section focuses on cylindrical roller bearings in single bearing systems. The 3D lubrication model and corresponding parameters are presented in Figure 1(a) and Table 1, respectively. The bearing inner ring features eight uniformly distributed oil supply holes of 2 mm diameter.

Cylindrical roller bearing fluid-solid composite heat transfer modeling: (a) Three-dimensional model and (b) Solid and fluid domains.
Structural parameters of cylindrical roller bearing.

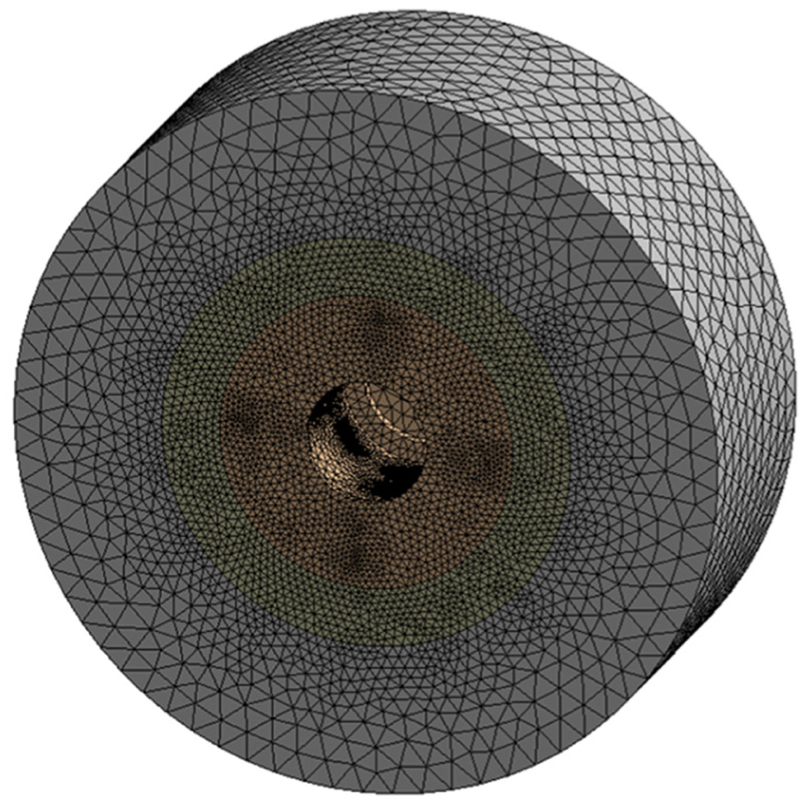
To investigate the flow and temperature fields distribution characteristics, a simulation model for bearing lubrication analysis is established as shown in Figure 1(b).
The lubrication simulation model is imported into the Mesh module of ANSYS software for mesh generation. Tetrahedral meshing of the solid and fluid domains is performed using the mesh skewness as the mesh quality assessment criterion. Based on the aforementioned configuration, the model is divided into a mesh model with an average skewness of 0.25 and maximum skewness of 0.78. The final mesh count is 3.99 million with 0.84399 million nodes.
Calculation of bearing heat generation in single bearing system
Based on Palmgren Jones’ method, 20 this section performs heat generation calculations for cylindrical roller bearings. The calculation of Palmgren Jones’ method of heat generation encompasses both load-independent frictional moments and frictional moments induced by the bearing loads, viz:

where M0 is the friction moment related to bearing speed, type, and lubricant characteristic parameters (N mm), M1 is the friction moment caused by bearing load (N mm).
The frictional torque of cylindrical roller bearings is the primary cause of internal heat generation. The amount of heat generated per unit time due to friction is given by the following formula:

where Q is the heat generation rate of the bearing (kW), M is the total frictional torque (Nm), and n is the rotational speed of the inner ring (r/min).
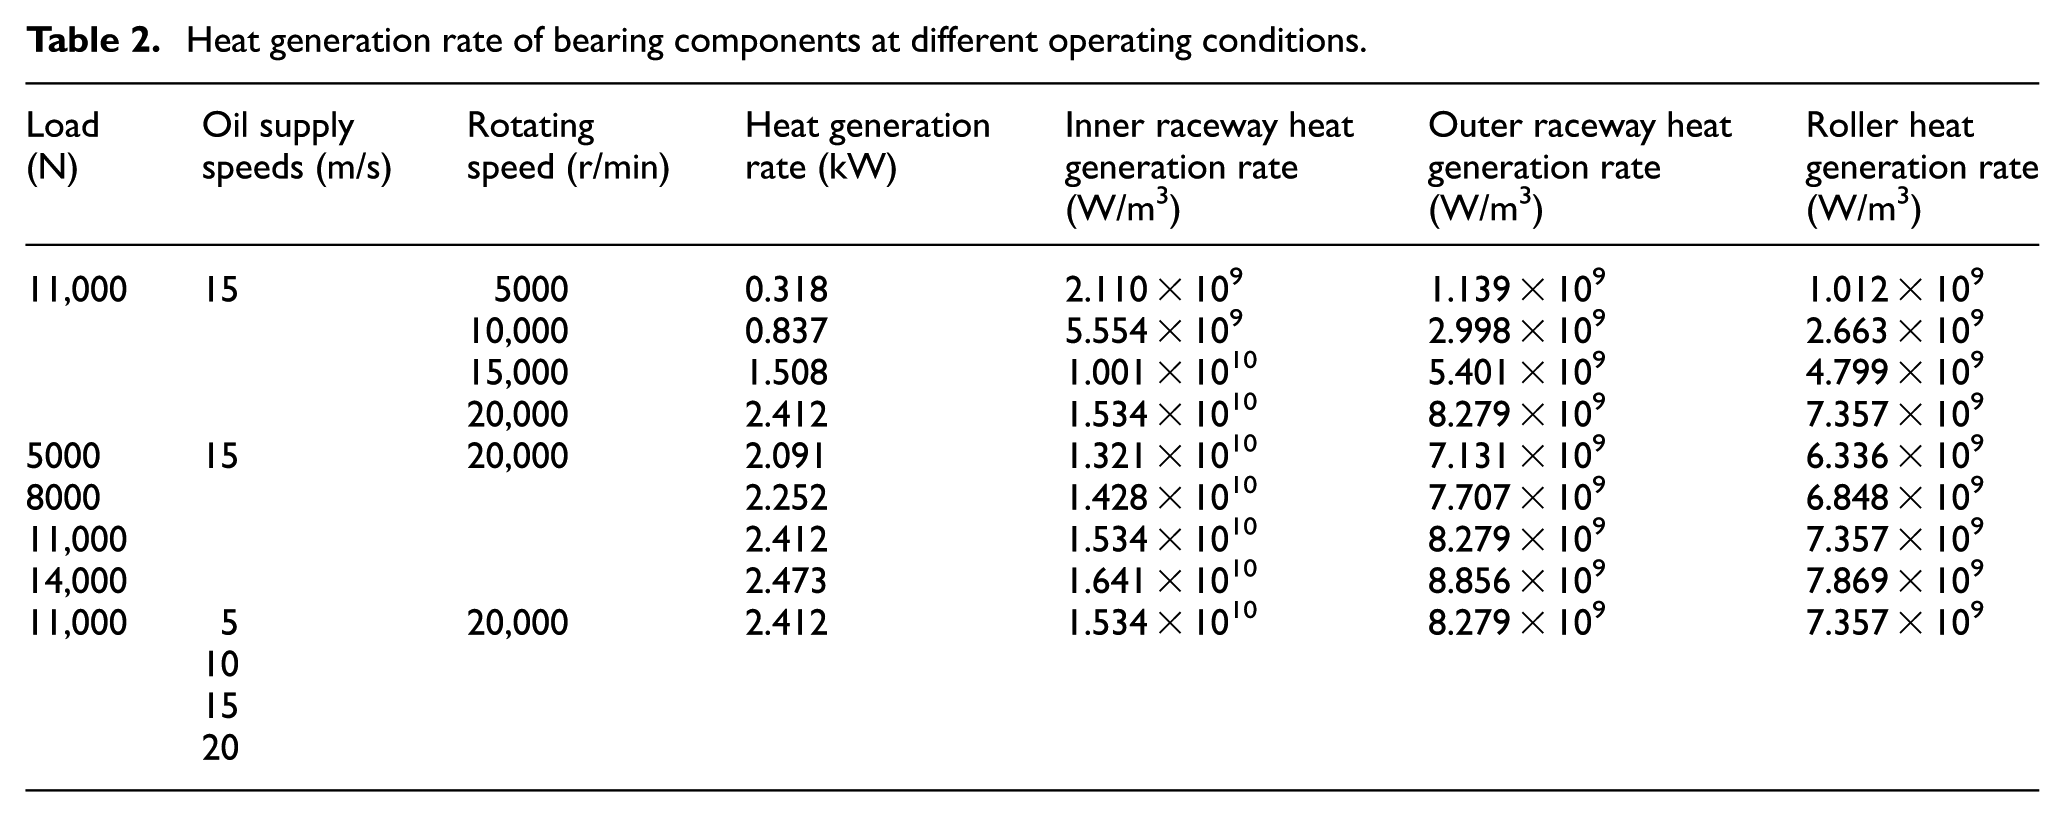
The heat generation quantities of various components in the cylindrical roller bearing under different operating conditions are summarized in Table 2.
Heat generation rate of bearing components at different operating conditions.
Boundary conditions in single bearing system
The two-phase flow model in ANSYS FLUENT software is employed for this lubrication simulation of cylindrical roller bearings in a single bearing system. The two-phase flow primarily consists of two phases: air and oil. The material physical properties of these phases are delineated in Table 3 below.
Material properties of oil and gas two-phase fluids.

The simulation environment temperature for both the fluid domain and solid domain is set at 25 °C. The lubricating oil temperature is set at 70 °C. The oil phase volume fraction at the inlet is set to 1. Both end faces of the bearing are designated as outlets. The outlet pressure is set to standard atmospheric pressure. In the fluid simulation, the rollers are set to pure rolling motion. The orbital and spin speeds of the rollers are determined by the following kinematic equations:

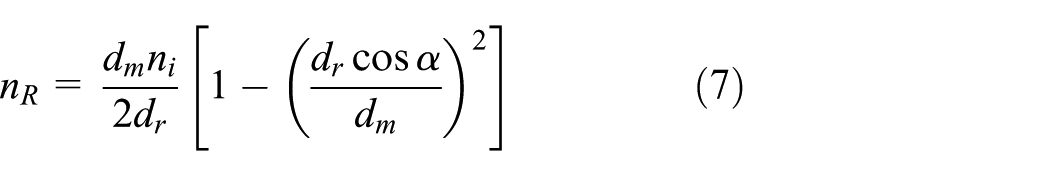
in which the roller orbital motion speed is denoted by n M , the roller spin speed by n R , the inner ring speed by n i , the roller diameter by d r , the contact angle by α, the bearing pitch diameter by d m .
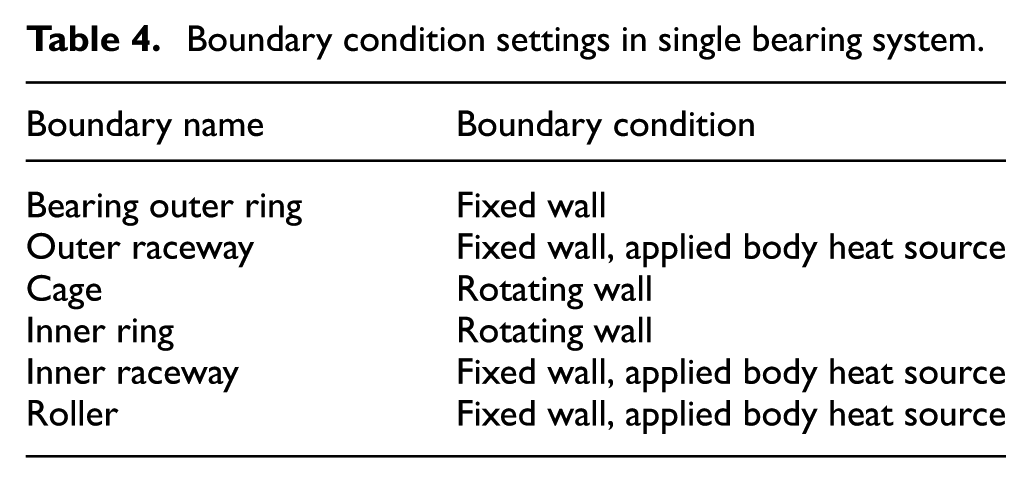
The fluid wall surfaces of rollers, inner ring, and cage are set for no-slip motion. Based on the principles of thermodynamics, the heat generated by a friction pair is equally distributed between the two contacting bodies, while heat naturally conducts to the adjacent objects on both sides. During bearing operation, two friction pairs exist between the rollers and the inner and outer rings. Consequently, for the thermal boundary condition setup, the rollers account for half of the total heat generation of the bearing, while the inner and outer rings each account for one quarter of the total heat. 20 The outer wall surface of the bearing housing is set to natural convection with air. The convective heat transfer coefficient is set to 50 W/(m2 K). The other boundary conditions are shown in Table 4 below.
Boundary condition settings in single bearing system.
Effect of oil supply speeds on the flow and temperature fields in single bearing system
This section presents simulations conducted at four distinct oil supply speeds: 5, 10, 15, and 20 m/s. The bearing rotational speed is set to 20,000 rpm. The radial load is set to 11,000 N. The lubricant distribution within the bearing fluid domain is presented in Figure 2.

Distribution of the bearing flow field under different oil supply speeds: (a) 10m/s, (b) 15m/s, (c) 20m/s, and (d) 20m/s.
As demonstrated in Figure 2, increasing the oil supply speed leads to gradually increasing of oil volume fraction. Concurrently, the oil distribution at the outlet boundary of the fluid domain becomes more pronounced. The oil on the bearing inner ring gradually increases, while uneven oil film distribution emerges along the outer ring raceway. This phenomenon occurs due to centrifugal force, which causing the lubricating oil is thrown from the inner ring to the outer ring. The effect becomes gradually more pronounced with increasing oil supply speeds.
To analyze the effects of oil supply speed on the bearing lubrication flow field, the oil volume fraction at different circumferential positions and the average oil volume fraction within the bearing are extracted. As illustrated in Figures 3 and 4, the oil supply holes are positioned at 90°, 180°, 270° and 360° circumferential locations of the bearing. The maximum of the oil volume fraction is observed in the downstream region of the oil supply holes. The circumferential oil distribution exhibits periodic variation characteristics. As the oil supply speed increases from 5 to 20 m/s, the average oil volume fraction increases from 0.002794 to 0.016026. The average oil volume fraction exhibits a trend of initial slow increase followed by a rapid rise.

Circumferential distribution of oil volume fraction in the bearing under different oil supply speeds.

Average oil volume fraction inside the bearing under different oil supply speeds.
In order to analyze the lubrication and cooling effects, the temperature field changes under different oil supply speeds are analyzed. The temperature field distribution of the inner and outer rings is shown in Figure 5. As demonstrated in Figure 5, the average temperature of the inner ring is higher than that of the outer ring. The phenomenon can be attributed to the influence of centrifugal force on the oil, resulting in a higher volume fraction in the outer raceway compared to the inner raceway. Furthermore, as the oil supply speed increases from 5 to 20 m/s, the maximum temperature of the bearing decreases from 409.72 K (136.57 °C) to 370.61 K (97.46 °C), representing a 9.5% decline. This phenomenon occurs because the increased lubricant influx enhances convective heat transfer at the bearing walls, resulting in greater thermal energy dissipation.

Temperature field distribution of bearing inner and outer rings under different oil supply speeds: (a) 10m/s, (b) 15m/s, (c) 20m/s, and (d) 20m/s.
Effect of rotational speeds on the flow and temperature fields in single bearing system
This section presents simulations conducted at four distinct rotational speeds: 5000, 10,000, 15,000, and 20,000 r/min. Bearing oil supply speed is set to 15 m/s. Radial load is set to 11,000 N. The lubricant distribution within the bearing fluid domain is presented in Figure 6.

Distribution of the bearing flow field under different rotational speeds: (a) 5000r/min, (b) 10000r/min, (c) 15000r/min, and (d) 20000r/min.
As demonstrated in Figure 6, the rotational speed exhibits significant influence on the bearing flow field distribution characteristics. At lower rotational speeds, smaller centrifugal forces lead to decreased lubricant loss. Consequently, the majority of the oil is able to pass through the rollers and pocket clearances to the outer ring raceway. However, as rotational speed increases, the intensity of the collision between cage and rollers also increases, leading to a substantial increase in splash loss of oil. Consequently, the amount of oil on the outer raceway of the bearing is significantly reduced, resulting in a decrease in the oil volume fraction.
The oil volume fraction at different circumferential positions and the average oil volume fraction within the bearing are extracted, as shown in Figures 7 and 8. As demonstrated in Figure 7, the peak oil volume fraction occurs at the oil supply hole and its downstream region. As the rotational speed of the bearing increases to 20,000 r/min, the peak of the oil volume fraction shifts towards the oil supply hole. As demonstrated in Figure 8, the impact of rotational speed on the average oil volume fraction is pronounced. With an increase in rotational speed from 5000 to 20,000 r/min, the mean oil volume fraction declines from 0.0667734 to 0.00911367 and its decreasing law shows a non-linear trend. As the rotational speed increases from 5000 to 10,000 r/min, the average oil volume fraction decreases sharply and the decrease slows down as the rotational speed continues to increase.

Circumferential distribution of oil volume fraction in the bearing flow field under different rotational speeds.

Average oil volume fraction of the bearing under different rotational speeds.
As demonstrated in Figure 9, the rotational speed has an important influence on the bearing temperature field distribution. It is evident that increasing the bearing rotation speed results in a significant temperature rise. Furthermore, the temperature of the inner raceway exceeds that of the outer raceway. As the bearing speed increases from 5000 to 20,000 rpm, the bearing temperature rises from 346.43 to 383.80 K, marking an increase of 10.8%. For every 5000 rpm speed increment, the maximum temperature of both inner and outer rings increases by an average of 12.46 K. When the rotational speed increases from 5000 to 15,000 rpm, the temperature exhibits an approximately linear growth trend. With further increase in rotational speed, the temperature rise demonstrates an accelerated increasing rate. Because with the increase of rotational speed, the centrifugal force causes lubricating oil to be more readily thrown, thereby weakening the bearing’s cooling effectiveness.

Temperature field distribution of the bearing inner and outer rings under different rotational speeds: (a) 5000r/min, (b) 10000r/min, (c) 15000r/min, and (d) 20000r/min.
Effect of radial load on the flow and temperature fields in single bearing system
In order to study the effect of radial load on flow field and cooling effect. The bearing speed is set to 20,000 rpm, the oil supply speed is set to 15 m/s and the radial loads are selected to be 5000, 8000, 11,000, and 14,000 N. The distribution of the flow field under different loads is shown in Figure 10.

Distribution of the bearing flow field under different radial loads: (a) 5000N, (b) 8000N, (c) 11000N, and (d) 14000N.
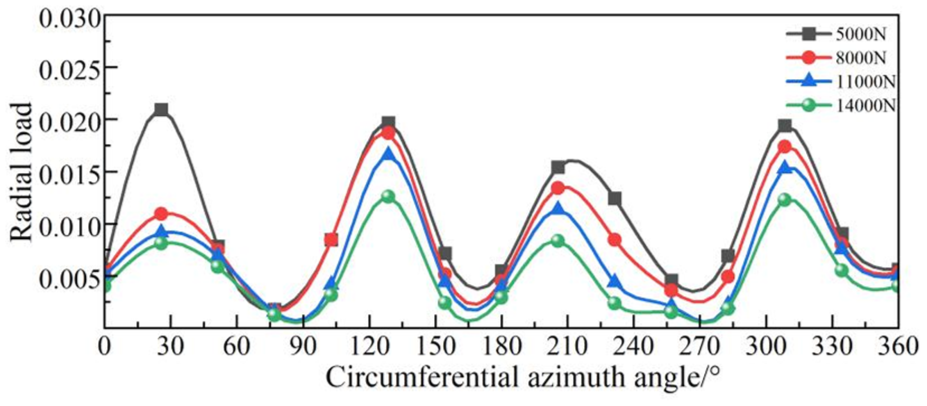
As demonstrated by Figure 10, with an increase in radial load, the flow field distribution law of the bearing exhibits similarity. The effect of different radial loads on the oil volume fraction is comparatively smaller.
From Figure 11, it can be seen that the circumferential distribution of the volume fraction of oil shows a certain periodic trend. With the increase of radial load, the oil volume fraction gradually decreases and different circumferential azimuths of the oil volume fraction change rule is basically the same. As demonstrated by Figure 12, with the radial load from 5000 N increased to 14,000 N, the internal average oil volume fraction from 0.01002 reduced to 0.00507, which presents downward trend of approximately linearly linear relationship.
Circumferential distribution of oil volume fraction in the bearing flow field under different radial loads.
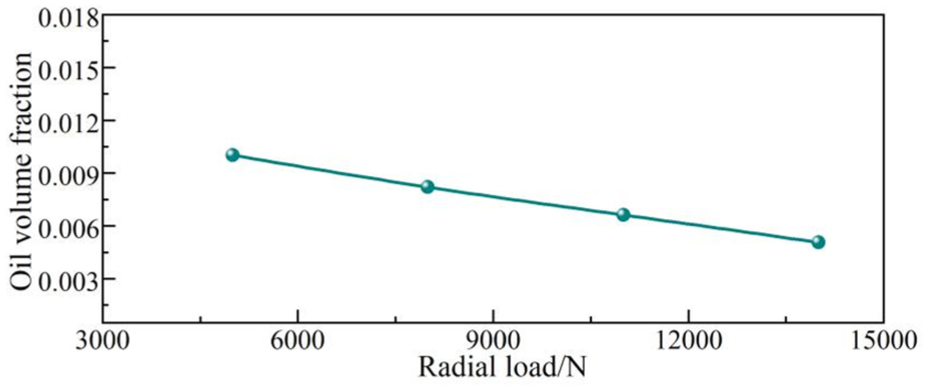
Average oil volume fraction inside the bearing under different radial loads.
As demonstrated in Figure 13, increasing radial load induces significant increase in the bearing temperature. This rise is particularly evident in the inner ring. As the radial load increases from 5000 to 14,000 N, the bearing temperature increases from 369.53 to 401.79 K, representing an 8.7% rise. Furthermore, for every 3000 n increase in load, the average temperature increases 10.7 K. The phenomenon occurs because increased load elevates heat generation in the bearing, resulting in higher bearing temperatures. Concurrently, the rising temperature reduces oil viscosity, facilitating its expulsion from the bearing cavity and consequently leading to a decreasing trend in the average oil volume fraction.

Temperature field distribution of the bearing inner and outer rings under different radial loads: (a) 5000N, (b) 8000N, (c) 11000N, and (d) 14000N.
The analysis of flow and temperature fields in tester system
Modeling of lubrication in tester system
This section investigates the lubrication performance of cylindrical roller bearings in tester systems. The structural configuration of the bearing tester is illustrated in Figure 14.

Cross-sectional view of the lubrication system in the bearing tester.
The three-dimensional models of solid and fluid domains are presented in Figure 15. The bearing inner ring incorporates eight oil supply holes of 2 mm diameter. The structural parameters of the cylindrical roller bearing are provided in Table 1, while the thermophysical property parameters of the bearing tester components are detailed in Table 5.

Fluid-solid coupled heat transfer simulation model under bearing tester system environment: (a) Solid domain and (b) Fluid domain.
Thermophysical property parameters of bearing tester components.

Meshing in tester system
The simulation model was imported into ANSYS Mesh for grid generation, with skewness adopted as the mesh quality criterion (maximum skewness: 0.77, average skewness: 0.25). Tetrahedral elements are employed throughout the domain, with localized refinement applied to critical regions including rollers, balls, raceways, and sub-ring oil supply holes. The final mesh comprises 8.7717 million elements, illustrated in Figure 16.
Schematic diagram of mesh refinement at the mid-cross section of the simulation model.
Boundary conditions in tester system
Similar to the single bearing system, the following boundary conditions are implemented. The simulation environment temperature is set at 25 °C. The lubricating oil temperature is set at 70 °C. The physical parameters are shown in Table 3. The outer end faces of both bearings function as fluid outlets. By employing the multiple reference system (MRF) method, the fluid domain is subdivided into two stationary domains and four rotating domains, in which their orbital motion and spin velocities were determined by equations (6) and (7).
The heat generation capacity of cylindrical roller bearings and three-point contact ball bearings is obtained in Section 2.2. Subsequently, the calculated heat generation power of cylindrical roller bearings and three-point contact ball bearings is distributed as heat generation rates among the inner ring, rollers, and outer ring in a 1:2:1 ratio. The outer wall surface of the bearing housing is set to natural convection with air. The convective heat transfer coefficient is set to 50 W/(m2 K). With regard to the motion boundary condition settings, as illustrated in Table 6 below.
Simulation boundary settings for the bearing tester system.

For the bearing tester system, simulation analyses were conducted for different operating conditions. Due to the structure of tester system, the radial load applied to the tester is twice that of the test cylindrical bearing. The configuration of the simulation condition is delineated in Table 7 below.
Simulation condition settings for lubrication in the bearing tester.
Effect of oil supply speeds on the flow and temperature fields in tester system
In order to study the influence of oil supply speed on the flow and temperature fields in the tester system, the oil supply speed is selected as 5, 10, 15, and 20 m/s. The bearing rotational speed is set to 20,000 rpm with an applied radial load of 11,000 N. The lubricant distribution patterns within the bearing fluid domain are presented in Figure 17.
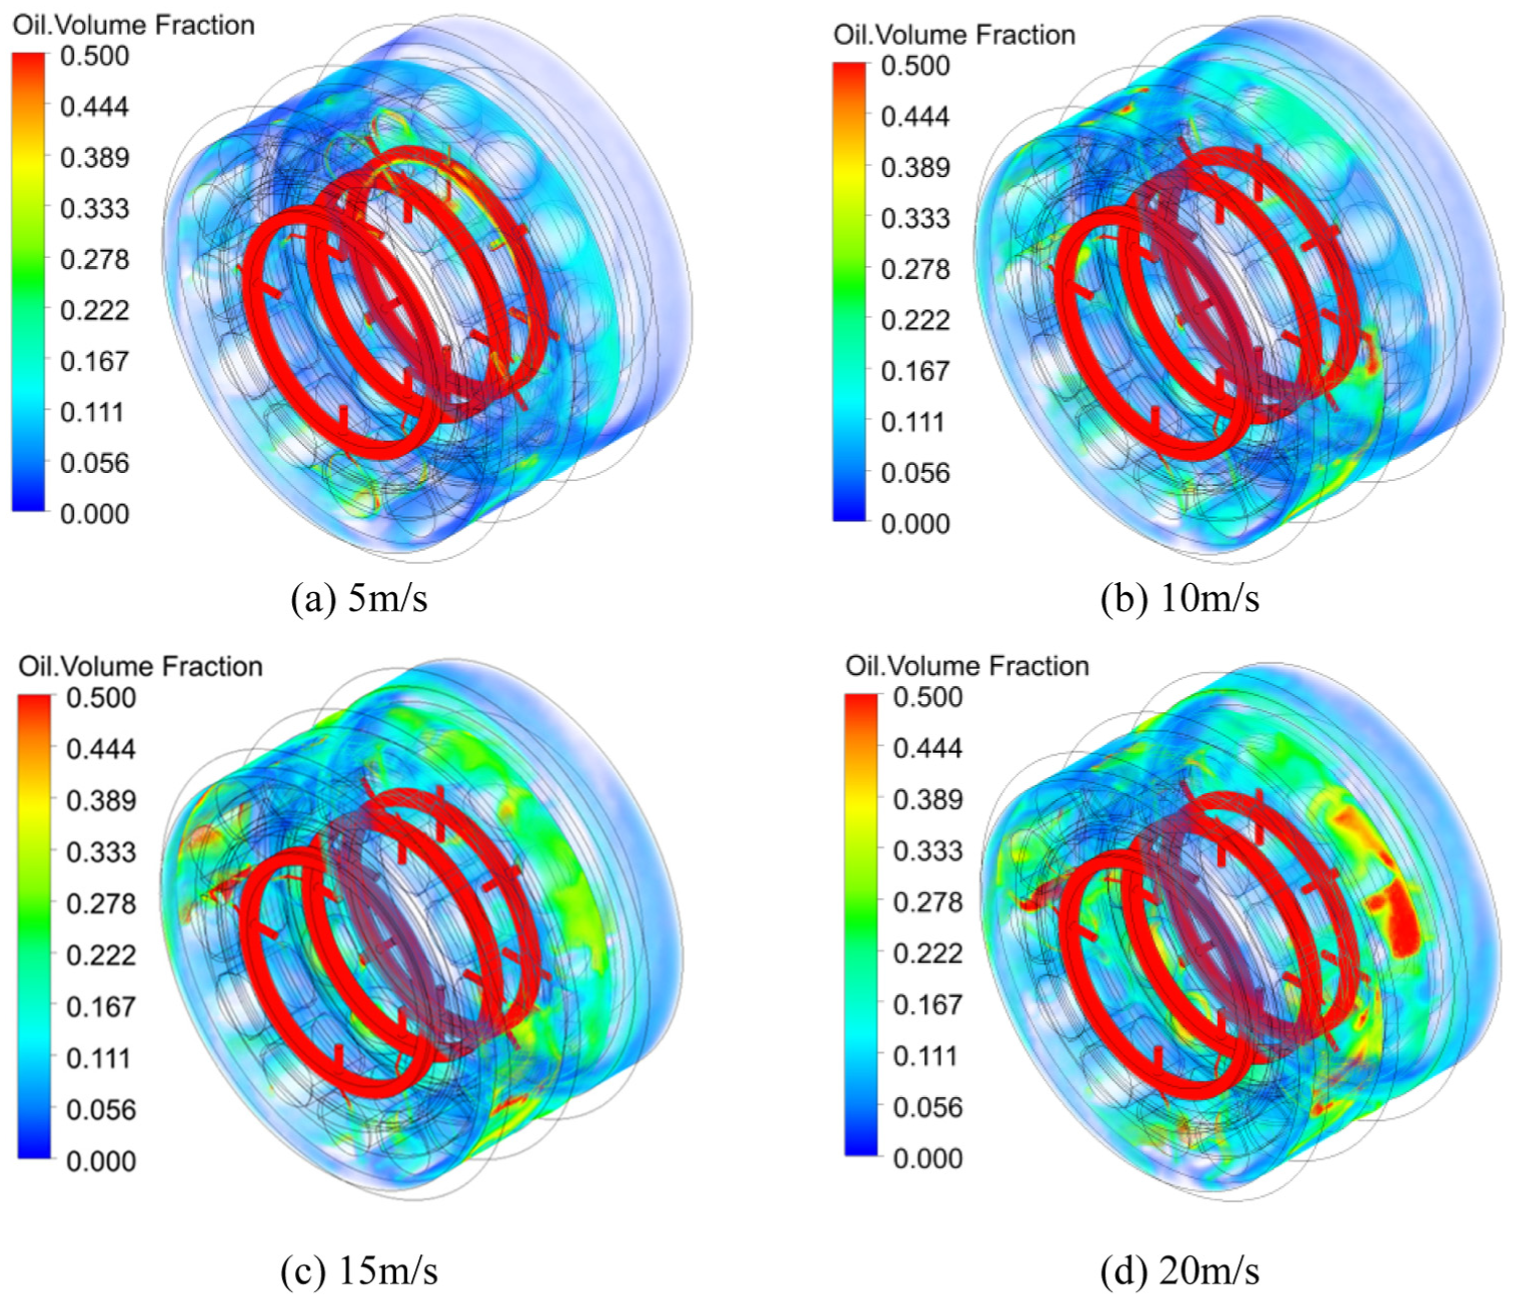
Distribution of the bearing flow field under different oil supply speeds: (a) 10m/s, (b) 15m/s, (c) 20m/s, and (d) 20m/s.
As demonstrated in Figure 17, with an increase in the oil supply speed, lubricant distribution on the outer raceway of the roller bearing and the ball bearing is relative increase. Concurrently, the volume fraction of the oil in the cylindrical roller bearing increases gradually. Oil volume fraction of the roller bearing is consistently smaller than that of the ball bearing throughout this process. This is because the raceway structure of ball bearings has better oil storage capacity.
To analyze the effects of varying oil supply velocities on the flow field, the oil volume fraction at different circumferential positions and average oil volume fraction are extracted, as illustrated in Figures 18 and 19. The oil volume fraction exhibits symmetrical distribution about the central axis under different oil supply speeds. As the oil supply speed increases, the oil volume fraction in each part of the cylindrical roller bearing increases. As evidenced by Figure 19, both cylindrical roller bearings and three point contact ball bearings exhibit linearly increasing trends in average oil volume fraction. The average oil volume fraction of cylindrical roller bearings increases from 0.03484 to 0.08415, representing a 1.42-fold increase.

Circumferential distribution of oil volume fraction in bearing under different oil supply speeds.
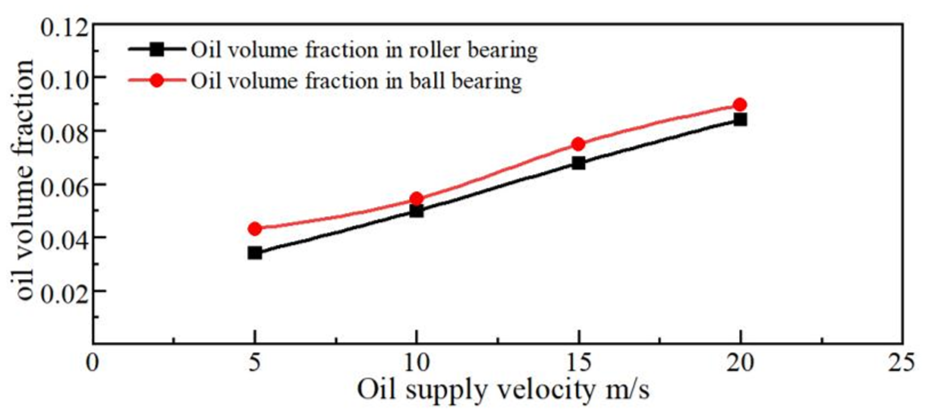
Average oil volume fraction inside roller bearing and ball bearing under different oil supply speeds.
Figure 20 presents the temperature distributions on the inner and outer rings of the two bearings under varying oil supply speeds in the tester system. The maximum temperature is predominantly concentrated within the inner and outer raceways. The temperature on the inner raceway is higher than that on the outer raceway. Concurrently, due to the influence of the three point contact ball bearing, the maximum temperature zone of the roller bearing occurs in the intermediate region between the two bearings. Furthermore, increasing oil supply speed leads to a gradual reduction in the overall temperature of the two bearings. When the oil supply speed increases from 5 to 20 m/s, the temperature of the bearings is reduced from 455.6 to 409.9 K, representing a 10% decrease.

Temperature distribution of cylindrical roller bearing and ball bearing under different oil supply speeds: (a) 10m/s, (b) 15m/s, (c) 20m/s, and (d) 20m/s.
Effect of rotational speeds on the flow and temperature fields in tester system
To investigate the influence of rotational speeds on the flow field and temperature field of cylindrical roller bearings in the tester system, lubrication simulations are conducted for conditions 3, 5, 6, and 7 in Table 7.
As demonstrated in Figure 21, at a rotational speed of 5000 r/min, the volume fraction of oil within the fluid domain is higher. As the speed increases from 5000 to 20,000 r/min, the volume fraction of oil within the fluid domain decreases gradually. At a speed of 20,000 r/min, the volume fraction decreases sharply. Furthermore, it is evident that as the rotational speed increases, the oil is predominantly distributed in the outer rings.

Distribution of the bearing flow field under different rotational speeds: (a) 5000r/min, (b) 10000r/min, (c) 15000r/min, and (d) 20000r/min.
The oil volume fraction at different circumferential positions and average oil volume fraction are extracted, as illustrated in Figures 22 and 23. As evident from Figure 22, the oil distribution within the bearing exhibits similar rules across different rotational speeds. As the speed increased from 5000 to 20,000 rpm, the circumferential oil volume fraction gradually decreased and its distribution became more uniform. As rotational speed increases from 5000 to 10,000 rpm, the oil volume fraction remains higher near oil supply holes. However, when speed rises further from 15,000 to 20,000 rpm, the oil volume fraction decreases near the 180° oil supply holes. This is because at higher rotational speeds, the increased centrifugal force on the oil overcomes gravitational effects, consequently reducing the oil volume fraction near the oil supply holes at the bottom position of bearing.

Circumferential distribution of oil volume fraction in bearing at different rotational speeds.
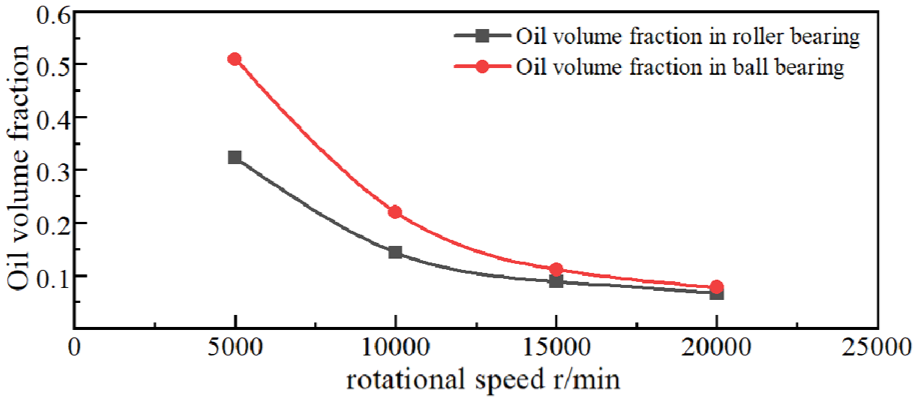
Average oil volume fraction in roller and ball bearings at different rotational speeds.
Figure 23 presents the influence of different rotational speeds on the average oil volume fraction in the tester system. As demonstrated in Figure 23, the average oil volume fraction in cylindrical roller bearings exhibits an accelerating decreasing trend with increasing rotational speed. This is because outer raceway of the cylindrical roller bearing has no flanges, resulting in a reduced oil storage capacity compared to ball bearings. Consequently, the internal average liquid integral number is lower than that of ball bearings.
As demonstrated in Figure 24, increasing rotational speed significantly impacts the temperature distribution of the two bearings. With the increase in rotational speed from 5000 to 20,000 rpm, the temperature of the two bearings increases gradually. The maximum temperature increases from 352 to 427.1 K, with an increase of 21.3%. Furthermore, the temperature distribution on outer rings gradually transitions from a point-like distribution to a band-like distribution.
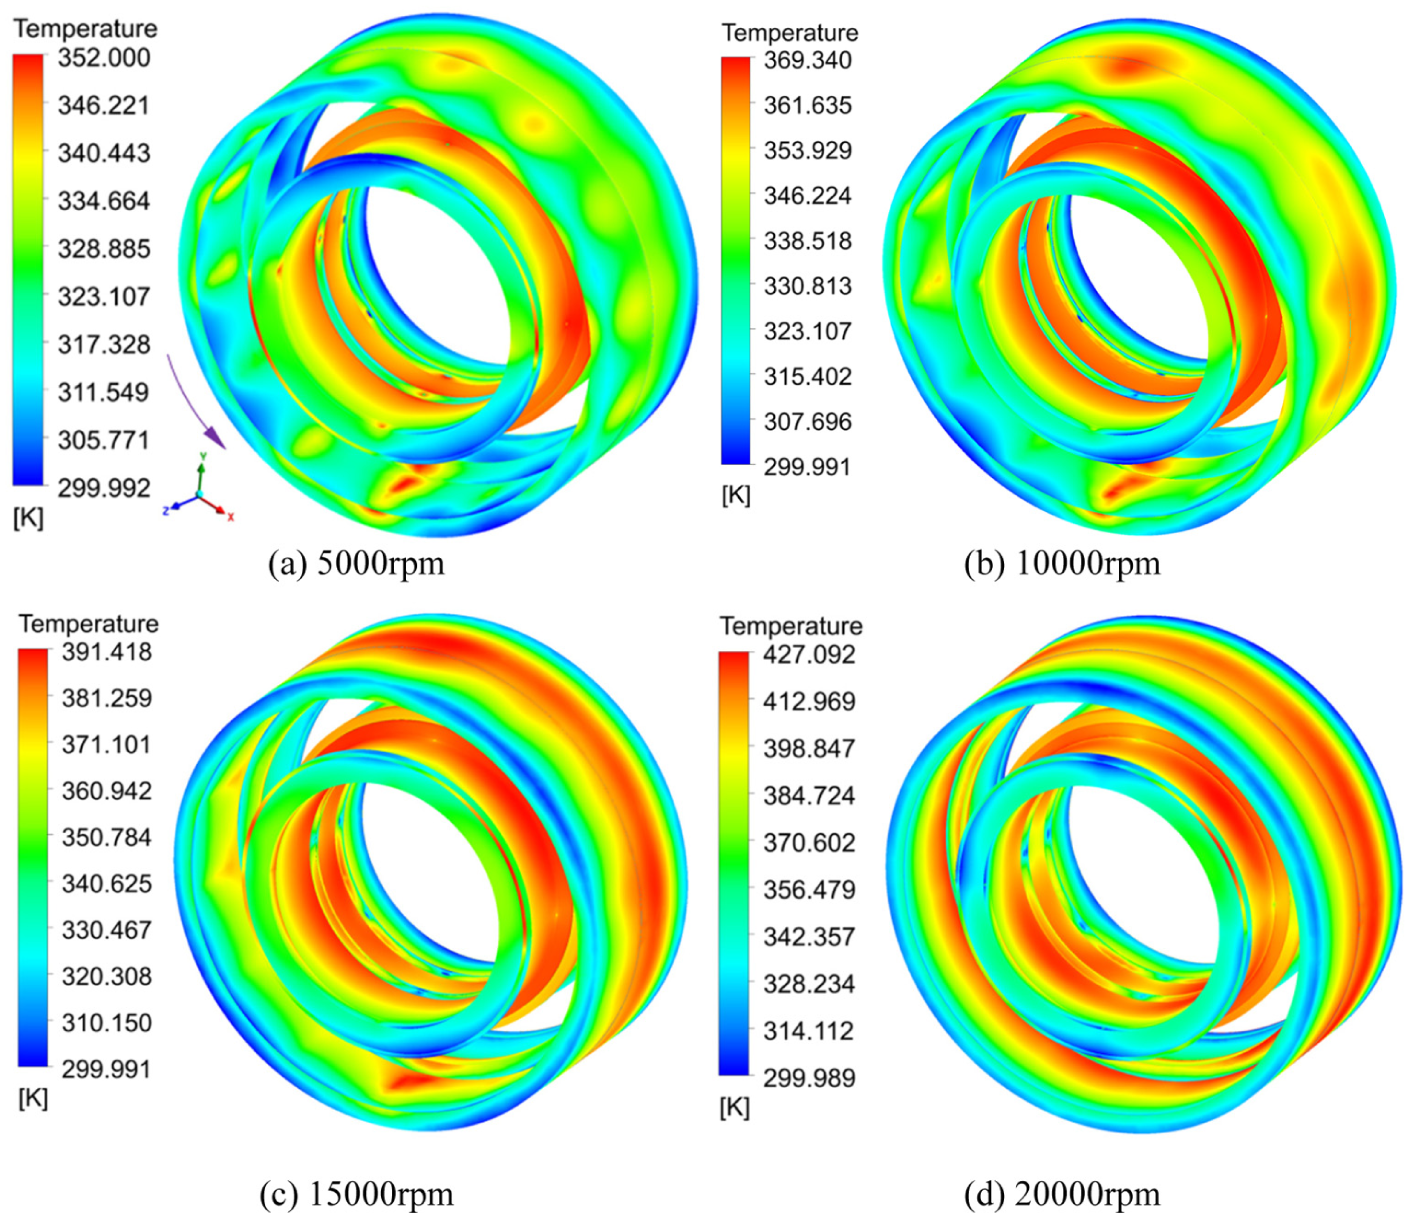
Temperature distribution of cylindrical roller and ball bearings at different rotational speedss: (a) 5000r/min, (b) 10000r/min, (c) 15000r/min, and (d) 20000r/min.
Effect of radial load on the flow and temperature fields in tester system
The study selects working conditions 3, 8, 9, and 10 in Table 7 to investigate the influence of radial load on flow and temperature fields in the tester system. As demonstrated in Figure 25, with an increase in the radial load, there is a similarity in the distribution of the flow field. Furthermore, the difference in the volume fraction of the oil within the bearing is smaller.

Distribution of the bearing flow field under different radial loads in the tester system: (a) 5000N, (b) 8000N, (c) 11000N, and (d) 14000N.
The circumferential variation of lubricating oil volume fraction within the cylindrical roller bearing under different radial loads in the tester system is extracted and presented in Figure 26. The oil distribution within the bearing exhibits similar rules across different radial loads. Furthermore, an increase in radial load results in a reduction of the oil volume fraction in the circumferential direction. This phenomenon can be attributed to the rise in radial load, leading to an increase in the bearing temperature, thereby reducing the viscosity of the lubricant and the lubricant’s adhesion to the wall.

Circumferential distribution of oil volume fraction in bearing at different radial loads.
Figure 27 presents the influence of different radial loads on the average oil volume fraction in the tester system. With an increase in radial load, the average oil volume fraction of the two bearings decreases. The average oil volume fraction of the cylindrical roller bearing exhibits a linear decrease. Concurrently, the average oil volume fraction in the internal flow field of three point contact ball bearings exceed that of cylindrical roller bearings. This discrepancy can be attributed to the layout characteristics of the internal oil supply holes of the two bearings and structural differences between the two bearings.
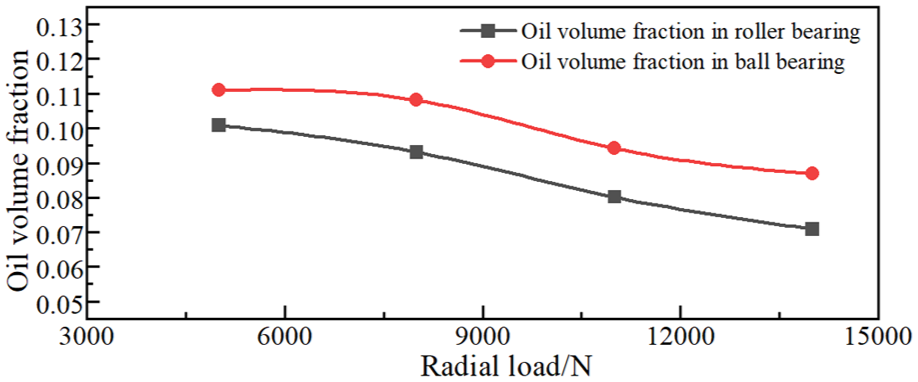
Average oil volume fraction in roller and ball bearings at different radial loads.
As illustrated by Figure 28, radial load significantly influences the temperature distribution. With the radial load increase from 10,000 to 28,000 N, the maximum temperature of the cylindrical roller and ball bearings rises from 378 to 449 K, marking an increase of 71 and 18 K, respectively. The overall temperature rise exhibits an accelerating trend, with an increase of 7%.
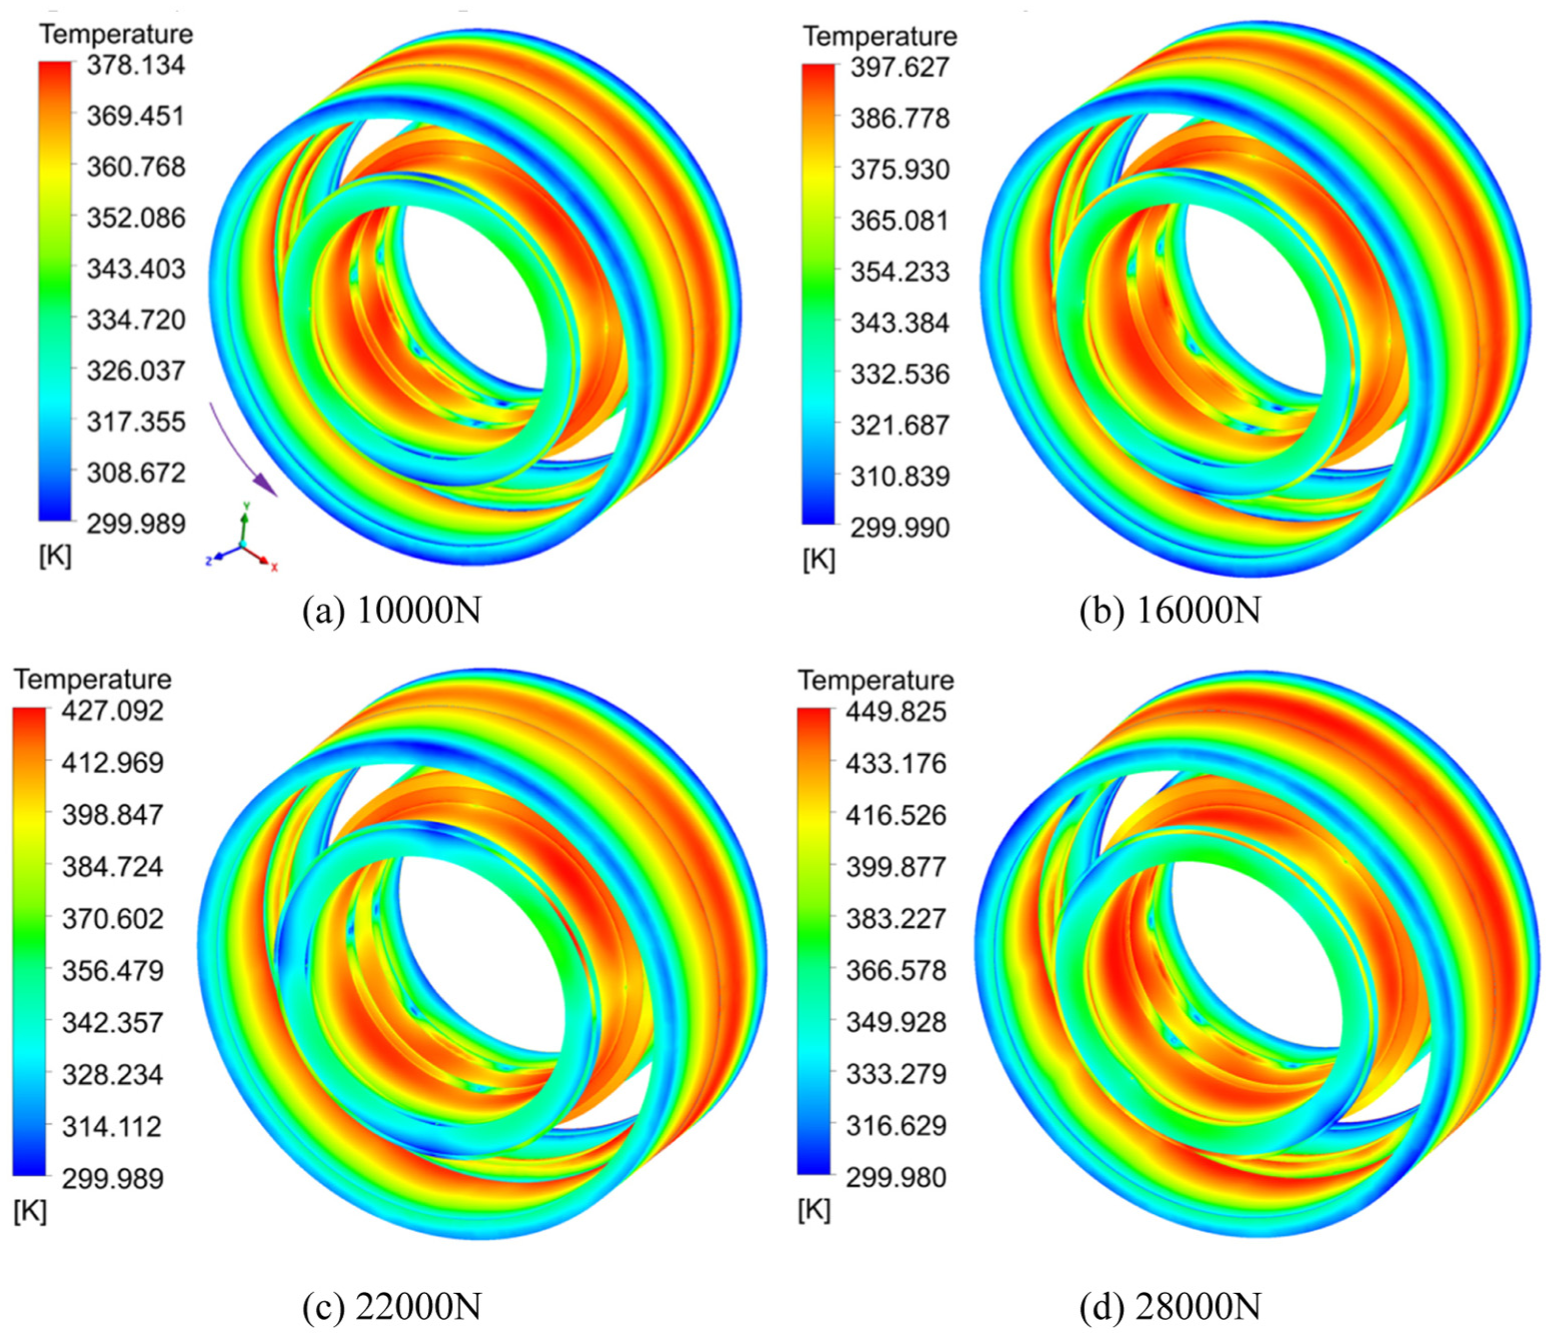
Temperature distribution of cylindrical roller and ball bearings at different radial loads: (a) 5000N, (b) 8000N, (c) 11000N, and (d) 14000N.
Test analysis under bearing tester system
In this section, the test analysis under the bearing tester system is considered. The cylindrical roller bearing temperature test is conducted using the multi-bearing tester system. The oil supply method employs sub-ring lubrication, with an oil supply temperature of 70 °C, a test ambient temperature of 25 °C, and an oil supply volume of 2.35 L/min. The sensor is employed to measure the temperature of the outer ring wall surface of the cylindrical roller bearings, as illustrated in Figure 29.

Layout positions of thermal resistance temperature sensors on the bearing tester.
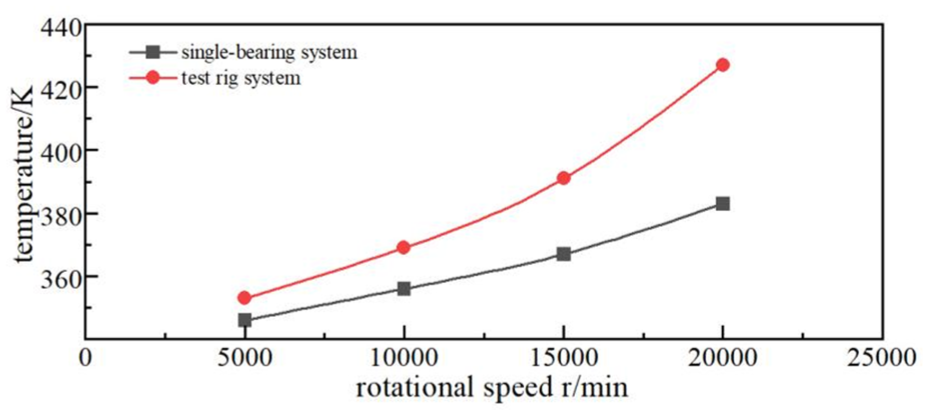
The test parameters are set with a spindle speed of 15,000 rpm, radial load of 22,000 N, and axial load of 11,000 N. Experimental temperature curves of the outer ring wall surface are shown in Figure 30. When the measured values stabilize, the bearing outer ring temperature reaches 120 °C. In the simulation, the stabilized temperature of the cylindrical roller bearing is 137 °C, demonstrating a 12.4% deviation between experimental and simulated values. As presented in Table 8, this comparative analysis validates the reliability of the temperature extraction methodology employed in our simulation approach.

Experimental temperature curves of the outer ring wall surface for cylindrical roller bearings.
Comparison between simulated and experimental bearing temperatures.

In this study, a certain deviation exists between the simulated and experimentally measured temperatures of the bearing outer ring. This discrepancy can be attributed to the settings of the convective heat transfer boundary condition and the thermal boundary conditions.
The convective heat transfer coefficient applied in the simulation model is determined based on empirical engineering values. Under actual operating conditions, the agitation of the lubricating oil by various bearing components leads to localized convective heat transfer capabilities that are higher than those defined in the simulation model. Consequently, the simulated system exhibits weaker heat dissipation compared to the actual scenario, resulting in an overestimation of the computed steady-state temperature. Furthermore, the simulation model allocated the total heat generation among the inner ring, rollers, and outer ring in a 1:2:1 ratio, with the heat uniformly applied to the components. Under actual operating conditions, heat generation in the bearing is predominantly concentrated in the Hertzian contact zones between the rollers and raceways. Consequently, the simulation somewhat overestimated the overall average temperature rise of the components, leading to higher calculated steady-state temperatures than those measured experimentally.
Comparative analysis of flow and temperature fields between single bearing system and tester system
Based on the flow field and temperature field results in both the single bearing system and tester system, this section focuses on cylindrical roller bearings as the primary research object. A comprehensive comparison of lubrication and cooling performance differences between the two systems is conducted from three key aspects: oil supply velocity, rotational speed, and radial load on cylindrical roller bearings.
Comparison results of flow and temperature fields at different oil supply speeds
Figures 3 and 18 demonstrate that under the single bearing system, the circumferential distribution of the oil shows a certain periodic fluctuation distribution law. While under the tester system, the circumferential distribution of the oil shows a certain symmetrical distribution state with the symmetry axis Y. With the increase in the oil supply speed, this distribution law becomes more and more obvious. Secondly, the volume fraction of oil inside the bearing under the tester system is higher than that in the single bearing system. This is mainly due to that the internal cavities of the two bearings together form a fluid domain. Therefore, the internal oil is more than that in the single bearing system.
Figure 31 shows the impact of oil supply speeds on the temperature of the inner and outer rings of bearings in the two systems. With the increase in the oil supply speed, the temperature of the cylindrical roller bearings within the single bearing system diminishes from 409.72 to 370.61 K, which is a decrease of 39.11 K, or 9.5%. The temperature of the cylindrical roller bearing in the tester system decreased from 454.60 to 409.96 K, a decrease of 44.64 K, or 10% and exhibits a linear decreasing trend. The temperature variation in the tester system is 1.16 times than that of the single bearing system. In both systems, there is gradual decrease in the temperature of the cylindrical roller bearing inner and outer rings. This phenomenon can be attributed to the increased oil supply speed, which results in a greater quantity of oil entering the bearing. Consequently, the increased oil volume fraction within the bearing enhances convective heat transfer capability.

Effect of different oil supply speeds on temperature of cylindrical roller bearing.
Comparison results of flow and temperature fields at different bearing speeds
Figures 7 and 22 demonstrate that the average lubricant volume fraction under the single bearing system is lower, particularly at higher rotational speeds. In contrast, the average oil volume fraction under the tester system is higher, particularly at 5000 and 10,000 r/min, where it is significantly higher than that in the single bearing system. Secondly, in the single bearing system, the oil volume fraction fluctuates significantly in the circumferential distribution. In contrast, in the tester system, the fluctuation of the oil volume fraction is comparatively small and the circumferential distribution is more uniform. Consequently, the lubrication performance is more stable in the tester system.
As illustrated in Figure 32, the effect of rotational speeds on the bearing temperature between the two systems is demonstrated. In the single bearing system, the bearing temperature gradually increases with rising rotational speed. The temperature rises from 346.43 to 383.8 K, representing an increase of 37.37 K, or 10.8%. Conversely, in the tester system, the temperature demonstrates a rapid rise with increasing rotational speed. At high speeds (15,000 and 20,000 rpm), there is a substantial increase in temperature from 352.89 to 427.09 K, amounting to an increase of 74.2 K, or 21%. This increase in temperature is significantly higher than that in the single bearing system. This discrepancy is attributed to differences in the lubrication structure of the two systems. Although the oil outlet position and convective heat transfer conditions in the test rig system are similar to those of the single-bearing system, the operation of the three-point contact ball bearing in the test rig significantly increases the total heat generation. Furthermore, the more complex geometry of the fluid domain in the tester system leads to flow blockage and uneven distribution of the oil, resulting in a portion of the oil failing to participate effectively in heat transfer. Finally, in the tester system, due to the influence of the three point contact ball bearing, the maximum temperature zone of the roller bearing occurs in the intermediate region between the two bearings.
Effect of different rotational speeds on temperature of cylindrical roller bearing.
Comparison results of flow and temperature fields under different radial loads
Figures 11 and 26 demonstrate that the circumferential distribution law of the oil volume fraction is analogous in both systems. In the single bearing system, with an increase in radial load, the lubricant volume fraction decreases gradually, reaching a peak value of ∼0.0224. Under heavy loads, the increased heat generation reduces oil viscosity, leading to non-uniform oil film distribution. In contrast, in the tester system, the lubricant distribution exhibits relatively uniformity, exhibiting superior lubrication performance compared to single bearing systems. With an increase in radial load, the lubricant volume fraction decreases in both systems. However, compared to the single bearing system, the decrease is smaller in tester system and the distribution of the oil is more homogeneous.
As demonstrated in Figure 33, the impact of varying radial loads on the temperature of cylindrical roller bearings in both systems is presented. The Figure 33 demonstrates that with an increase in the radial load, the temperature of the bearings in the tester system increases from 369.53 to 401.79 K, indicating an increase of 32.26 K, or 8.7%. The overall temperature rise exhibits a rapid acceleration in its rising trend. In the single bearing system, the temperature of the inner and outer rings of cylindrical roller bearings increases from 378.13 to 449.83 K, with a temperature increase of 70.70 K, an increase of 18.7%. The overall temperature rise is characterized by a rapid increase followed by a slow increasing trend. The temperature rise under the tester system is found to be 1.19 times greater than that under the single bearing system. Furthermore, the temperature difference between both systems gradually increases as the load continued to increase. A comparison reveals that the influence of load on the temperature of the cylindrical roller bearing is similar to that of rotational speed. Both load and rotational speed increase the heat generation during bearing operation, leading to a rise in bearing temperature. A significant difference in the temperature of the cylindrical roller bearing is observed between the two systems, which is likewise attributable to differences in the lubrication configuration of the respective systems.

Effect of different radial loads on temperature of cylindrical roller bearing.
Conclusion
The present paper establishes a simulation model of under-ring oil injection lubrication of cylindrical roller bearings in single bearing systems and tester systems. A comparative study on the lubrication performance of cylindrical roller bearings under two systems is conducted. Based on a comprehensive analysis, the following conclusions can be drawn:
With an increase in oil supply velocity, the average oil volume fraction within cylindrical roller bearings in tester system consistently surpasses that in single bearing systems. The average oil volume fraction in the single bearing system increases by 4.75 times, while that in the tester system increases by 1.47 times. The temperature of cylindrical roller bearings in both systems exhibits a decrease of 9.5% and 10%, respectively. Both systems demonstrate a near-linear decrease in temperature.
With an increase in rotational speed, the circumferential oil distribution patterns within cylindrical roller bearings exhibit distinct periodic characteristics between the two systems. The average oil volume fraction diminishes by 86.4% in the single bearing system and the average oil volume fraction reduces by 79% in the tester system, which is 3.43 times greater than that in the single bearing system. In the single bearing system, the bearing temperature increases gradually with the increase of rotational speed, showing an obvious near-linear growth trend and the temperature increased by 10.8%. In the tester system, the temperature increases rapidly with the increase of rotational speed, showing an accelerated growth trend and the temperature increased by 21%. The temperature increase in the tester system was 1.98 times that of the single bearing system.
With the increase of load, the average oil volume fraction in the single bearing system decreased insignificantly, while the decrease in the tester system is relatively large. In the single bearing system, the bearing temperature exhibits an 8.7% increase and the overall temperature rise demonstrates an accelerating trend. In contrast, the cylindrical roller bearing temperature in the tester system increases by 18.7%, exhibiting a trend of initial rapid increase followed by gradual rise. The temperature rise in the tester system is 1.19 times that of the single bearing system. Furthermore, with an increase in the load, the temperature rise difference between the cylindrical roller bearings in the two environments is observed to increase.
Footnotes
Handling Editor: Qibin Wang
Funding
The authors disclosed receipt of the following financial support for the research, authorship, and/or publication of this article: This research was funded by the National Natural Science Foundation of China (grant no. 52105060) and the Special Transmission Project (grant no. KY-1044-2023-0458).
Declaration of conflicting interests
The authors declared no potential conflicts of interest with respect to the research, authorship, and/or publication of this article.